


About 16 million girls aged 15–19 years plus another 1 million under 15 years of age give birth each year worldwide( 1 ). Complications during pregnancy and delivery are the main cause of death in adolescent mothers, especially in developing countries( 1 ).
Correct nutritional diagnosis in early pregnancy could prevent adverse perinatal outcomes associated with inappropriate feeding practices( Reference Johnson and Moore 2 ). However, the resources to assess the nutritional status of pregnant adolescents are limited. BMI is widely used as a predictor of nutritional status and pre-pregnancy BMI is used as the premise of the recommendation for gestational weight gain (GWG)( 3 ). GWG plays an important role in perinatal outcomes. When insufficient, it is related to fetal growth restriction; when excessive( Reference Godoy, Nascimento and Surita 4 ), GWG is related to gestational diabetes, hypertensive disorders and higher rate of caesarean birth. In addition, excessive GWG increases the likelihood of weight retention postpartum and future obesity in women( Reference Godoy, Nascimento and Surita 4 ).
In 2009 the Institute of Medicine published a guideline with a reviewed GWG recommendation( 3 ) using the WHO classification of BMI from 1995( 5 ) (see online supplementary material, Supplemental File 1). However, this recommendation was based on North American adult women and tended to overestimate the proportion of adolescents with low weight, especially in girls under 16 years old( Reference Contreras-Campos, Rodríguez-Cervantes and Reza-López 6 ). In contrast, BMI expressed in percentiles proposed by the 2006 WHO Child Growth Standards (CGS)( 7 ) are used for clinical monitoring of children and adolescents and do not take into account the coexistence of pregnancy (see online supplementary material, Supplemental File 2). Thus, the same pregnant adolescent can be classified in two distinct categories of BMI and receive different recommendations for GWG( Reference Contreras-Campos, Rodríguez-Cervantes and Reza-López 6 ).
Another way of categorizing these adolescents is to classify them according to their gynaecological age (GA), which is calculated by subtracting the chronological age at menarche from the chronological age at the time of conception( Reference Kaplanoglua, Bülbüla and Koncab 8 ). Menarche is an important step in the achievement of reproductive capacity and is used as an important risk factor for obstetric and perinatal complications( Reference Kaplanoglua, Bülbüla and Koncab 8 , Reference Zlatnik and Burmeister 9 ).
The objectives of the present study were: (i) to appraise the most appropriate BMI classification for pregnant adolescents between the three most used methods, namely the WHO recommendation for adult women, the 2006 WHO CGS and according to GA; and (ii) to suggest the best way of monitoring GWG in adolescents through the evaluation of perinatal outcomes according to adequacy of GWG.
Methods
Study design and sample
The present study had a prospective cohort design, being part of a larger study.
The sample size was calculated according to BMI distribution and weight gain prevalence. Recent data showed a 1:2 ratio of women with low BMI to women with overweight or obesity. Also, Harper et al.( Reference Harper, Chang and Macones 10 ) found the prevalence of inadequate weight gain in pregnancy to be 27·1 % in women with low initial BMI and 71·0 % in women with overweight or obese initial BMI. Considering a 5 % significance level, the difference between the prevalence and a loss to follow-up of 20 %, the sample size was a minimum of 138 subjects.
Participants
The study was conducted at Prof. Dr Jose Aristodemo Pinotti Women’s Hospital (CAISM) in the University of Campinas, Brazil, which is a reference centre in women’s health care, has an interdisciplinary and multi-professional team, and runs a specialized outpatient clinic for teenagers.
All primiparas aged 19 years or younger who started prenatal care with less than 20 weeks of gestational age were invited to the study. Teens who accepted to participate in the study provided informed assent and informed consent.
Adolescents who had restriction to bioelectrical impedance analysis were not invited to participate, since the study made use of this resource.
Follow-up
At the first prenatal care visit, adolescents answered a standardized and pre-tested questionnaire covering pre-pregnancy weight, sociodemographic data, gynaecological history and lifestyle habits (practice of physical activity, smoking status and current alcohol consumption). Anthropometric assessment (weight, height, subcutaneous adiposity by bioelectrical impedance analysis) and a 24h dietary recall were also collected.
The anthropometric assessment and 24h dietary recall were conducted two more times, during the second and third trimester of pregnancy.
A last interview was conducted during the first postpartum visit, collecting their anthropometric assessment and a 24h dietary recall. Weight in the last prenatal visit, weight at delivery and perinatal outcomes were collected through medical records (Fig. 1).
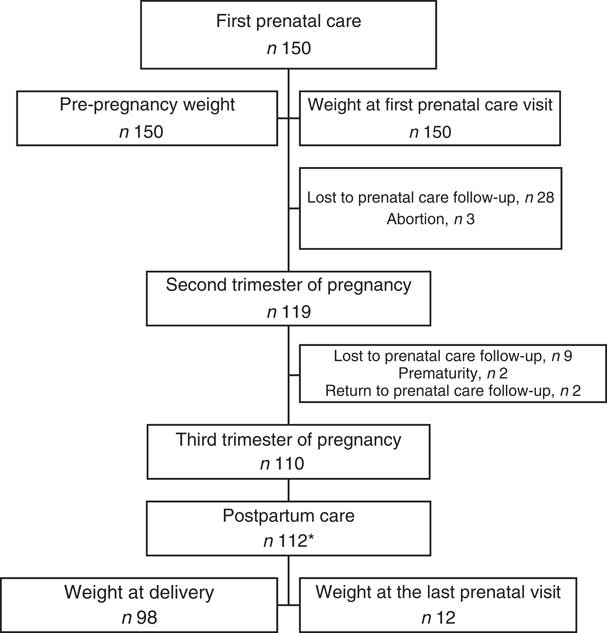
Fig. 1 Flowchart showing the selection of patients for the present study and follow-up. *Two participants who did not follow prenatal care at the research hospital returned for delivery and their weights at delivery were included for analysis of gestational weight gain
All interviews were conducted face-to-face by the main researcher and pre-trained medical students.
Anthropometric assessment
Weight and height of the barefoot pregnant adolescents were routinely measured by local trained professional nursing staff, according to the outpatient protocol, using an anthropometric scale and a Toledo® stadiometer. BMI at the first prenatal visit was calculated based on their measured height and weight at the first prenatal visit. Pre-pregnancy weight was self-reported and used to calculate pre-pregnancy BMI.
After calculation, BMI was classified according to: the WHO recommendation for adult women( 5 ); the CGS of BMI-for-age for girls aged 5–19 years published in 2006 by WHO( 7 ); and according to their GA( Reference Zlatnik and Burmeister 9 ).
The WHO classification does not take the woman’s age into account and is divided into: underweight (BMI<18·5 kg/m2), healthy weight (BMI=18·5–24·9 kg/m2), overweight (BMI=25·0–29·9 kg/m2) and obesity (BMI≥30·0 kg/m2)( 5 ).
The CGS classification does not consider pregnancy and is adjusted by gender and age, being classified in Z-scores: severe obesity (above Z-score 3), obesity (above Z-score 2), overweight (above Z-score 1), healthy weight (Z-score above 0 and below −1), wasted (below Z-score −2) and severely wasted (below Z-score −3)( 7 ). The CGS classification utilized the software Anthro Plus® for personal computers, version 3.1, developed by WHO( 11 ).
Moreover, for the BMI classification through GA, adolescents were divided into two groups: girls with GA greater than or equal to 3 years, who were considered adults and classified according to the WHO recommendation; and girls with GA less than 3 years, who were considered children and classified according to the CGS.
GWG was defined as the difference between weight at delivery and self-reported pre-pregnancy weight. When weight at delivery was missing, the weight in the last prenatal visit was considered( Reference Kominiarek and Peaceman 12 ).
After that, based on the categories of pre-pregnancy BMI according to all three different methods, the adequacy of GWG was generated according to the Institute of Medicine recommendations( 3 ). The adequacy of GWG was classified into the following categories: insufficient, adequate or excessive.
These categories were used to compare the methods according to a single reference of GWG, but with different references of pre-pregnancy BMI classification.
Statistical analysis
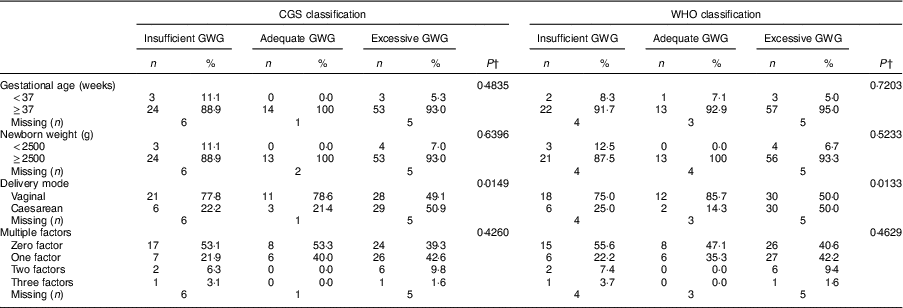
The difference between self-reported pre-pregnancy weight and weight at the first prenatal visit was evaluated using the paired Wilcoxon test. From these findings, the self-reported pre-pregnancy weight was assumed as pre-gestational weight for the following analyses. The agreement between methods for GWG was evaluated using the weighted kappa coefficient (κ w) and 95 % confidence interval. Only CGS and WHO classifications were used, since WHO and GA classifications presented a strong agreement. Fisher’s exact test was used for analysing associations between the perinatal outcomes and BMI classifications. The significance level for the statistical tests was 5 % and the statistical software package SAS version 9.4 for Windows was used for the analysis. All items of the STROBE (Strengthening the Reporting of Observational Studies in Epidemiology) consensus were followed( Reference Von Elm, Altman and Egger 13 ).
Results
The study included 150 adolescents with age range from 12 to 19 years and mean age of 15·4 (sd 1·3) years. Their mean age at menarche was 11·6 (sd 1·3) years and mean gestational age at the first prenatal visit was 15·1 (sd 3·6) weeks (data not shown). Demographic social, gynaecological and lifestyle characteristics of the pregnant adolescents in early pregnancy are presented in Table 1.
Table 1 Sociodemographic, gynaecological and lifestyle characteristics of pregnant adolescents (n 150) in early pregnancy. Campinas, Brazil, September 2014 to July 2017
* Social class classification of the Brazilian Government. Classes E/D are comprised of families with household per capita income below or equal to the poverty line. Class C are those with household per capita income between the median and the ninth decile of the income distribution( Reference Paiva, Silva and Feijó 30 ).
Mean self-reported pre-pregnancy weight and mean weight at the first prenatal visit were 55·9 (sd 11·0) kg and 57·6 (sd 11·0) kg, respectively, with a weight variation of 1·7 (sd 4·1) kg, without statistical difference (data not shown).
Mean pre-pregnancy BMI was 22·2 (sd 4·0) kg/m2, with a prevalence of overweight and obesity of 30·6 % by the CGS classification and of 17·3 % by WHO and GA classifications (Fig. 2). Besides, the WHO and GA classifications presented a strong agreement with each other according to pre-pregnancy BMI (κ w=0·99; 95 % CI 0·97, 1·00) and according to weight at the first prenatal visit (κ w=1·00; 95 % CI 1·00, 1·00). However, they presented very low agreement with the CGS classification according to pre-pregnancy BMI (κ w=0·62; 95 % CI 0·50, 0·74 for WHO; κ w=0·62; 95 % CI 0·51, 0·74 for GA) and low/very low agreement according to weight at the first prenatal visit (κ w=0·70; 95 % CI 0·59, 0·81 for WHO; κ w=0·62; 95 % CI 0·51, 0·74 for GA; Table 2).
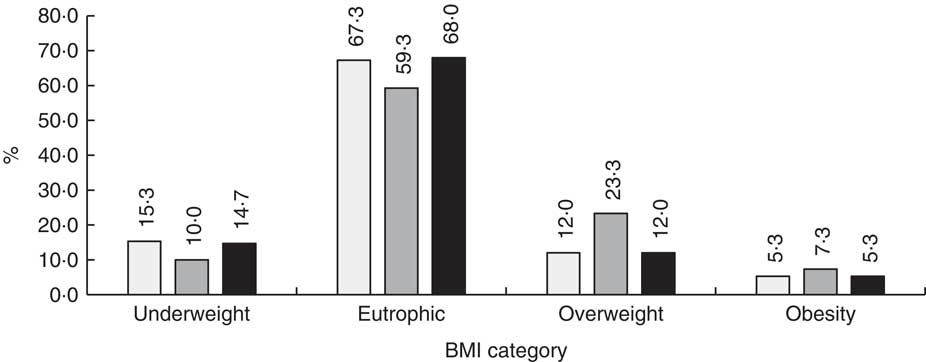
Fig. 2 BMI classification of pregnant adolescents (n 150) according to three methods: WHO recommendation for adult women(
5
) (![]() ), 2006 WHO Child Growth Standards(
7
) (
), 2006 WHO Child Growth Standards(
7
) (![]() ) and gynaecological age(
Reference Zlatnik and Burmeister
9
) (
) and gynaecological age(
Reference Zlatnik and Burmeister
9
) (![]() ). Campinas, Brazil, September 2014 to July 2017
). Campinas, Brazil, September 2014 to July 2017
Table 2 Agreement between three methods of classification of BMI among pregnant adolescents (n 150), according to pre-pregnancy weight referred by the adolescent and weight measured at the first prenatal visit. Campinas, Brazil, September 2014 to July 2017
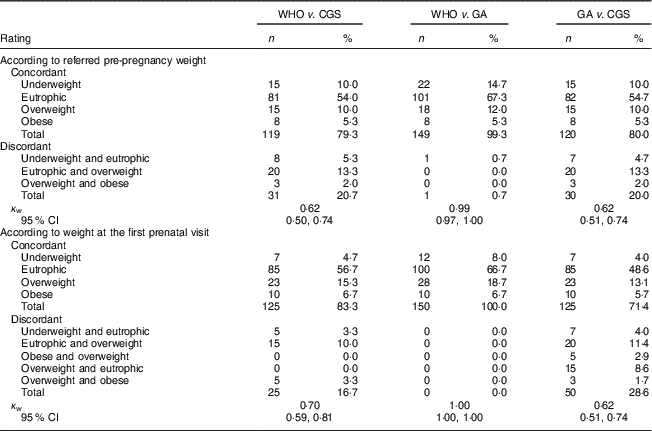
WHO, WHO recommendation for adult women( 5 ); CGS, 2006 WHO Child Growth Standards( 7 ); GA, gynaecological age( Reference Zlatnik and Burmeister 9 ).
Mean weight at delivery was 69·5 (sd 11·1) kg, with a mean GWG of 13·1 (sd 5·6) kg (Fig. 3). An inadequate GWG was observed in 64·4 and 62·7 % of adolescents according to the CGS and WHO, respectively.
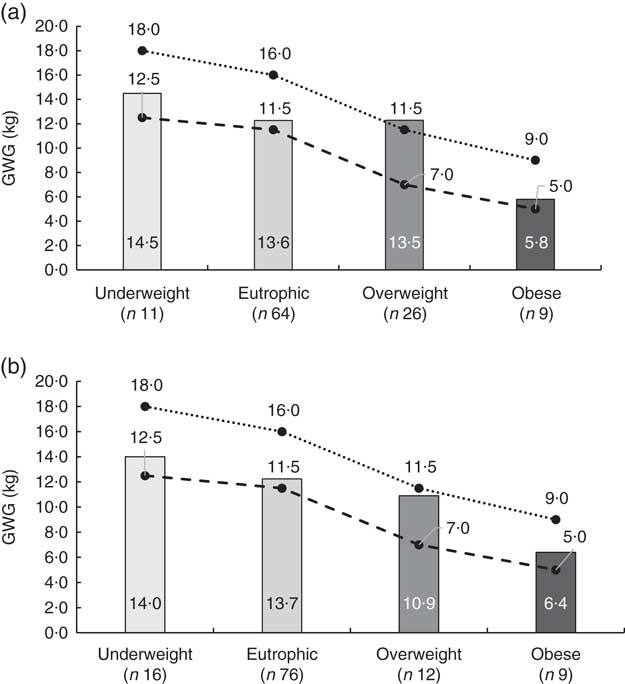
Fig. 3 Mean gestational weight gain (GWG) among pregnant adolescents (n 150) according to pre-pregnancy BMI category, showing the agreement between two methods of classifying pre-pregnancy BMI: (a) 2006 WHO Child Growth Standards( 7 ); (b) WHO recommendation for adult women( 5 ). Also shown are the corresponding maximum (· · ● · ·) and minimum (– – ● – –) values of GWG in kilograms from the Institute of Medicine for each pre-pregnancy BMI category( Reference Zlatnik and Burmeister 9 ). Campinas, Brazil, September 2014 to July 2017
More than two adverse perinatal outcomes were observed in 13·2 % of the infant–mother dyads. Among babies, 9·7 % presented gestational age less of than 37 weeks, 9·7 % weighed less than 2500 g at birth and one baby presented a 5 min Apgar score below 7. Besides, the rate of caesarean surgery was 36·9 % among the adolescents, 50 % presented anaemia during the pregnancy and 6 % presented gestational diabetes.
A higher rate of caesarean delivery was observed among adolescents with excessive GWG under both the CGS (P=0·01) and WHO (P=0·01) classifications. No other significant associations were found for the other perinatal outcomes evaluated (Table 3).
Table 3 Associations between gestational weight gain (GWG)Footnote * and perinatal outcomes among adolescents (n 150) according to two methods of BMI classification. Campinas, Brazil, September 2014 to July 2017
Discussion
The present study showed a positive correlation between BMI classified according to WHO and GA for pregnant adolescents but did not show an agreement between these classifications and BMI classified according to CGS, with a high prevalence of overweight and obesity in all three methods. However, when the associations between GWG and perinatal outcomes were analysed, similar results were found by WHO and CGS classifications, with a high prevalence of inadequate GWG and a positive correlation between one another, despite the WHO classification being inappropriate for classifying BMI in adolescents and an adolescent-specific GWG guideline being needed. However, the WHO method is easily applied and better known among health professionals compared with the CGS method.
A high prevalence of overweight and obesity was observed by the three classifying methods. However, BMI classified using the CGS method differed from the other two classifications (WHO and GA) in overestimating underweight in female adolescents, thus decreasing the proportion of overweight and obese adolescents in the sample. Similar results were found in a cross-sectional study that included 826 adolescent mothers; with a low discrepancy of 5 % by CGS in relation to the WHO classification( Reference Barros, Saunders and Santos 14 ). When compared with other references of BMI used to assess child anthropometric status, overweight and obesity prevalence is higher according to the CGS classification method( Reference Partap, Young and Allotey 15 ). Accordingly, the choice of reference when calculating BMI may influence conclusions about the anthropometric status of adolescents and their related malnutrition prevalence( Reference Partap, Young and Allotey 15 ) and may influence strategies about public health interventions.
An advantage of growth chart classifications is the fact that they account for the chronological age and gender of the adolescent( Reference Barros, Saunders and Santos 14 , Reference Amaral, Vasconcelos and Torloni 16 ). In contrast, the WHO classification, which does not take account of these variables, showed a strong agreement with the GA classification, which does account for the gender and sexual maturation of the adolescent( Reference Kaplanoglua, Bülbüla and Koncab 8 , Reference Zlatnik and Burmeister 9 ).
The prevalence of adolescents in the present study who started pregnancy being overweight or obese (30·6 % according to the CGS and 17·3 % according to the WHO and GA) is a call to action, as it reflects the global epidemic of overweight and obesity among young people( Reference Ng, Fleming and Robinson 17 ). In addition, the low response of pregnant teens to GWG recommendations can be understood as the high prevalence of inadequate GWG (40 %) found among adolescents. Similar results have been described not only among pregnant adolescents( Reference Groth, Holland and Smith 18 ) but also adult women( Reference Deputy, Sharma and Kim 19 ).
Along with this, studies have shown that women with a pre-pregnancy BMI classified as overweight tend to present a higher GWG when compared with obese women( Reference Deputy, Sharma and Kim 19 , Reference Starling, Brinton and Glueck 20 ). It is important to highlight that an excessive weight gain during pregnancy is associated with higher weight retention in the postpartum period, higher GWG in next gestations and obesity in adulthood( Reference Deputy, Sharma and Kim 19 , Reference Neves, Kasawara and Godoy-Miranda 21 ).
Adverse perinatal outcomes are also related to higher pre-pregnancy BMI and GWG, like diabetes, caesarean delivery and fetal macrosomia( Reference Godoy, Nascimento and Surita 4 , Reference Starling, Brinton and Glueck 20 ). In our study a positive association was observed only between excessive GWG and higher caesarean delivery rate (P=0·0149 by WHO and P=0·0133 by CGS). The prevalence of caesarean delivery in our study population (36·8 %) is greater than that recommended by WHO (10 %)( 22 ), but lower than that found in Brazil (57·5 %)( Reference Giordano, Nascimento and Godoy-Miranda 23 ).
We also found a low prevalence of physical activity among pregnant adolescents (2·7 %). Lack of physical activity favours an increase in body fat, GWG and maternal glucose level, and consequently increases the risk of macrosomia and adiposity in the offspring( Reference Garnæs, Nyrnes and Salvesen 24 ).
In this context, it is essential to highlight the importance of antenatal education in the prevention of inadequate GWG. Studies have been shown that girls who received antenatal education present a higher level of prenatal adaptation( Reference Aba and Kömürcü 25 ) and a higher prevalence of appropriate weight gain( Reference Trotman, Chhatre and Darolia 26 ), showing that the traditional prenatal care model is perhaps not the best way to follow up and give information to pregnant adolescents.
However, it is important to emphasize that pregnant adolescents tend to start prenatal care later compared with adult women( 27 ) and consequently they receive antenatal education late, increasing the risk of obstetric complications. In our study, pregnant teens who were at less than 20 weeks of gestational age were selected, going against the real fact, which may have influenced the prevalence of obstetric complications.
Pregnant girls with a GA of less than 3 years accounted for over a fifth of our sample (22·7 %). Concomitantly with this, chronological age of less than 15 years (28·0 % of our group) also contributes to increased pregnancy risks such as prematurity and neonatal mortality( Reference Johnson and Moore 2 , Reference Contreras-Campos, Rodríguez-Cervantes and Reza-López 6 , 27 , Reference Kirbas, Gulerman and Daglar 28 ).
Furthermore, over a third of the adolescent girls had their menarche before the age of 12 years. This is an important finding, since a case–control study with 101 women showed associations between early menarche and teenage pregnancy and the occurrence of morbid obesity in adulthood and increased probability of a second pregnancy while still in adolescence( Reference Neves, Kasawara and Godoy-Miranda 21 , Reference Timur, Kokanalı and Topçu 29 ).
The high prevalence of abstention from formal education (36·0 %) is a relevant piece of information since many of these adolescents do not have the opportunity to resume their studies later due to the demands of caring for a newborn. This can have negative social and economic effects on the adolescent and her family, and extend to society as a whole, reducing professional opportunities and future income( Reference Neves, Kasawara and Godoy-Miranda 21 , 22 ). Some adolescents had interrupted their studies even before their pregnancy and this indicates social deprivation, related to the aetiology of pregnancy in adolescence. Abstention from formal studies also increases the likelihood of repeated pregnancy in adolescence. In contrast, non-pregnant adolescents have a higher probability of finishing high school( Reference Neves, Kasawara and Godoy-Miranda 21 , 22 ). Along with these findings we found a high proportion lacked paid work (92·7 %), contributing to the increase of the young population that does not study and does not work.
Strengths and limitations
To our knowledge, the present study is the first comparing the BMI classification of pregnant adolescents according to WHO, CGS and GA methods, and our findings help future researchers and health professionals to classify these women and give them a better orientation about GWG. Along with this, our study contributes to achieving the Global Goals for Sustainable Development proposed by the UN( 27 ), with emphasis on Goal 3: ‘Good Health and Well-Being’, providing better-quality health care for these girls and their babies, reducing perinatal complications, maternal and infant mortality. Moreover, our study contributes to other goals such as quality education, no poverty and gender equality( 27 ). Furthermore, our study has the important strength of using a well-trained team to collect all anthropometric data, minimizing measuring errors.
Nevertheless, the fact that there are no specific recommendations for pregnant adolescents in terms of BMI classification and GWG could affect the interpretation of results. This could be seen as a limitation, but on other hand shows the importance of developing specific parameters for pregnant adolescents. Another limitation of our study is the fact that pre-pregnancy weight was self-recorded and not measured; however, in the majority of cases adolescent pregnancy is not planned, making previous measuring impossible.
Conclusion
The three methods of BMI classification can make it possible that the same pregnant adolescent receives different BMI categorizations and consequently different recommendations for GWG during prenatal care. However, the GA classification provided a critical look on other classifications, allowing us to conclude that the CGS classification overestimates overweight and obesity in this group. Supplementing these results, the analysis of perinatal outcomes was concordant between two methods (CGS and WHO).
Consistent with these results, we conclude that the WHO BMI classification is a good method to assess pregnant adolescents, due to its easy application and greater knowledge among health professionals, allowing more health professionals to assist teens during prenatal care and inform them about the correct GWG for their BMI.
To minimize possible errors, it is important to improve the diagnosis of nutritional status with the assistance of other methods like dietary assessment and percentage of body fat, which can be measured by subcutaneous adiposity and bioelectrical impedance analysis.
Also, these results show the importance of multidisciplinary prenatal care for pregnant adolescents, which, associated with adequate nutritional diagnosis, may be key to reducing adverse perinatal outcomes.
Acknowledgements
Acknowledgements: The authors thank all members of the adolescent prenatal care team for their support during data collection and the research group Reproductive Health and Healthy Habits (SAR3HAS) for helping discuss some results. Financial support: This research received no specific grant from any funding agency in the public, commercial or not-for-profit sectors. Conflict of interest: The authors declare no conflicts of interest. The authors are responsible for the content and writing of this article. Authorship: The research question and study design were formulated by M.P.-P., J.L.P.S. and F.G.S. Data collection was carried out by M.P.-P., D.S.M.P. and M.Y.C. Data were analysed by S.S.M. and interpreted by all authors. The manuscript was drafted by M.P.-P. and D.S.M.P., and critically reviewed by S.S.M., F.G.S. and J.L.P.S. Ethics of human subject participation: This study was conducted according to the guidelines laid down in the Declaration of Helsinki and all procedures involving human patients were approved by the Institutional Review Board from the University of Campinas, Brazil (CAAE report: 35521414.2.0000.5404). Written informed consent was obtained from all patients.
Supplementary material
To view supplementary material for this article, please visit https://doi.org/10.1017/S1368980018002768


