


School meals, including the National School Lunch Program and School Breakfast Program, are an important source of food and nutrition for millions of students across the USA(Reference Ralston, Treen and Coleman-Jensen1). School meals have been shown to reduce household food insecurity and contribute to positive child health outcomes. Nearly half of all students across the country are eligible for subsidised school meals(Reference Kay Fox and Gearan2). Three of every four meals served are provided for free or at a reduced price(Reference Ritchie3). Motivated by the high administrative burden to promote and manage subsidised meals and barriers to student participation including stigma and eligibility confusion, Congress authorised the community eligibility provision (CEP) as part of the Healthy, Hunger-Free Kids Act in 2010(Reference Billings and Aussenberg4–Reference Fleischhacker and Campbell6). After a successful pilot in ten states, the programme was rolled out nationwide, including in Texas, in the 2014–2015 school year(Reference Billings and Aussenberg4,Reference Logan, Connor and Harvill7) . CEP allows schools the option to serve free meals to all students if 40 % or more of the enrolled student body are considered ‘Identified Students’, meaning they are automatically eligible for free school meals without a paper application because they fit a predefined life situation or are participating in other means-tested programs, such as Supplemental Nutrition Assistance Program and Temporary Assistance to Needy Families Program. This percentage is defined as the Identified Student Percentage (ISP). Schools with an ISP >62·5 % can be reimbursed for all meals at the free meal rate(Reference Billings and Aussenberg4,Reference Hewins, Levin and Segal8) .
In this paper, we ask how much adoption of the CEP program changes student meal participation across Texas. This question is important operationally and useful to inform ongoing implementation and policy reform. Furthermore, if CEP is to be expected to impact outcomes further along a theory of change such as child behaviour and academic achievement, it must first impact meal participation. Schools choose to opt into the programme and face both incentives and disincentives to doing so; the change in meal participation is a key parameter in the cost–benefit calculation program administrators undertake in the decision whether to participate(9). Schools may lose some revenue from serving students who were previously full- and reduced-price meals for free, but also face potential for administrative cost savings and higher federal reimbursement rate(Reference Gruber10). Evidence of programme uptake and meal participation can help guide schools in deciding whether to opt into CEP and to evaluate whether the policy is having its desired impact on students’ access to school meals(Reference Bartfeld11).
Although Texas served more school lunches than any other state in 2019 serving about 560 million meals in fiscal year 2019, its school meal participation rate has roughly stayed unchanged at 3·3 million students in recent years(12). At the same time household food insecurity in Texas has remained above the national average for over a decade. Looking at 2017–2019 data averages, 13·1 % of Texan households were food insecure as compared with the national average of 11·1 % food insecure households, statistically significant. Texas is among only eleven states that have a prevalence of food insecurity statistically higher than the national average(Reference Coleman-Jensen, Rabbitt and Gregory13). In addition, though the percent of eligible schools opting into CEP has been increasing annually, adoption in Texas remains below the national average(Reference Mauricie, Rosso and FitzSimons14). In school year 2018–2019, only 50·7 % of Texas eligible schools (2716 out of 5103 schools) adopted CEP, as compared with the national average of 64·6 % of US eligible schools adopting the provision(Reference Mauricie, Rosso and FitzSimons14). No studies to date have estimated the impacts of CEP in Texas. With about 1·5 million students enrolled in Texas schools in school year 2018–2019(Reference Mauricie, Rosso and FitzSimons14) and enrollment continuing to grow, evidence from the present study could be useful to Texas programme administrators making decisions about whether to adopt CEP in their schools to feed students as well as to contribute to the growing body of impact evaluations regarding the programme across the country(Reference Hecht, Pollack Porter and Turner5,Reference Taylor, Garnett and Horton15–Reference Gross, Kelley and Augustyn22) .
Only 5 years into the nationwide implementation, studying the impacts of CEP is an active area of research to which this paper contributes. Evidence on the immediate and proximate impacts of CEP adoption has consistently been shown to be positive, but modest. In the pilot states, CEP increased lunch participation by 3·54 percentage points and breakfast by 3·6 percentage points(Reference Logan, Connor and Harvill7). In California, breakfast participation increased approximately 3·5 percentage points in the year after adoption of a universal meal provision (including but not limited to CEP)(Reference Turner, Guthrie and Ralston21). There was a larger impact on lunch participation, increasing 5·8 percentage points in the year after adoption(Reference Turner, Guthrie and Ralston21). School administrators surveyed in all participating schools across Vermont reported perceiving a wide range of benefits for students and the school community. Most agreed that student presentation of hunger symptoms declined, perceived readiness to learn improved, family financial stress appeared to be lessened and differences in family resources across students were less noticeable(Reference Taylor, Garnett and Horton15). Across six of the pilot states, researchers estimated a 46 % increase in breakfast participation and 11 % for lunch participation, equating to approximately twenty-four additional breakfasts per student per school year and twelve additional lunches(Reference Ruffini, Hoynes and Bitler23).
Several studies have looked at the impact of CEP and other universal meals programmes on more distant student outcomes including attendance, academic performance and behaviour. In a sample of elementary schools serving low-income students in Wisconsin, schools participating in CEP saw a small increase in student attendance the second year after adoption(Reference Bartfeld, Berger and Men17,Reference Bartfeld, Berger and Men24) . In six pilot states, researchers estimated CEP adoption increased math scores by 0·07 standard deviations(Reference Ruffini, Hoynes and Bitler23). In New York City middle schools, adoption of universal school meals increased participation among students not eligible for free or reduced-priced meals by 11 percentage points and by 5·4 percentage points for poor students(Reference Schwartz and Rothbart19). Using adoption of the programme as an instrumental variable, the authors estimated the programme increased math and English language arts test scores by 0·08 and 0·07 standard deviations, respectively(Reference Schwartz and Rothbart19). In Texas, where state law (TX SB 376) requires that schools with an 80 % or greater free/reduced-price student eligibility rate have a Universal Free Breakfast Program (regardless whether opting into CEP or not), universal free breakfast was found to have reduced conflict and truant behaviour and the effect was greater in schools with higher levels of conflict prior to programme adoption. A positive impact on test scores was also observed(Reference Norwood25,26) .
Despite the growing literature, few studies use comprehensive, school-level, statewide data. Using a unique 6-year data set of all schools in Texas participating in national school meals programmes (School Breakfast Program and/or NSLP), we use a panel difference-in-difference model to estimate the impact of opting into CEP on the percentage of students who participate in the School Breakfast Program and NSLP in Texas from 2013 to 2019. We include all schools eligible in at least one of the 6 years (‘eligible’) and who choose to opt into the programme in at least one of the 6 years (‘ever adopters’). We find that among the eligible, ever-adopter schools, opting into CEP increases breakfast participation by 4·59 percentage points year-round, and 4·64 when excluding months many schools are on summer recess (June, July and August) (P < 0·001). We find a slightly smaller impact for lunch, increasing participation by 4·32 percentage points throughout the year and 4·61 percentage points when excluding the summer months (P < 0·001). We expect the results of the current study to be directly beneficial to the Texas Department of Agriculture, the agency responsible for school meals oversight, and more broadly to contribute to the growing literature on the implementation and impact of the CEP program. These results could aid CEP expansion efforts in Texas, and overall, guide Texas Department of Agriculture in making future NSLP and School Breakfast Program program and policy decisions.
Methodology
Data
Our analysis includes six recent years of Texas school meals data (2013–2019), from 1 year prior to CEP availability in Texas through five school years with the programme option. The panel includes all Texas schools participating in the either the SBP or NSLP from 2013 to 2014 school year (baseline) to the 2018–2019 school year. We use school-level data from the Texas Department of Agriculture on meal participation, aggregate student socio-demographic characteristics and meal programme implementation. We merge this with district-level data from the Texas Education Agency containing aggregate district statistics on socio-demographic and community characteristics.
We identify eligible schools as all public or charter schools serving grades K-12 with an ISP of 40 % or higher. We identify schools as eligible in the year prior to CEP adoption (2013–2014) as a baseline by using the schools’ reported ISP in the 2014–2015 school year, since the ISP is based on data from the prior school year. We included all schools eligible for the programme based on this criterion in at least 1 year who chose to opt into the programme in at least 1 year. This is in effect defining eligibility as schools that are ever-eligible throughout the period studied. In supplementary analysis, we test the robustness of our estimates using the subsample of schools who were eligible for the programme in all 6 years and who opted into the programme in at least 1 year (‘always eligible’).
We concentrate on ever-adopter schools to reduce self-selection bias in our estimate of the treatment effect of opting into CEP, since schools who never adopt the programme have been shown to be different than those who do(Reference Hecht, Pollack Porter and Turner5,Reference Ruffini, Hoynes and Bitler23,Reference Rogus, Guthrie and Ralston27) . This has been attributed in part to the reimbursement structure, where schools with an ISP between 40 and 62·5 % are eligible for CEP but not for reimbursement of all meals at the free rate and therefore face a risky financial prospect(Reference Hecht, Pollack Porter and Turner5,Reference Logan, Connor and Harvill7,Reference Mauricie, Rosso and FitzSimons14) . Figure 1 in the supplemental materials illustrates the percent of schools opting into CEP with ISP in the partial-reimbursement range. Our analysis isolates the impact of opting into CEP on meal participation among schools who are inclined to opt in, as evidenced by their eventual adoption. Table 1 shows the number of Texas schools by eligibility and opt-in status, and the percentage of all schools in the state represented in our analysis. Our analysis includes 16 103 school-years, reflecting 2797 unique schools over the 6 year time period. In the first column, we see that in each school year, the number of schools among those who are eligible who ever opt into the programme increases modestly, with a larger increase in 2017–2018 that drops again the following year, likely attributable to waivers in affected districts following Hurricane Harvey allowing CEP participation at full reimbursement(28). We see an increase in the percent of all schools eligible for the programme over the period with a large jump in the 2018–2019 school year likely reflecting an allowance by the USDA Food and Nutrition Disaster Assistance for schools to recalculate their ISP following Hurricane Harvey with the intention of capturing the expected increase in the number of Identified Students(28). Figure 1 illustrates initial adoption averaged about 41 % of eligible schools opting in during the first 3 years of the program with a sharp increase in adoption in the final 2 years of our analysis to over 50 %.
Table 1 Eligible schools in Texas by community eligibility provision (CEP) status and program year


Fig. 1 Percent of eligible schools in Texas participating in community eligibility provision (CEP) by school year
Statistical analysis
We include the 2013–2014 school year as a pseudo baseline, as it is the school year prior to the program roll-out. Since schools chose to adopt in different years, there is no single baseline year. This variation in adoption timing is the key feature of our empirical strategy to causally identify the programme impact. We use a panel two-way fixed effects difference-in-difference model to identify the impact of opting into CEP on meal participation among eligible, ever-adopters. This method has been used in numerous studies of the impact of CEP because it controls for time invariant unobservable factors that might be related to both adoption and meal participation and also controls for differences in meal participation prior to programme adoption(Reference Hecht, Pollack Porter and Turner5,Reference Gruber10,Reference Bartfeld, Berger and Men17,Reference Schwartz and Rothbart19,Reference Ruffini, Hoynes and Bitler23) . The critical assumption required for a panel difference-in-difference to yield an unbiased treatment effect is parallel trends and that the potential outcomes are the same in the absence of the treatment(Reference Gertler, Martinez and Premand29,Reference Imbens and Rubin30) . While the nature of the policy change and variation in adoption timing does not lend itself to a clear test of the parallel trends assumption, graphical representation of the trends in meal participation by CEP status in Fig. 2 below lends confidence that parallel trends holds.

Fig. 2 Average participation in school breakfast and school lunch in Texas by community eligibility provision (CEP) 2013–2019
The outcome of interest is the change in average percentage meal participation. Monthly participation is defined as the number of meals served divided by total enrollment. We estimate the breakfast and lunch outcomes separately. Meal participation is summarised per month, so our results are interpreted as the change in monthly participation rate. Since Texas school districts may not have the same start and end dates of the school year, we estimated our model with and without the summer months, as monthly meal participation data reported for June, July and August may have been imprecise with the variation in meal service periods. In supplementary analysis, we restrict our sample to schools eligible in all 6 years (‘always eligible’) to test the robustness of our participation estimates to the definition of our sample.
Results
Table 2 presents a baseline balance table with the socio-demographic and meal participation summary statistics in the year prior to CEP roll-out (see Table 1 in supplemental materials for descriptive statistics of schools eligible in every year of the study period). This can be considered a pseudo baseline, reflecting the characteristics of the schools in our sample in the year prior to the option of CEP adoption, regardless of the actual year the school chose to opt in. Comparing eligible ever-adopters to eligible never-adopters, we see a statistically significant difference on almost all observable characteristics. Adopting schools have higher meal participation and percent qualifying for free and reduced-price meals, a higher percentage of racial minorities, particularly Hispanic students, and a higher percentage of economically disadvantaged students and English language learners. They tend to be in larger districts in terms of total number of schools and number of students. Interestingly, adopting schools had a higher percentage (though still only one third) of participation in Provision 2, an alternative procedure for meal reimbursement claims through the NSLP aimed at reducing the administrative burden in high need schools, but no difference in the percent of schools participating in the Universal Free Breakfast Program.
Table 2 Baseline statistics and balance by community eligibility provision (CEP) status and eligibility, in Texas, 2013–2014

† Significance reflects pairwise t-test of difference in means between eligible ever-adopters and eligible never-adopters.
*** P < 0·001.
Robust standard errors clustered at the school level.
Table 3 presents the same socio-demographic and meal participation summary statistics as well as the information related to CEP by eligibility and adoption status groups in the years after CEP went into effect (2014–2019). The first column reflects the schools in our analysis, pooling all years so that in each year some schools have adopted CEP and others have not, but all included schools adopt the programme in at least one of the years. Comparing the first column of Table 3 to that of Table 2, we see a slightly higher breakfast and lunch participation rate and a much lower percentage of schools participating in Provision 2 or the Universal Free Breakfast Program, as to be expected since offering CEP would eliminate the need to participate in these other programmes/provisions.
Table 3 Descriptive statistics by community eligibility provision (CEP) status and eligibility, in Texas 2014–2019

Figure 2 shows the average meal participation rates over time by school CEP status per year. It depicts the change in the outcome variable over the time period analysed and helps to provide some intuition for our regression results below. As a reminder, our sample includes only ever-eligible schools – those who were eligible for the programme at least 1 year – and ever-adopters – those who ultimately opted in at least 1 year. Thus, what the figure illustrates is a clear higher average participation rate in the schools when opting into the programme compared with those not opting in that programme year. However, we also see that the overall rate is relatively flat for lunch and declining slightly for breakfast. This is in line with the trends in school meal participation described above and suggests that CEP alone may not be sufficient to reverse the trend of declining school meal participation. This figure also illustrates that the assumption of parallel trends can reasonably be assumed to hold.
Table 4 presents the main results of our regression analysis. We find that opting into the CEP program increases monthly breakfast participation by 4·59 percentage points and lunch by 4·32 percentage points, on average. One possible explanation for the higher effect on breakfast is that Texas schools were required to serve breakfast following the universal breakfast mandate which went into effect in September 2013(26). It is possible that the higher results observed for breakfast reflect the combination of CEP and the fact that breakfast had not been available at school before 2013, and students and parents slowly became accustomed to available breakfast and takeup increased over time as is commonly seen with many new programs. However, we also find that excluding the summer months, we see a slightly higher impact of the programme (moreso on lunch than breakfast), suggesting that the inclusion of the lower participation summer months even with large variation in school calendars, biased our results downward. We find that in the main school year (September through May), opting into the CEP program increases monthly breakfast and lunch participation by 4·6 percentage points, on average.
Table 4 Impact of opting into community eligibility provision (CEP) on school meal participation among eligible, ever-adopter schools, in Texas, 2014–2019
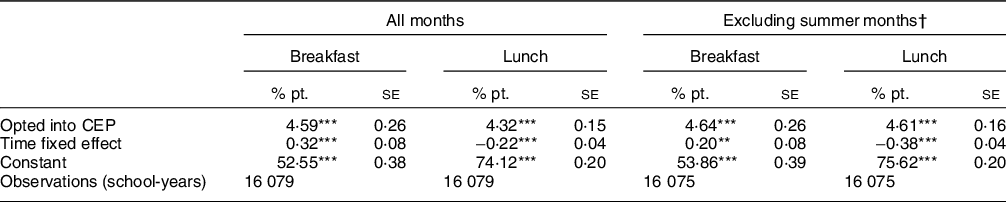
† Summer months defined as June, July and August.
** P < 0·01.
*** P < 0·001.
Robust standard errors clustered at the school level.
In three supplementary analyses, we further investigate the potential heterogeneity in these results. First, we restrict the sample to only schools eligible for the entire time period (see online supplemental Table 2). We observe a higher duration of exposure (time opted in) of 3·9 years and a lower estimated treatment effect of 4·28 and 3·47 percentage points for breakfast and lunch, respectively, when including all months. Excluding summer months the breakfast estimate is unchanged and that of lunch is slightly higher at 3·68 percentage points. All results remain statistically significant. Second, we estimate the model allowing for an interaction with the ISP level, dichotomized by schools with an ISP between 40 % and 62·5 % and those 62·5 % and higher (see online supplemental Table 3). We find that the effect is greater in the schools in the lower ISP category, where more students may experience a change in meal cost as a result of CEP adoption. Specifically, the impact on lunch participation is 5·9 percentage points in schools with 40–62·5 % ISP but only 2·9 % in schools with >62·5 %. These supplementary results are consistent with other findings that the highest need schools who already opted into other provisions and universal meal programmes may see a smaller change when shifting to CEP, or in other words, that schools facing only partial reimbursement may see a greater increase in participation than schools guaranteed to receive full reimbursement(Reference Turner, Guthrie and Ralston21).
Third, we include covariates to control for compositional changes in school and district characteristsics including percent of general eligibility, school size, district size and percent of students qualifying for free or reduced-price meals (see online supplemental Table 4). Controlling for any change in these observable characteristics over time reduces the effect size estimate 1 and 0·5 percentage points for breakfast (with and without summer months, respectively), slightly reduces the estimate for lunch including all months by 0·37 percentage points, but increases the estimate for lunch excluding summer months to 4·86 percentage point increase in lunch participation. These findings confirm the conclusion that there is a positive and stastistically significant impact of opting into CEP on meal participation, but that the effect size is small.
Discussion
In this paper, we have described the characteristics of eligible schools in Texas that choose to opt into CEP and the impact of that choice on school meal participation. We find that among eligible schools, those who choose to adopt CEP are larger districts (by number of schools and total students), have a higher need student body and higher percentage of non-White (largely Hispanic) students. We estimate that opting into the programme results in a 4·59–4·64 percentage point increase in breakfast participation (P < 0·001), on average, with and without summer months. We find the impact on lunch participation to be only slightly smaller, ranging from 4·32–4·61 percentage points (P < 0·001), with and without summer months, respectively.
Our findings are consistent with other studies highlighting a positive, but modest impact of the CEP program on meal participation(Reference Pokorney, Chandran and Long20,Reference Rothbart, Schwartz and Gutierrez31) . The eligible, ever-adopter schools in our sample served a total of 1 529 824 students in the most recent school year for which we have data (2018–2019). Based on that level of enrollment, our estimated increase in breakfast participation throughout the year translates to an additional 70 219 students taking breakfast/d, on average. For lunch, it equates to 66 088 additional lunches served/d, on average. Thus, although the magnitude of the impact may appear small in percentage point terms, we estimate the adoption of CEP in Texas has resulted in tens of thousands of additional breakfasts and lunches served/d, reaching thousands of students who previously would not have taken a school meal, many of whom may have gone hungry. In addition to offering administrative efficiency and reducing barriers to school meal access, another benefit of opting into CEP has emerged in the COVID-19 crisis relief efforts. Many states, including Texas, are providing Pandemic Electronic Benefit Transfer cards to students who qualify for free/reduced meals(32). These benefits are automatically going to all students in CEP schools, likely providing additional much-needed support in high-need communities.
Our study has several strengths, as well as some limitations. Our study is among the few studies to use comprehensive, state-wide administrative data to analyse the impact of CEP on student meal participation and other outcomes. Five years of data after the CEP policy change allows us to estimate the impact in adopting schools based on the variation in adoption timing. Since our sample includes many schools who adopted early on and continued with the programme (mean duration of exposure to CEP was 3·4 years), we also provide initial evidence of the impact to be expected from the programme in the medium-term as students and families become accustomed to free meals at school. One of the limitations of our analysis is the lack of student-level data, which would allow us to analyse the impacts by subpopulations of students within schools and to disaggregate students by factors such as grade level. Student-level data would also be necessary to analyse the impact of free meals at school on household food security and other resources. We also do not have data on attendance, so our estimate of participation with enrollment rather than students in attendance in the denominator may be biased downwards especially in schools with high rates of absenteeism. Since absenteeism is also highly correlated with poverty, we may be underestimating the impact of CEP on meal participation in schools with higher ISP. Finally, evidence from a single state is not generalisable to the rest of the USA. Similar studies using comprehensive, longitudinal administrative data from every state are necessary to understand the true impact of the CEP policy nationwide and to investigate whether its current structure is best achieving the objectives of the Healthy, Hunger-Free Kids Act.
Given the high need in Texas, our results suggest wider adoption among eligible schools could contribute to reversing recent trends in meal participation and increasing the financial and nutritional support provided to students and families through school meals. However, we also note that schools standing to receive only partial reimbursement are also estimated to see a greater increase in participation, with potential financial risks for school budgets. As of 2018–2019, only 46·6 % and 6·4 % of eligible schools in Texas with ISP of 50– <60 % and ISP of 40– <50 %, respectively, adopted CEP, well below the national adoption rates for those lower ISP groups. Though the increase from the previous school year was large enough put Texas among the states who experienced the largest year-on-year growth in CEP adoption, there is still much room to expand meal access(Reference Mauricie, Rosso and FitzSimons14). Over 1·3 million students attend eligible schools who have never adopted the programme and who stand to benefit from continued expansion. Further research is needed to help schools estimate the financial implications of CEP adoption under partial reimbursement and the extent to which this risk explains lack of adoption among eligible schools.
Acknowledgements
Acknowledgements: We are grateful to the Texas Department of Agriculture and the Texas Education Administration for providing access to the data and helpful assistance with our queries about the data. Financial support: No financial support was received by the authors to prepare this manuscript. Kate R Schneider’s time was supported by a Friedman Fellowship at Tufts University. Conflict of interest: The authors declare no conflicts of interest. Tiffany Liu worked at the Texas Department of Agriculture in the summer of 2019. Authorship: J.O. and T.L. conceived the idea. K.R.S. conceived the study design and analysis plan. K.R.S. and J.O. conducted most of the data analysis, with assistance from T.L. K.R.S. drafted the manuscript. K.R.S., J.O., and T.L. contributed to the manuscript revisions. Ethics of human subject participation: The current study was carried out with administrative data. No human subjects were involved, and the study did not require or receive ethics approval.
Supplementary material
To view supplementary material for this article, please visit https://doi.org/10.1017/S1368980021003712


