


Nutrition is a key health determinant that impacts intrinsic capacity and quality of life among older adults( 1 – Reference Amarantos, Martinez and Dwyer 3 ). During the ageing process, food intake and consequently nutritional status may be compromised by changes in sensory functions, mastication and deglutition capacities, and gastrointestinal physiology, as well as by progressive loss of vision and hearing( Reference Wysokiński, Sobów and Kłoszewska 4 – Reference John, Bullock and Brenner 6 ). In addition, chronic conditions (e.g. cancer and dementia), polypharmacy( Reference Guerchet, Prina and Prince 7 – Reference Meijers, Schols and Halfens 9 ), psychosocial (e.g. depression and self-perceived loneliness) and environmental factors (e.g. financial difficulties and living alone)( Reference Tamura, Bell and Masaki 10 – Reference Donini, Scardella and Piombo 12 ), independently or combined, may greatly influence dietary patterns as people age. These aspects, combined with specific nutritional requirements and age-related decline in appetite and consequently food intake, increase the risk of malnutrition among older adults( Reference Soenen and Chapman 13 ).
Malnutrition refers to deficiencies, excess or imbalance in intake of energy and/or nutrients. The present paper focuses on malnutrition due to starvation, disease or advanced ageing, which can be defined as ‘a state resulting from lack of uptake or intake of nutrition leading to altered body composition (decreased body fat mass) and body cell mass leading to diminished physical and mental function and impaired clinical outcome from disease’( 14 ). Diagnostic criteria for malnutrition are not consensual in the scientific community, which results in considerable methodological differences among epidemiological and clinical studies and prevents direct comparison between them. To fill this gap, the European Society of Clinical Nutrition and Metabolism recently recommended the use of BMI, or alternatively unintentional weight loss combined with either reduced BMI (with age-dependent cut-offs) or reduced fat-free mass, to define malnutrition. It was also stated that before diagnosis, it is mandatory that the individual meets the criteria for being at risk of malnutrition by a validated risk screening tool, such as the Mini Nutritional Assessment (MNA®)( Reference Cederholm, Bosaeus and Barazzoni 15 ).
Malnutrition is associated with negative health outcomes, including increased risk of falls, immune dysfunction, decreased quality of life, more and longer hospitalisations, and ultimately higher mortality( Reference Neyens, Halfens and Spreeuwenberg 16 – Reference Norman, Pichard and Lochs 19 ). To worsen this scenario, malnutrition risk factors, such as depression and cognitive impairment, are also becoming more prevalent as the world’s population ages. These conditions increase disability, thus impacting the individual’s intrinsic capacity to continue to be and to do what s/he values( Reference Guerchet, Prina and Prince 7 , Reference Alexopoulos 20 , Reference Kassebaum, Arora and Barber 21 ). Additionally, the association between malnutrition and disability can work both ways: malnourished individuals are more likely to be dependent in activities of daily living, and disabled individuals are at greater risk for nutritional problems given their greater dependence on others( Reference Amarantos, Martinez and Dwyer 3 , Reference Inzitari, Doets and Bartali 22 ).
Despite the aforementioned lack of consensus on diagnostic criteria and the absence of a gold standard concerning screening tools, malnutrition has been identified as a prevalent problem in older adults, particularly among those living in nursing homes( Reference Bell, Lee and Tamura 23 ). A literature review based on fifty-three studies (n 50 957) that used the same screening tool (MNA®) concluded that 4·2 % of community-dwelling older adults were malnourished and 27·4 % were at risk of malnutrition( Reference Cereda 24 ). However, when considering nursing home residents (seventy-three studies, n 20 410), the prevalence was even higher, reaching 27·2 and 52·1 %, respectively( Reference Cereda 24 ).
Differences in autonomy, cognitive function and emotional state between well-nourished and malnourished individuals seem to be more pronounced among those who live in nursing homes( Reference Donini, Scardella and Piombo 12 ). Structural factors (type of funding, management, capacity or location) of the nursing home may impact malnutrition prevalence. Interventions targeted at improving nutrition in nursing homes have been identified as a priority( Reference Morley, Caplan and Cesari 25 ). In fact, interventions aimed at reverting weight loss, including fat-free mass loss, have proved to be effective if administered in time( Reference Bell, Lee and Tamura 23 ). Moreover, most of the negative social, psychological and physical conditions associated with worse nutritional status are partly responsive to treatment, so they should also be correctly identified and treated( Reference Soenen and Chapman 13 ).
The institutionalised population in Portugal is heterogeneous in terms of level of dependence, age of admission and financial situation, among other variables. Residential infrastructures for older people can be permanent or temporary; flats/houses, rooms or a combination of both; and they provide several social support activities and nursing care( 26 ). In 2015, the percentage of rooms was 97 % out of the total offer of residential infrastructures and approximately 80 % received governmental co-funding( 26 ). For the purposes of the present paper, the term ‘nursing home’ is used to refer to the overall context of residential care in Portugal. The percentage of Portuguese older adults who live in nursing homes is approximately 4 %, 20 % of whom are independent and 20 % highly dependent (bedridden or with dementia), thus determining the type of care provided( 26 , 27 ).
Facing the rapid worldwide growth in the number of older adults, it becomes more and more important to better understand and address malnutrition-associated conditions as they affect autonomy and quality of life( 2 ). Despite the magnitude of the problem, malnutrition awareness is still limited. It frequently goes unrecognised and therefore untreated( Reference Donini, Poggiogalle and Molfino 28 ). Nationally representative Portuguese data regarding malnutrition and its associated factors in older adults living in nursing homes are missing. The current study aimed to fill this gap by: (i) characterising the nutritional status of the population aged 65 years or over living in Portuguese nursing homes; and (ii) identifying and characterising malnutrition-associated factors. The study therefore adds a national-level perspective (rather than local or regional) to the knowledge of malnutrition in the less studied nursing home setting. Furthermore, it studies the association between malnutrition and a combination of demographic, socio-economic, eating-related and psychosocial variables.
Methods
Study design and participants
Data presented herein were part of a wider study, the Portuguese Elderly Nutritional Status Surveillance System (PEN-3S). PEN-3S was a cross-sectional study of Portuguese older adults (aged 65 years or over) living in nursing homes in Portugal (mainland, Açores and Madeira islands). Methodological details on PEN-3S, including specific aspects of the sampling method and sample size estimations, are described elsewhere( Reference Madeira, Peixoto-Plácido and Goulão 29 ).
A random cluster sampling was performed in each of the seven Portuguese regions – NUTS II (Nomenclature of Territorial Units for Statistics, as defined by the European Union). The clusters were composed of nursing homes, private or supported by the government, registered with the Portuguese Social Security Institute, which is mandatory. In each region, nursing homes were randomly listed, and were sent an invitation letter accompanied by a full written explanation of the study objectives and methods. Institutions were invited to enrol in subsequent order until the target number of residents, according to sample size estimations, was achieved in each region.
Exclusion criteria were: individuals living in Portugal for less than 1 year; non-Portuguese speakers; absence from the institution during data collection (e.g. due to hospitalisation); those who could not understand and/or answer the questionnaire due to dementia, psychiatric disease or severe hearing and/or visual impairment; and bedridden individuals. All eligible residents aged 65 years or over living in participating nursing homes were invited face-to-face by the interviewer to participate in the study. In cases of acceptance to participate, the interview was conducted in the next few days.
The research protocol followed the Helsinki Declaration( Reference World Medical Association 30 ). Permissions from the National Data Protection Commission and the Faculdade de Medicina, Universidade de Lisboa Ethics Commission were obtained. All volunteer participants signed a written informed consent prior to the beginning of the study( Reference Madeira, Peixoto-Plácido and Goulão 29 ).
Data collection
Data were collected through a computer-assisted face-to-face structured interview followed by anthropometric measurements, conducted by seven trained nutritionists, as described elsewhere( Reference Madeira, Peixoto-Plácido and Goulão 29 ). Data were collected between October 2015 and April 2016.
Demographic and socio-economic data, including age, sex, educational level, marital status, self-perception of financial situation and total time living in the nursing home, as well as data on self-reported morbidity, self-rated appetite in the last 7 d, eating difficulties due to oral health problems in the last 7 d, nutritional status, anthropometry, cognitive function, symptoms of depression, loneliness feelings and functional status, were collected. For demographic, socio-economic, behavioural and morbidity data, the National Food, Nutrition and Physical Activity Survey (IAN-AF) methodology was used and data were collected through the platform ‘YOU, eAT& MOVE’, developed by IAN-AF( Reference Lopes, Torres and Oliveira 31 ).
Single-item measures were used to assess self-perception of financial situation (1=‘very comfortable’ to 5=‘very hard’), self-rated appetite in the last 7 d (1=‘no appetite’ to 5=‘lots of appetite’) and eating difficulties due to oral health problems in the last 7 d (1=‘many’ to 4=‘none’).
Cognitive function
The thirty-item Mini Mental State Examination (MMSE) was used to assess global cognitive function. Questions are grouped into seven categories: (i) temporal and spatial orientation; (ii) working memory; (iii) recall; (iv) attention; (v) arithmetic capacity; (vi) linguistic skills; and (vii) visual–motor skills. The maximum score is 30 points; the minimum cut-offs for inadequate cognitive functioning used in the present study were those validated for the Portuguese population according to the number of years attending school: 0 years, ≤15 points; 1–11 years, ≤22 points; >11 years, ≤27 points. In the present study, MMSE score determined if the individual would answer all questionnaires( Reference Folstein, Folstein and McHugh 32 , Reference Guerreiro, Silva and Botelho 33 ). If MMSE score was lower than the cut-off, the data collected regarded only sociodemographic data, self-rated appetite, self-reported eating-related difficulties and nutritional status (anthropometric measures and MNA®).
Nutritional status
Nutritional status was assessed with the eighteen-item MNA® ( Reference Rubenstein, Harker and Salvà 34 – Reference Guigoz 36 ). The full MNA®, hereinafter referred to as MNA®, is organised into four parts: (i) anthropometry; (ii) dietary assessment; (iii) self-perception of nutritional status and health; and (iv) a general evaluation of lifestyle, medication, depression and dementia. The total score ranges from 0 to 30 points, classifying individuals as normal (24–30 points), at risk of malnutrition (17–23·5 points) or malnourished (<17 points)( Reference Donini, Poggiogalle and Molfino 28 ). This is a valid instrument showing a high association with objective indicators of nutritional status (e.g. triceps skinfold, energy intake, serum albumin) and clinical assessment of nutritional status( Reference Vellas, Villars and Abellan 35 ). Low MNA® scores have been shown to predict worse clinical outcomes and higher mortality( Reference Vellas, Villars and Abellan 35 ).
Anthropometry
Anthropometric measurements followed the International Standards for Anthropometric Assessment of the International Society for the Advancement of Kinanthropometry, with individuals wearing minimal clothing and no shoes( Reference Stewart, Marfell-Jones and Olds 37 ). Weight was measured to the nearest 0·1 kg with a portable calibrated scale (SECA Robusta 813®). Whenever possible, height was measured using a portable stadiometer to the nearest 0·1 cm (SECA 214®); if not, hand length was measured with a fibreglass tape to the nearest 0·1 cm and used to estimate height with the validated equations for the Portuguese population( Reference Guerra, Fonseca and Pichel 38 ). Arm and calf circumferences were measured to the nearest 0·1 cm using a non-extensible, flexible, fibreglass tape (SECA 201®).
BMI was defined as weight in kilograms divided by the square of height in metres (kg/m2). If no BMI could be calculated, the MNA®-Short Form (MNA®-SF) version that uses calf circumference was applied instead( Reference Kaiser, Bauer and Ramsch 39 ). The WHO cut-offs (BMI<18·5 kg/m2; 18·5≤BMI<25·0 kg/m2; 25·0≤BMI<30·0 kg/m2; BMI≥30·0 kg/m2) were used to categorise individuals according to their BMI when this was presented as a stand-alone measure( Reference Cederholm, Bosaeus and Barazzoni 15 , 40 ). It is noteworthy that the BMI item in MNA® (item F) was scored according to MNA instructions (<19·0 kg/m2, 0 points; 19·0–20·9 kg/m2, 1 point; 21·0–22·9 kg/m2, 2 points; ≥23·0 kg/m2, 3 points), thus not following WHO criteria.
Symptoms of depression
The fifteen-item version of the Geriatric Depression Scale (GDS-15) was used to screen for depression symptomatology( Reference Sheikh and Yesavage 41 ). We used a cut-off of 5 to categorise respondents as presenting symptoms of depression (score >5) or not( Reference Pocklington, Gilbody and Manea 42 ).
Functional status: instrumental activities of daily living
The eight-item Lawton scale was used to measure the instrumental daily living activities (IADL). Each item measured by the Lawton scale relies on either cognitive or physical function, although all require some degree of both. Scores range from 0 (low function, dependent) to 8 (high function, independent), and a cut-off of 8 was used to classify individuals as non-dependent( Reference Lawton and Brody 43 ).
Loneliness
The sixteen-item UCLA Loneliness Scale was used to measure participants’ subjective feelings of loneliness and social isolation. Scores range between 16 and 64 points, with higher values indicating higher subjective feeling of loneliness( Reference Russell 44 ). We used the proposed cut-off for the Portuguese population: loneliness feelings if the score is >32( Reference Pocinho, Farate and Amaral Dias 45 ).
Statistical methods
Statistical analyses were performed using the statistical software package IBM SPSS Statistics® version 24 and the statistical significance level was set to 5 %. Data were weighted according to the distribution of the Portuguese population living in nursing homes in each of the seven NUTS II. These weighting corrections and the design effect were adjusted when running statistical procedures (both descriptive and inferential) through complex sample analysis, except for the demographic and socio-economic characterisation for which non-weighted data were used. The normality of the distributions was assessed through the Kolmogorov–Smirnov test, taking into consideration kurtosis values and visual inspection of QQ plots. Between-group differences were assessed using the independent-samples t test or Mann–Whitney U test (continuous variables), the χ 2 test (categorical variables), and ANOVA or the non-parametric Kruskal–Wallis test (more than two groups). To compare two continuous variables, correlation coefficients (r) were calculated using simple correlations after weighting the sample by NUTS II. To identify malnutrition-associated factors at the population level, bivariate and logistic regression complex sample analyses were used to evaluate the associations between malnutrition status (dependent variable, composed of individuals who were malnourished or at risk of malnutrition) and the different variables in study. Clinically relevant covariates with P≤0·10 in the bivariate analysis and with explanatory power were included in the logistic regression. Model 1 was unadjusted; model 2 was further adjusted for sex, age and financial situation; and in model 3 all studied variables were adjusted for each other, except for educational level and marital status to avoid possible collinearity.
Results
Sample characterisation, demographic and socio-economic characteristics
Participants were recruited from the seven Portuguese NUTS II, in a total of seventy-nine randomly selected nursing homes that accepted to participate (participation rate=62 %): nine from Norte region, twelve from Centro, thirteen from Área Metropolitana de Lisboa, eleven from Alentejo, ten from Algarve, fourteen from Madeira and ten from Açores. The vast majority of nursing homes were non-profit organisations, not administered by the government but receiving governmental co-funding. The mean number of residents was 61·3 (sd 46·1).
In total, 1275 individuals were invited to participate in the present study, 1186 of whom accepted to enrol (93 %). The mean number of participating residents from each nursing home was 15 (sd 9·2; range=2–40). Participants and refusals did not differ by sex (72·8 v. 68·5 % women), mean age (83·4 v. 82·5 years old), educational level (89·2 v. 88·7 % with <5 years of formal education) and presence of diseases requiring regular health care (65·8 v. 66·0 %).
Demographic and socio-economic characteristics of the sample are presented in Table 1. Eight hundred and sixty-four (72·8 %) participants were women, and mean age was 83·4 (95 % CI 82·8, 83·7) years. Almost half of the sample (49·2 %) was aged ≥85 years. Regarding marital status, 69·7 % of women were widowed v. 50·9 % of men. Eighty-nine per cent of the sample did not go to school or only attended primary school (<5 years), and 37·4 % considered their financial situation as hard or very hard. The mean length of time living in the current nursing home was 51·7 months (i.e. 4 years and 4 months; 95 % CI 47·9, 55·5 months) and 29·8 % reported living there for >5 years.
Table 1 Demographic and socio-economic characteristics of participants: a nationally representative sample of nursing home residents aged 65 years or over in Portugal, October 2015–April 2016
† For ‘Total time in nursing home (months)’, n 964.
Complex sample analysis revealed that 42·7 (95 % CI 38·5, 46·9) % reported their appetite as ‘3’ and 24·2 % as ‘1’ or ‘2’ on a scale from 1 (‘no appetite’) to 5 (‘lots of appetite’). Also, 59·5 (95 % CI 55·4, 63·4) % reported no eating difficulties due to oral health problems, while 31·5 % reported some/many eating difficulties. Table 2 shows frequencies for several self-reported chronic diseases. For example, 29·8 (95 % CI 24·8, 35·5) % of women and 35·3 (95 % CI 26·1, 45·8) % of men reported clinical diagnosis of type 2 diabetes. Gastrointestinal diseases, arthritis and osteoporosis diagnosis were significantly more frequent among women than men. Overall, 78·9 (95 % CI 71·7, 84·7) % reported having a disease requiring regular health care (e.g. medical appointments and examinations).
Table 2 Eating-related difficulties and other clinical conditions among nursing home residents aged 65 years or over (n 1186) in Portugal, October 2015–April 2016
MMSE, Mini Mental State Examination.
† Second-order Rao–Scott adjusted χ2 statistic to compare between women and men. Significance based on adjusted F and degrees of freedom (complex sample analysis).
Nutritional status and anthropometry
MNA® score was calculated for all participants. MNA®-SF was used instead of the eighteen-item MNA® for 144 participants due to missing weight data (results for participants with missing weight are presented under ‘Nutritional status-associated factors’). According to MNA®, 4·8 (95 % CI 3·2, 7·3) % were classified as malnourished and 38·7 (95 % CI 33·5, 44·2) % at risk of malnutrition. These percentages were higher for women than men: 5·3 (95 % CI 3·3, 8·3) % v. 3·9 (95 % CI 1·9, 7·5) % were malnourished, and 43·6 (95 % CI 38·1, 49·2) % v. 27·5 (95 % CI 20·6, 35·6) % were at risk of malnutrition, respectively (Table 3). The percentage of individuals at risk of malnutrition was significantly higher among those in the upper age group. When taking the educational level into account, risk of malnutrition was more frequent among those who attended school for <5 years. Considering BMI and MNA® categories simultaneously, 52·9 (95 % CI 44·0, 61·7) % of those classified as normal weight (18·5≤BMI<25·0 kg/m2) were at risk of malnutrition according to MNA®. Of those in the pre-obesity category (25·0≤BMI<30·0 kg/m2), 27·6 (95 % CI 21·4, 34·7) % were at risk of malnutrition and 1·4 (95 % CI 0·4, 4·5) % were malnourished.
Table 3 Distribution of sociodemographic characteristics and BMI (WHO criteria) according to nutritional status category (MNA®) among nursing home residents aged 65 years or over (n 1186) in Portugal, October 2015–April 2016
MNA®, Mini Nutritional Assessment.
† Second-order Rao–Scott adjusted χ2 statistic to compare between MNA® categories. Significance based on adjusted F and degrees of freedom (complex sample analysis).
Mean BMI was 27·4 (95 % CI 27·0, 27·8) kg/m2 and it was significantly higher for women (P<0·001), decreasing with age (r=−0·18, P<0·001) and with education (r=−0·10, P=0·001). Using WHO cut-offs, 3·3 (95 % CI 1·9, 5·7) % were classified as underweight, 27·5 (95 % CI 25·0, 30·2) % as normal weight, 40·5 (95 % CI 36·2, 45·0) % as pre-obese and 28·6 (95 % CI 24·8, 32·8) % as obese (Fig. 1).
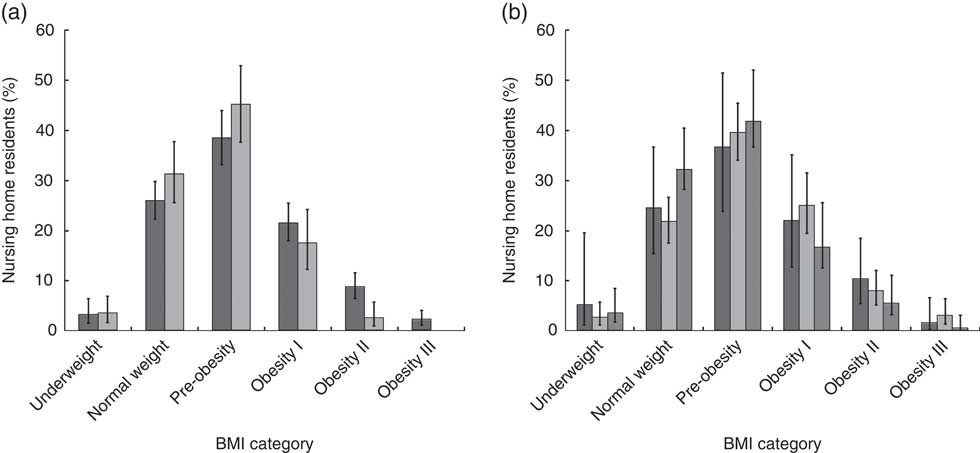
Fig. 1 Distribution of participants by BMI category according to WHO criteria†: (a) distribution by sex (![]() , women;
, women; ![]() , men) and (b) distribution by age (
, men) and (b) distribution by age (![]() , <75 years old;
, <75 years old; ![]() , 75–84 years old;
, 75–84 years old; ![]() , ≥85 years old) among nursing home residents aged 65 years or over (n 1186) in Portugal, October 2015–April 2016. Values are means with their 95 % CI represented by vertical bars. †Underweight, BMI<18·5 kg/m2; normal weight, 18·5≤BMI<25·0 kg/m2; pre-obese, 25·0≤BMI<30·0 kg/m2; obese I, 30·0≤BMI<34·9 kg/m2; obese II, 35·0≤BMI<39·9 kg/m2; obese III, BMI≥40·0 kg/m2
, ≥85 years old) among nursing home residents aged 65 years or over (n 1186) in Portugal, October 2015–April 2016. Values are means with their 95 % CI represented by vertical bars. †Underweight, BMI<18·5 kg/m2; normal weight, 18·5≤BMI<25·0 kg/m2; pre-obese, 25·0≤BMI<30·0 kg/m2; obese I, 30·0≤BMI<34·9 kg/m2; obese II, 35·0≤BMI<39·9 kg/m2; obese III, BMI≥40·0 kg/m2
Cognitive function, symptoms of depression and functional status
According to MMSE cut-offs, 52·5 (95 % CI 46·4, 58·5) % of women and 58·4 (95 % CI 50·7, 65·8) % of men had a non-impaired cognitive function and therefore were considered eligible to answer the full interview. The mean MMSE total score was significantly higher for men (mean=21·9, 95 % CI 21·0, 22·8) than women (mean=19·8, 95 % CI 18·8, 20·8; P<0·001).
The mean GDS-15 total score was 6·1 (95 % CI 5·6, 6·5) and it was significantly higher for women (P<0·001). Using a score of 5 as cut-off, 60·4 (95 % CI 52·9, 67·4) % of women and 37·2 (95 % CI 28·0, 47·4) % of men had symptoms of depression.
Mean score of the Lawton scale was 4·6 (95 % CI 4·3, 4·8), corresponding to the ‘moderate dependence’ category. According to Lawton cut-offs, 11·0 (CI 95 % 8·0, 14·8) % were considered totally dependent, 25·3 (95 % CI 20·8, 30·5) % severely dependent and 12·9 (95 % CI 9·2, 17·9) % independent.
The mean total score for the UCLA Loneliness Scale was 32·3 (95 % CI 31·1, 33·5). Applying this scale’s cut-off point, 42·5 (95 % CI 37·3, 47·9) % reported loneliness feelings, this percentage being 44·4 % for women and 38·6 % for men, without significant differences between these two groups.
Nutritional status-associated factors
Bivariate analysis showed that sex (P<0·001), age group (P=0·019), educational level (P=0·024), marital status (P=0·046), financial situation (P<0·001), appetite (P<0·001) and eating difficulties due to oral health problems (P<0·001) were significantly associated with nutritional status (being at risk of malnutrition or being malnourished v. normal nutritional status; see online supplementary material, Supplemental Table 1). Impaired cognitive function (P<0·001), symptoms of depression (P<0·001), worse functional status to perform IADL (P<0·001) and loneliness feelings (P=0·017) were also significantly associated with malnutrition risk/malnutrition.
As previously mentioned, it was not possible to measure weight for 144 participants and hand length was used to estimate height for the majority of participants (n 887). Those who were not weighed had more eating difficulties due to oral health problems (50·5 v. 29·8 %, P=0·002), were more frequently cognitively impaired (64·3 v. 44·0 %, P<0·001), dependent (99·5 v. 86·4 %, P<0·001) and malnourished (25·2 v. 2·9 %, P<0·001). Individuals whose height was not measured were older (84·8 v. 82·0 years old, P=0·002), and more frequently reported poor or no appetite (26·8 v. 15·0 %, P=0·023), were cognitively impaired (48·5 v. 35·6 %, P=0·010) and at risk of malnutrition or malnourished (48·3 v. 26·3 %, P<0·001).
After adjusting for all studied potential confounders (model 3), loneliness feelings no longer significantly increased the odds of being malnourished (cf. model 2). Results from the adjusted model 3 showed that the OR for being at risk of malnutrition or being malnourished decreased with increasing appetite, 6·5 (95 % CI 2·7, 15·3) for those who self-rated appetite as ‘1’ (‘no appetite’) or ‘2’, and 2·6 (95 % CI 1·2, 5·5) for people rating appetite as ‘3’, compared with those who considered their appetite as ‘4’ or ‘5 (‘lots of appetite’; Table 4). Individuals who reported symptoms of depression (GDS-15 score >5) had an OR for malnutrition risk/malnutrition of 2·6 (95 % CI 1·6, 4·2) compared with non-depressed older adults, and individuals who were classified as dependent (Lawton scale) had an OR of 4·7 (95 % CI 2·0, 11·1) compared with independent older adults. All other studied variables were not significantly associated with malnutrition in the final adjusted model (model 3).
Table 4 OR for likelihood of being at risk of malnutrition or malnourished according to demographic and socio-economic characteristics, appetite, eating-related difficulties and psychosocial variables among nursing home residents aged 65 years or over without cognitive impairment (n 522) in Portugal, October 2015–April 2016Footnote †,Footnote ‡,Footnote §
IADL, instrumental activities of daily living.
*P<0·05.
† OR were estimated using a logistic regression model using complex sample analysis (for model 3, Nagelkerke pseudo R 2=0·302).
‡ Model 1, crude OR; model 2, adjusted for sex, age and financial situation; model 3, adjusted for variables in model 2 plus appetite, eating difficulties due to oral health problems, symptoms of depression, functional status and loneliness feelings.
§ Participants with missing values for any of the independent variables were excluded from the model (n 55).
║ Not adjusted for financial situation.
Discussion
The present study is the first including a Portuguese nationally representative sample of nursing home residents aged 65 years or over, not bedridden nor with diagnosed dementia. The prevalence of malnutrition among older adults residing in nursing homes was 4·8 % and of risk of malnutrition was 38·7 %. The study also found that poor appetite, depression symptomatology and lower IADL functionality independently increased the odds of being malnourished or at risk of malnutrition.
Although sex and age distributions of the collected sample are in line with published international studies, marital status and educational level distributions are different( Reference Strathmann, Lesser and Bai-Habelski 46 , Reference Suominen, Muurinen and Routasalo 47 ). For example, the percentage of widowed participants (64·6 v. 53 %) and of those who only attended primary school (89·0 v. 61 %) were higher in our study than in a Finnish sample of older residents( Reference Suominen, Muurinen and Routasalo 47 ). To our knowledge, the distribution of older adults living in nursing homes in Portugal by sex, marital status and educational level has not been previously described. If our results are compared with the most updated national census information from 2011, the proportions of women, individuals aged 85 years or over, widows/widowers and individuals who attended primary school or less are higher in our sample of institutionalised participants than in the total Portuguese population aged ≥65 years (72·8 v. 58·1 %, 49·2 v. 11·7 %, 64·6 v. 30·6 % and 89·0 v. 82·5 %, respectively)( 48 ). Regarding socio-economic characteristics, it is also worth mentioning that near 40 % considered their financial situation as hard or very hard.
It is well known that malnutrition prevalence differs according to the setting, context, population studied, and instruments used to assess nutritional status. In a review including twenty-nine studies published between 2013 and 2014, the prevalence of malnutrition in nursing homes ranged between 1·5 % (n 1614) and 66·5 % (n 5334), with an overall mean of 21·4 %( Reference Bell, Lee and Tamura 23 ). Furthermore, a systematic review including seventy-seven studies published between 1990 and 2011 reported that MNA® was the most frequently used tool to assess nutritional status. Still, the MNA® malnutrition prevalence rate was wide (0–71 %), although in most of the studies, 20 to 39 % of residents were malnourished and 47 to 62 % were at risk( Reference Bell, Tamura and Masaki 49 ). In thirty-two studies of institutionalised older persons using MNA® (n 6821), the prevalence of malnutrition was 21 (sd 0·5) % (range=5–71 %) and the prevalence of risk of malnutrition was 51 (sd 0·6) % (range=27–70 %). The heterogeneity concerning level of dependence and health status of older residents contributes to explain the wide range observed in the prevalence of malnutrition risk/malnutrition in this population( Reference Guigoz 36 ).
Bedridden, demented and physically or mentally impaired individuals are expected to be in worse nutritional status( Reference Meijers, Schols and Halfens 9 ). These factors may partly explain the low percentages of malnourished individuals detected in the present study, because those considered severely impaired and unable to answer a long questionnaire were excluded. Results reported here are in line with findings from a similar study conducted in a representative sample of the Spanish nursing home population without cognitive impairment: 2·8 % were malnourished, 37·3 % were at malnutrition risk, and the prevalence was lower for men and younger participants( Reference Serrano-Urrea and Garcia-Meseguer 50 ). In contrast, a Belgium study in which 75·6 % of the nursing home residents had a cognitive problem reported that one in five (19·4 %) residents was malnourished( Reference Verbrugghe, Beeckman and Van Hecke 51 ). These results support that a low cognitive status is associated with malnutrition, which might arise by both loss of appetite or indifference to food. These individuals may also forget to eat or not be able to plan and prepare their meals or feed themselves( Reference Wysokiński, Sobów and Kłoszewska 4 , Reference John, Bullock and Brenner 6 ).
In the present study, 3·3 % of the participants were classified as underweight according to WHO cut-offs, 40·5 % presented a BMI between 25·0 and 29·9 kg/m2, and 28·6 % were classified as obese. The percentage of older adults at risk of malnutrition (according to MNA®) was higher among those having normal weight (BMI=18·5–24·9 kg/m2) than among those with pre-obesity (BMI=25·0–29·9 kg/m2; WHO criteria). The MNA® considers several factors that contribute to malnutrition other than BMI to assess the nutritional status. In fact, there has been much controversy in the scientific community with respect to the use of BMI and the most adequate cut-offs, especially for older adults. First, there are limitations to accurately measure weight and height among older persons, given functional limitations to correctly stand by her/himself, as well as due to shrinkage and vertebral collapse. In these cases, the possible bias introduced by use of alternative measures might counteract the misclassification of malnutrition due to direct measurements errors( Reference Gavriilidou, Pihlsgård and Elmståhl 52 ). Second, BMI does not capture changes in body weight or body composition. Weight loss, particularly progressive loss of lean body mass, is common in older ages and of utmost importance to the timely identification and reversal of malnutrition risk( Reference Chang, Beason and Hunleth 53 ). Furthermore, there is good evidence that BMI values below 21·0–22·0 kg/m2 are associated with significant health status deterioration and increased mortality in older people( Reference Soenen and Chapman 13 , Reference Peter, Mayer and Concin 54 ). Also, nutrient and fat storage of ‘pre-obese’ individuals, as considered by the WHO criteria, may protect them from reduction in functional strength, malnutrition and sarcopenia( Reference Soenen and Chapman 13 ). Moreover, micronutrient deficiencies and fat-free mass index were not evaluated in the present study, which could shed light on the coexistence of overweight and risk of malnutrition. Given the aforementioned, when considering risk of morbidity and mortality, it is probable that the BMI cut-offs for older adults may be different from those for younger adults( Reference Peter, Mayer and Concin 54 ). While this is an open discussion, the WHO criteria as used in the present study have been considered standard, allowing comparisons between international studies and the compilation in pooled data analysis( Reference Veronese, Cereda and Solmi 55 , Reference Flegal, Kit and Orpana 56 ).
Both physiological changes associated with ageing and pathology-related factors may cause oral health problems that possibly influence food choices and lead to reduced food intake( Reference Wysokiński, Sobów and Kłoszewska 4 ). Despite more than half of our sample being 85 years old or over, almost 70 % reported few or no difficulties eating due to oral health problems. Regarding appetite, about a quarter (24·2 %) reported little or no appetite in the last 7d. Lack of appetite may be a mediating factor explaining the high risk of malnutrition among depressed persons, due to deterioration of social networks, as well as increased concentrations of serotonin and corticotropin-releasing factor( Reference Wysokiński, Sobów and Kłoszewska 4 ).
After adjusting for potential confounders, the logistic regression model showed that older adults reporting no or little appetite, symptoms of depression, as well as those who were more dependent in daily living activities were also at higher odds of being malnourished or at risk of malnutrition. These findings are supported by relevant literature( Reference Bell, Tamura and Masaki 49 , Reference Favaro-Moreira, Krausch-Hofmann and Matthys 57 ). In fact, depression, impaired function and poor oral intake have been consistently associated with weight loss, low BMI or poor nutrition( Reference Tamura, Bell and Masaki 10 ). Interestingly, loneliness feelings were no longer significant when all studied potential confounders were included in the model. It might be hypothesised that other psychological variables are obscuring the effect of loneliness on malnutrition; however, for this to be ascertained, further investigation in the nursing home setting is required.
In a study conducted in Italian nursing homes, malnourished participants had more severe cognitive impairment, were more depressed and had lower scores in activities of daily living and physical performance (representing worse functional status) in comparison to their well-nourished counterparts( Reference Donini, Poggiogalle and Molfino 28 ), similarly to the present study. However, Italian subjects had a lower prevalence of depression symptomatology as assessed by the GDS (women: 27·3 %, men: 22·2 %) than reported in our study. Among the disorders affecting mental health, depression has been considered the most common cause of involuntary weight loss and malnutrition in older adults( Reference John, Bullock and Brenner 6 ). Lower functional status to perform IADL such as shopping, preparing food and feeding (as measured by the Lawton scale) independently increases the risk of worse nutritional status, as found in the present study. Moreover, there is evidence that older adults who present cumulatively a risk of malnutrition and dependence in activities of daily living show the lowest survival rate( Reference Naseer and Fagerström 58 ).
Inevitably, the present study has limitations that should be kept in mind when interpreting the results. First, except for anthropometric measurements, collected data represent self-reported answers, thus relying on memory or knowledge, participants’ experiences and interpretations, and are eventually subject to some social desirability bias. To minimise this bias, participants were screened for cognitive function (assessed with MMSE) to understand if they could provide reliable answers to the survey, except for MNA® that could be completed using formal caregivers’ help and/or professional judgement (all interviewers were nutritionists). Second, the exclusion criteria had an important contribution to the results regarding nutritional status, because those who were bedridden or who could not understand and/or answer the questionnaires were not enrolled in the study. This methodological decision took account of the sampling effort, the available resources for the estimated sample size and the tools that were chosen. The selected instruments were designed to be administered to the participant her/himself and not to a proxy, as they require very personal answers depending on feelings and emotions. This is especially relevant for depression symptoms and loneliness perception. Third, some anthropometric measurements were not performed in standardised conditions. For example, mainly due to mobility limitations and to ensure participants’ comfort, some of them were not wearing light clothes only. Finally, as in all cross-sectional studies, there are some methodological limitations. For example, we cannot presume causal relationships between nutritional status and depression or IADL.
The current study has several strengths. First is the low refusal rate to participate in the study, both from institutions and residents. Second is its nationally representative nature and the large sample size with no upper age limit. Finally, the use of MNA® full form allowed the assessment of nutritional status, which was then explained by a model including a specific set of sociodemographic, socio-economic and psychosocial variables. This combination of factors has rarely been used to further understand malnutrition in nursing homes.
Our findings reassert that malnutrition, especially risk of malnutrition, is prevalent among nursing home residents in Portugal. This finding is particularly relevant because it was observed among participants who were not bedridden nor with dementia. On the one hand, this may imply an underestimation of malnutrition prevalence; on the other, it singles out a group of individuals with potential for improvement. To better understand the magnitude of this problem, future studies should include those bedridden or with dementia. Increased awareness and objective quantifications of nutritional status may prompt more proactive policies at national and local levels, which will guide effective interventions aimed at reducing malnutrition risk factors such as depression and lower functional status. Such policies should consider all material and human resources required to routinely conduct effective evaluations and interventions in nursing homes.
Acknowledgements
Acknowledgements: The authors acknowledge the Instituto de Segurança Social for providing the list of all Portuguese nursing homes, and staff of Faculdade de Medicina, Universidade de Lisboa for the administrative support and financial management. The authors acknowledge the IAN-AF team for its support with the development of data collection software and critical discussion of the study protocol. The authors also acknowledge the interviewers who collected the data among nursing home residents, the managers and administrations of the participating nursing homes, and all participants. The authors acknowledge Joana Costa for reviewing this manuscript. Financial support: The present project (136SI5) was granted by the Public Health Initiatives Programme (PT06), financed by EEA Grants Financial Mechanism 2009–2014. T.M. is supported by a PhD Scholarship (grant number SFRH/BD/117884/2016) from Fundação para a Ciência e a Tecnologia (FCT) through national funds (MCTES). Funding organisations had no role in the design/conduct of the study, the collection/analysis/interpretation of the data, or the preparation/review/approval of the manuscript. Conflict of interest: None. Authorship: T.M., C.P.-P., O.S., V.A., B.G., N.M., P.J.N. and J.G.C. contributed to the initial study design protocol and to obtain funding. T.M., C.P.-P., N.S.-S., O.S., V.A., B.G., N.M., P.J.N., A.Y., A.By., A.Be., T.F.A. and J.G.C. contributed to the final research protocol. T.M. coordinated the study implementation and wrote the first draft of this manuscript. O.S. was involved in all methodological details of the project. N.S.-S. contributed to the development of data collection software. C.L. participated in the design of tools for data collection. All authors contributed to the further discussion of the manuscript. All authors read and approved the final manuscript. Ethics of human subject participation: This study was conducted according to the guidelines laid down in the Declaration of Helsinki and all procedures involving human subjects were approved by the National Data Protection Committee and the Faculdade de Medicina da Universidade de Lisboa Ethics Committee. Nursing homes’ managers provided formal informed consent and authorisation to participate in the project. Written informed consent was obtained from all subjects. When detecting malnutrition, participants received an informative form about their status, being advised by interviewers (nutritionists) to contact their medical doctors.
Supplementary material
To view supplementary material for this article, please visit https://doi.org/10.1017/S1368980018002318


