


Maternal malnutrition, encompassing both under- and overnutrition, has been identified as one of the main public health challenges of the 21st century, particularly in low- and middle-income countries( 1 ). Low BMI, indicative of maternal undernutrition, has declined somewhat in the past two decades but continues to be prevalent in Asia and Africa. Recently, Black et al. (2013) reported that the prevalence of low BMI in adult women has decreased in Africa and Asia since 1980, but remains higher than 10 % in these two large developing regions; whereas during the same period, the prevalence of overweight and obesity has been rising in all regions( Reference Black, Victora and Walker 2 ). Maternal undernutrition contributes to fetal growth restriction, which increases the risk of neonatal death and, for survivors, of stunting by 2 years of age; whereas maternal overweight and obesity are recognized as global public health problems because they are associated with increased risk of many diseases including hypertension, type 2 diabetes, CVD, stroke, osteoarthritis and some cancers( Reference Darnton-Hill, Nishida and James 3 ). With continuing economic growth many countries in Asia are facing increasing prevalence of overweight/obesity while underweight remains a public health challenge, and this ‘double burden’ has been receiving considerable attention recently( Reference Ly, Ton and Ngo 4 ).
Understanding the nature and determinants of this dual burden of underweight and overweight/obesity is essential in improving the health of populations and in allocating resources appropriately to improve the health of the poorest and most vulnerable groups. Among the existing research on nutritional status of mothers in Bangladesh, most studies have analysed small and non-representative groups( Reference Islam, Akhtaruzzaman and Lamberg-Allardt 5 – Reference Bhuiya and Mostafa 7 ). On the other hand, the present study attempts to: (i) comprehensively examine trends in height, weight and BMI of nationally representative samples of Bangladeshi mothers over the period 1996 to 2007; and (ii) investigate the associations between socio-economic variables and the nutritional status of mothers.
Method
The Bangladesh Demographic and Health Surveys (BDHS) were the source of data. BDHS contained information on 5507, 6217, 6612 and 6031 mothers in the 1996–1997, 1999–2000, 2004 and 2007 surveys, respectively( Reference Mitra, Al-Sabir and Cross 8 – 11 ). The present study focused on nutritional status, so mothers having height, weight and age information were included. Anthropometric measurements of above or below 4 sd from the mean were considered as outliers and excluded from the analysis( Reference Nestel, Mascie-Taylor and Mohamed 12 ). Ultimately a total of 16 278 mothers, whose records were complete in the required individual- and household-level variables, were included in the analysis, of whom 3560 were from 1996–1997 (later mentioned as 1996), 4039 from 1999–2000 (later mentioned as 2000), 4731 from 2004 and 3948 from 2007 BDHS.
Maternal nutritional status variables compared overall mean and sd of height, weight and BMI. Mothers’ BMI (kg/m2) was graded into six groups, i.e. chronic energy deficiency (CED) grade III (<16·00), CED grade II (16·00–16·99), CED grade I (17·00–18·49), normal (18·50–24·99), pre-obese (25·00–29·99) and obese (≥30·00), using the international WHO cut-offs( 13 ). Six further categories of BMI were also used according to international Asian cut-offs, where the CED levels were the same as the WHO cut-offs, but the normal, pre-obese and obese ranges were lowered to 18·50–22·99, 23·00–27·49 and ≥28·50 kg/m2, respectively( 14 ). The socio-economic and demographic information included in the study were education and occupation of the women and their husbands, region (six divisions; Fig. 1), residence (urban/rural), housing condition (type of floor, wall and roof), ownership of radio, television, bicycle, motorcycle and telephone, availability of electricity, water supply, type of latrine and family size. Education level was categorized into four groups as ‘none’, ‘primary’, ‘secondary’ and ‘higher’. Occupation was categorized into six groups as ‘none’, ‘professional’ (professor/teacher/manager), ‘business’ (including sales), ‘skilled manual’, ‘agricultural worker’ and ‘unskilled labour’ (including household/domestic workers). Water supply was categorized as ‘surface water’, ‘tube-well’ or ‘piped water’, and toilet facilities as ‘none’, ‘sanitary toilet’ and ‘unsanitary toilet’. Family size was categorized as 1–4, 5–8 and ≥9 family members. From the available information on type of floor, roof and wall, housing condition was categorized into five types as ‘all thatched’, ‘tin roof’, ‘tin wall and roof’, ‘brick wall or roof or floor’ and ‘all brick’ structure. A new variable called ‘possession score’ was created using information about ownership of a radio, television and bicycle and availability of electricity. All those variables were binary, having ‘yes’ (1) or ‘no’ (0) categories, and adding these gave scores ranging from 0 to 4. The possession variable was then categorized into five categories of 0 to 4, where 0 means the household had no assets and 4 means that family had all four assets. The ‘possession score’ was used because a previous study in Bangladesh indicated that this score provided much greater discrimination of undernutrition than a wealth index generated by the principal component analysis technique( Reference Mohsena, Mascie-Taylor and Goto 15 ).
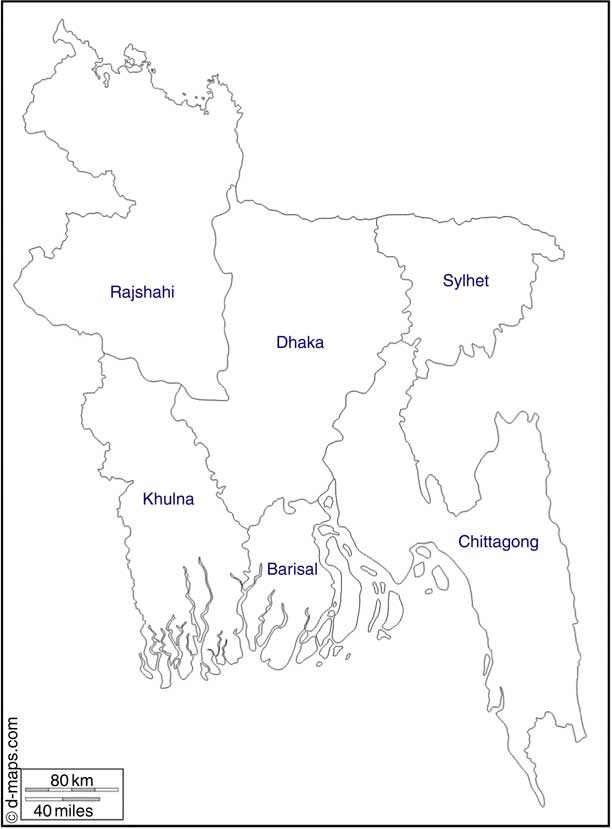
Fig. 1 Map of Bangladesh presenting the six divisions (from http://d-maps.com/carte.php?num_car=47483&lang=en)
All continuous data were checked for skewness using the Cox test (coefficient of skewness divided by the standard error of skewness) as well as examination of the frequency distribution with a normal curve. The relationship between two categorical variables was analysed by the χ 2 test and continuous data by the independent-samples t test. One-way ANOVA was used in comparing the means of three or more groups. Curve estimation was done to include the quadratic effects of the continuous independent variables. The analyses used mainly general linear modelling, sequential linear regression modelling and multinomial logistic regression modelling. For each dependent variable, adjustment was made for linear and quadratic effects of age, period of the BDHS and all other explanatory variables in the model. In every regression model, Durbin–Watson statistics, the variance inflation factor, tolerance and Cook’s distance were calculated to check for the presence of correlation between the independent variables or outliers. Level of significance was taken at P≤0·05. The statistical software package IBM SPSS Statistics version 21 was used for all statistical analyses.
Trends of nutritional status of mothers were observed (i) according to the survey period of the BDHS and (ii) according to the birth cohort of the mothers. Birth cohorts were categorized into seven groups; ≤1960- and >1985-born mothers were two categories and in between they were categorized into 5-year interval periods.
Results
The results of sequential linear regression analyses (data not shown) showed significant associations between all the selected demographic and socio-economic factors and maternal height, weight and BMI. Regional variation was found to be present; all three indicators were found to be worst in the Sylhet division. Mothers from Khulna and Chittagong divisions were on average over 2 kg heavier compared with mothers from Sylhet. Urban–rural discrepancies were also evident; urban mothers were, on average, 3·5 kg heavier and had a BMI 1·5 kg/m2 higher than rural mothers. Possession score showed a very significant positive association and a trend of improvement in height, weight and BMI was observed with increase in the number of possessions in the household; mothers from households owning all four possessions were, on average, nearly 1·5 cm taller, over 7 kg heavier and had nearly 3 kg/m2 greater BMI compared with mothers from households having no possessions. Upward trends in height, weight and BMI were observed with improvement in education level of the mother and her husband as well. Over 2 cm difference in height and 3 kg/m2 difference in BMI were observed among non-educated and higher educated mothers and also among the wives of non-educated and higher educated husbands. Most significantly, mothers with higher education were found to be nearly 10 kg heavier compared with mothers with no education and mothers with educated husbands were, on average, 8 kg heavier than mothers whose husbands had no education. Occupation of the mother and her husband also was significantly associated with nutritional status; mothers were generally taller, heavier and had a higher BMI when they or their husbands were professional workers compared with those mothers or their husbands who performed unskilled jobs. Mothers living in households with a piped water supply and having a sanitary toilet were, on average, taller, heavier and had a higher BMI than those living in households with surface or tube-well water supply and an unsanitary or no toilet. Upward trends of maternal height, weight and BMI means were evident from poor to good housing, measured in terms of thatch, tin or brick roof, floor and walls.
Multinomial logistic regression analyses were undertaken to determine whether it was possible to predict maternal nutritional status based on three levels of maternal BMI (underweight, normal and overweight) using all the socio-economic and demographic variables (Table 1). When WHO cut-off values for maternal BMI (<18·50, 18·50–24·99 and ≥25·00 kg/m2) were used, education level of mothers and their husbands were significant predictors, and there was a downward trend in odds ratios for underweight from no to higher education of mothers or their husbands and a trend in the opposite direction for overweight. A similar relationship was found with possession score; mothers from households owning fewer possessions were more likely to be underweight and less likely to be overweight than those owning more possessions. Urban and rural mothers showed similar likelihood of being underweight but the likelihood of being overweight was higher in urban mothers. A stepwise multinomial logistic regression revealed possession score as the best predictor of maternal nutritional status. Use of the Asian cut-offs (<18·50, 18·50–22·99 and ≥23·00 kg/m2) revealed that after controlling for all the socio-economic and demographic variables, the odds of education of mothers and their husbands and possession score in the households showed similar trends for underweight and overweight as those found using the WHO cut-offs.
Table 1 Multinomial logistic regression analysisFootnote * of maternal BMI (using WHO cut-offs) by demographic and socio-economic variables; Bangladesh Demographic and Health Surveys (1996 to 2007)
Ref., reference category.
* In multinomial logistic regression analysis the baseline category is ‘normal’.
Comparison of the four surveys over the 12-year period showed that there was an overall change in the nutritional status of the mothers from 1996 to 2007; the percentage of CED grade III mothers decreased from 8·57 % to 3·77 %, CED grade II from 13·68 % to 6·51 % and CED grade I from 27·44 % to 21·07 % (Table 2). However, the prevalence of overweight and obesity increased considerably and the overall increase in overweight and obesity was 6 % and 11 % using the WHO and Asian cut-offs, respectively.
Table 2 Distribution of BMI categories of mothers according to survey year; Bangladesh Demographic and Health Surveys (1996 to 2007)
CED, chronic energy deficiency.
Over the four surveys there was a linear increase in mean maternal height, weight and BMI. The increase in mean maternal height was small between 1996 and 2000 but increased substantially thereafter, from 2000 to 2007, and overall there was 0·34 cm increase in mean height over this period (P=0·04). Mean weight, on the other hand, showed an increasing trend throughout with a rise of nearly 1 kg per survey and an overall increase of 3·36 kg over the total period (P<0·001). For BMI, a positive trend was found as well. Comparison of mean height, weight and BMI within socio-economic groups showed that the secular increase, although varying considerably, was evident in all subgroups. Height, although showing a significant overall increase, remained stagnant within each region over the period; whereas weight and BMI increased significantly within each region across the four surveys. The rates of the increase in weight and BMI were somewhat less among mothers from Sylhet (3 kg and 1·14 kg/m2), whereas the rates were highest among mothers from Khulna (4·5 kg and 1·77 kg/m2). The place of residence also mattered and mothers residing in urban areas were, on average, taller (only exception was in 1999–2000), heavier and had higher BMI than those in rural areas. Mothers with higher education tended to have a significantly greater height, weight and BMI that existed throughout the period, 1996 to 2007 (Fig. 2). The difference between mothers with a higher degree and those with no education amounted to about 3 cm for height, more than 9 kg for weight and 3·5 kg/m2 for BMI. Professional mothers, likewise, were found to be taller, heavier and had higher BMI compared with mothers working as unskilled labourers across the four surveys. In the present analysis, the trend of overall improving maternal nutritional status was well marked from lower to higher socio-economic groups and overall mean weight and BMI were greater in the later surveys than in the earliest survey. Furthermore, it was observed that the majority of the mothers having increasing weight and BMI belonged to the lower and middle social strata, as measured in terms of possession score (Fig. 3).
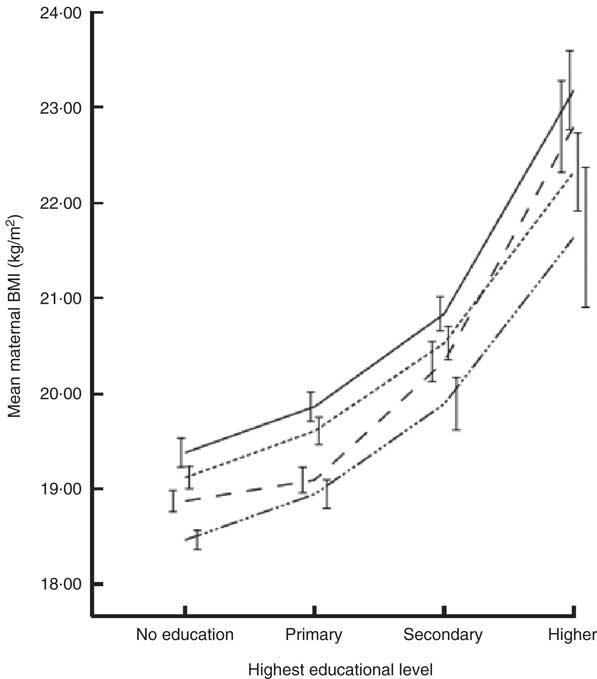
Fig. 2 Trends of maternal BMI in four Bangladesh Demographic and Health Surveys (– · · · –, 1996; – – – – –, 2000; - - - - -, 2004; ———, 2007) with educational level of the mother. Data are presented as mean trends, with sd at each time point indicated by vertical bars
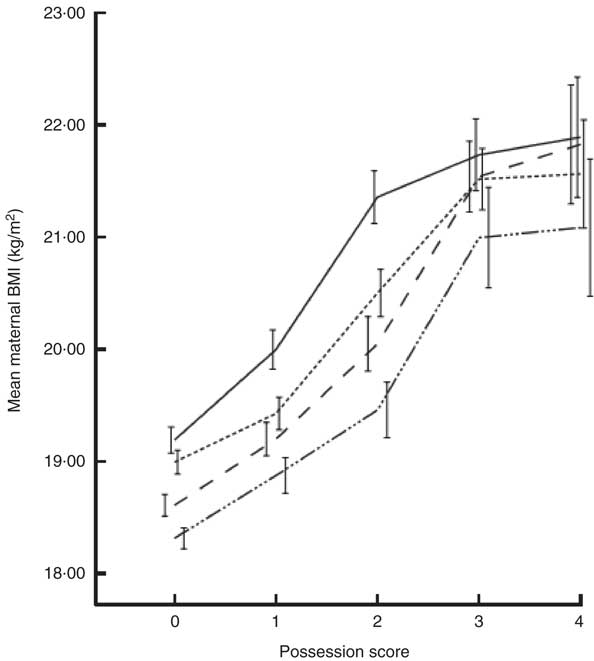
Fig. 3 Trends of maternal BMI in four Bangladesh Demographic and Health Surveys (– · · · –, 1996; – – – – –, 2000; - - - - -, 2004; ———, 2007) with possession score of the household. Data are presented as mean trends, with sd at each time point indicated by vertical bars
The percentage distributions of the different categories of maternal BMI according to their birth cohort are presented in Table 3. The percentage of mothers having normal BMI increased gradually when birth cohort moved from ≤1960 to >1985. Using WHO cut-offs, in the ≤1960 cohort about 40 % of mothers’ BMI were in the normal range, compared with nearly 60 % in the >1985 cohort. Repeating the calculation with Asian BMI cut-offs revealed an increase in the percentage of mothers having normal BMI from 37 % to 54 % in these two cohorts. The percentage of CED grade III showed very significant reduction from 12·4 % to 4·2 % from the oldest to youngest birth cohort and the percentage of CED grade II mothers was almost half in the >1985 cohort compared with the ≤1960 cohort. General linear modelling analysis showed that after controlling for all other socio-economic variables, all cohort groups showed similar mean height. Weight, on the other hand, showed improving trends and mothers born post 1985 were, on average, 6 kg heavier compared with mothers born at or before 1960. Regression analysis (data not shown) revealed that a one-year increment in birth year was associated with 0·32 kg more maternal weight. The mean BMI of the mothers showed an increasing trend; after controlling for age and all the other socio-economic variables, mothers from the 1966–1970, 1976–1980 and >1985 cohorts had on average a 1 kg/m2, 2 kg/m2 and 3 kg/m2 higher BMI, respectively, compared with mothers from the ≤1960 cohort. The odds ratios obtained from multinomial logistic regression analysis (data not shown) revealed that mothers from the post-1985 cohort were 0·22 times less likely to be underweight and 4·14 times more likely to be overweight compared with mothers from the pre-1960 cohort when WHO cut-offs of maternal BMI were used. The analysis was repeated using the Asian cut-offs for maternal BMI; the trends of being underweight and overweight were almost the same (0·25 and 4·15, respectively) as those obtained using the WHO cut-offs.
Table 3 Distribution of BMI categories of mothers according to their birth cohort; Bangladesh Demographic and Health Surveys (1996 to 2007)

CED, chronic energy deficiency.
Discussion
Epidemiological, demographic and nutritional transitions are taking place in many developing countries( Reference Ramesh 16 ). The current paper provides evidence from Bangladesh to document the transition and the double burden of malnutrition by summarizing the trends in height, weight and BMI of mothers over a 12-year period between 1996 and 2007. The findings indicate that although there has been improvement in the nutritional status of mothers in Bangladesh during the 12-year period, the rate of undernutrition among mothers of <5-year-old children is still high, with over 39 % of mothers suffering from CED and close to 6 % with a BMI of less than 16 kg/m2. At the same time, the overweight and obesity rate was 6·1 % and 12·5 %, using the WHO and Asian cut-offs, respectively, providing evidence for the growing double burden of malnutrition.
Bangladesh has witnessed substantial success with respect to achieving Millennium Development Goals, as described in the Lancet Bangladesh series; still, the daunting challenge according to Das and Horton (2013) is the improvement of maternal and child malnutrition and access to primary care( Reference Das and Horton 17 ). By using nationally representative samples of mothers, the present study explored underlying variations in height, weight and BMI of mothers in relation to socio-economic variables and across geographical regions, finding significant associations for all variables. In the literature on nutritional determinants, of particular interest is geographical variation, as regions with poor nutrition tend to pull the overall nutritional status of the country down. As such, reducing the regional gap alone can reduce overall undernutrition significantly especially when regional gaps are high( Reference Bishwakarma 18 ). Bangladesh is a small country; culturally, religiously and linguistically not so diversified; it is therefore perhaps surprising that maternal nutritional status is not evenly distributed throughout the country. Previous research in Bangladesh found that women living in the Sylhet region were more likely to be underweight compared with the reference region of Barisal( Reference Corsi, Kyu and Subramanian 19 ). In the present study, regional heterogeneity in maternal mean BMI and weight was observed with the lowest mean in both these indicators in Sylhet. Sylhet is reported as a poor-performing region in other social indicators correlating with nutrition, as well (e.g. overall and female literacy, mortality, contraceptive prevalence, total fertility rate)( Reference Sayem, Nury and Hossain 20 ). There can be no doubt that special, focused efforts must be made in this part of the country if overall performance in the health, nutrition and population sector is to reach the targets set by the country in the Poverty Reduction Strategy Papers and the Millennium Development Goals. The urban–rural comparison here found that mothers from urban and rural areas had similar likelihood of being underweight but urban mothers were more likely to be overweight, echoing previous findings that an obesity epidemic is emerging among the urban population.
A considerable body of research has suggested education as one of the most important factors in explaining differentials in health outcomes. For example, the profound effects of women’s literacy and schooling in India and Pakistan were discussed by Chatterjee and Lambert (1989); they concluded that both increases in income and improvements in status and power were mechanisms through which education brought about better nutritional status( Reference Chatterjee and Lambert 21 ). Similarly, Gannicott and Avalos (1994) recommended investing in women’s education as one of the efficient ways to attain development goals such as improved health( Reference Gannicott and Avalos 22 ). While addressing maternal nutrition, many studies documented a positive association between educational status and overweight and obesity, whereas evidence from other countries (i.e. Brazil, Mexico, China, Poland, Ghana, South Africa) showed that adults with low educational status were more likely to be overweight, or showed no association between education and overweight/obesity status in urban areas( Reference Tebekaw, Teller and Colon-Ramos 23 ). In Bangladesh, both in urban and rural areas, weight and height of mothers were previously reported to be significantly positively correlated with years of schooling( Reference Bhuiya and Mostafa 7 , Reference Baqui, Arifeen and Amin 24 , Reference Ahmed, Adams and Chowdhury 25 ). In the present study a downward trend in the odds ratio was found for underweight from no to higher educated mothers and a trend in the opposite direction for overweight.
Disparities in health outcomes between the poor and the rich are increasingly attracting attention from researchers and policy makers, thereby fostering a substantial growth in the literature on health equity. Previous studies suggested that there were likely to be positive monotonic relationships between household wealth and child health in most developing countries( Reference Giashuddin, Kabir and Hasan 26 , Reference Gwatkin 27 ); whereas not much was done to assess the relationship between maternal nutritional status and possessions. The present study focused on the possession score as a measure of socio-economic status, and an upward gradient in mean maternal BMI and weight was observed with increase in the number of possessions. In the present study Bangladeshi mothers measured in 2007 were, on average, 0·34 cm taller and 3·36 kg heavier than mothers measured in 1996. Comparison of mean height, weight and BMI within socio-economic groups showed that the secular increase was evident in all subgroups. However, the majority of the mothers having increasing weight and BMI belonged to the lower and middle social strata, measured in terms of possession score. This study finding suggests that the emerging obesity epidemic in Bangladesh is going to hit the urban middle class mostly.
Birth cohort analysis of the change in average height in ten European countries reported that among women, the increase in average height was between 0·32 and 0·44 cm per 5-year increase in birth year in most countries, with 0·61 cm in Finland and 0·83 cm in Germany( Reference Cavelaars, Kunst and Geurts 28 ). Contradicting the European study, maternal height in the present study did not vary significantly between different birth cohort groups in any of the age categories; whereas, at the same age, mothers from younger birth cohorts were, on average, heavier than those from older birth cohorts. Mothers from later surveys showed decreasing likelihood of being underweight and increasing likelihood of being overweight or obese compared with mothers from earlier surveys. Over this study period there was an overall improvement in the nutritional status of the mothers; undernutrition declined by about 18 % but there was a substantial increase in the overweight and obese group of 6 % and 11 % using WHO and Asian cut-offs, respectively, in that period. These results highlight the double burden of both underweight and overweight in Bangladesh and indicate the necessity of implementation of policies addressing problems associated with both under- and overnutrition.
Limitations of the present study include a lack of information on energy, macro- and micronutrient intakes and physical activity, which are important components in estimating nutritional status. The cross-sectional nature of the surveys does not allow causal inferences to be drawn. Information on, for example, child-care practices, food taboos and management of illness was not collected.
In order to determine the most effective strategies for reducing the burden of malnutrition and accelerating development, it is important that the determinants of malnutrition are known. Multilevel analyses after controlling for confounders indicated a strong gradient in undernutrition with household socio-economic status. With robust relationships between possession scores and education of mothers and their nutritional outcomes, the findings suggest that if maternal undernutrition is to be reduced, policies and strategies for poverty alleviation, promotion of education for mothers and provision of basic sanitation facilities are crucial issues. There exists highly significant regional heterogeneity in undernutrition in Bangladesh and the high levels in the Sylhet region are puzzling given the high level of remittances received in that region and the better economic development. Hence, an appropriate policy guideline that focuses on altering nutritional intake among the poor is needed; more focused programmes targeting behavioural changes should be further implemented and evaluated. The trend analyses revealed that socio-economic-based disparities in maternal undernutrition were decreasing; unfortunately that was not because the poor groups were doing better, but because rich groups were showing stagnation. At the same time, it must be noted that the prevalence of overweight and obesity is gradually increasing and it is high time to establish effective preventive measures. For that to happen, understanding and appreciation of the magnitude of the problems and its consequences by health planners and policy makers are urgently required.
The multifaceted nature of malnutrition means that it may be effectively addressed only when several sectors and strategic efforts are combined together. Given the well-documented synergies between several sectors, combining income-generation projects, infant feeding programmes together with better household access to food, more accessible health services, regular deworming of children and improved sanitation, can bring about improvements in nutritional status.
Acknowledgements
Source of funding: The study was supported by grants from the Yousef Jameel Trust (JEMS/GAAB). The funder had no role in the design, analysis or writing of this article. Conflict of interest: None of the authors has any conflicts of interest to declare. Authorship: M.M. reviewed the literature, prepared the data, performed the statistical analysis and wrote the first manuscript draft; R.G. contributed conceptual and statistical advice; C.G.N.M.-T. contributed to the study design, data analysis, interpretation and manuscript preparation. Ethics of human subject participation: Ethical permission was obtained when the Demographic and Health Surveys were carried out. All data in the present study were anonymous and no additional ethical permission was required.


