Paediatric malnutrition is defined as an imbalance between nutritional requirements and intakes, resulting in cumulative energy, protein or micronutrient deficits that may negatively affect growth, development and other relevant outcomes( Reference Mehta, Corkins and Lyman 1 ). The term ‘malnutrition’ covers three broad groups of conditions: undernutrition; micronutrient-related malnutrition; and overweight, obesity and diet-related non-communicable diseases( 2 ).
In children and adolescents, measuring height, weight and BMI are simple ways of assessing nutritional status( Reference Cole, Flegal and Nicholls 3 ). To assess malnutrition, BMI can be used for children aged 61 months to 17 years, whereas weight, height and weight-for-height Z-scores are used for those aged 0–60 months( Reference de Onis, Onyango and Borghi 4 ). The WHO defines thinness as BMI Z-score <−2( Reference de Onis, Onyango and Borghi 4 ). Thinness has recently been adopted as a more appropriate indicator of malnutrition than underweight in older children( Reference Best, Neufingerl and van Geel 5 ). In addition, thinness can be an indicator of acute and/or chronic malnutrition and can serve as a basis for morbidities associated with malnutrition( Reference Cole, Flegal and Nicholls 3 ). Overweight and obesity (OW/OB) among children and adolescents has emerged as one of the most serious public health concerns of the 21st century. The worldwide prevalence of childhood obesity has increased strikingly over the past three decades( Reference Güngör 6 ). The increasing prevalence of childhood obesity has led to the emergence of multiple serious obesity-related co-morbidities( Reference Kumar and Kelly 7 ).
To achieve healthy body structure and development, not only a timely diet and physical activity but also dietary characteristics, composition and quality during the first 1000d of life (from conception until 2 years of age) are critically important( Reference Martorell 8 – 10 ). During the prenatal period, the environment in which the mother lives as well as her activities and diet can cause ‘metabolic programming’ that permanently influences fetal physiology and metabolism( Reference Barker and Osmond 11 ). The mother’s diet has the most important influence on metabolic programming( Reference Kwon and Kim 12 ). Similarly, the dietary process following birth is also effective in shaping metabolic programming. Diet, especially during infancy and early childhood, affects health status in adulthood, in addition to supporting the child’s growth and development( Reference Grantham-McGregor and Cumper 13 , Reference Haas, Murdoch and Rivera 14 ).
The present study aimed to determine the frequency of childhood and adolescent malnutrition (stunting, thinness and OW/OB) and assess their related factors in the province of Çorum, a city in Central Anatolia, Turkey.
Methods
The present study was conducted among children aged between 5 and 17 years who were enrolled in schools in Çorum city centre and surrounding towns. Schoolchildren who were not in this age group were excluded from the study. Considering the different socio-economic characteristics of the city centre and nearby towns, a stratified random sampling method was used for sample selection. In addition, we determined the number of all primary-, secondary- and high-school students, and careful assessment was done to determine the towns based on the weight of strata. Then, the number of samples was determined based on a simple random sampling method. A survey was administered querying children’s delivery mode, birth weight, duration of predominant breast-feeding, complementary feeding time, duration of breast-feeding, mothers’ age and maternal education level. Children with birth weight <2500g were classified as low birth weight (LBW), those between 2500 and 4000g were classified as normal birth weight (NBW) and those ≥4000g were classified as high birth weight (HBW). Children diagnosed with chronic diseases were excluded from the study. The study was approved by the Hitit University Clinical Research Ethical Board (approval number 2017–83). Signed voluntary consent forms were obtained from the parents of study participants.
Children’s height and weight were measured to calculate their BMI and BMI Z-scores. Weight was measured using a portable electronic scale with 0·1g precision, with heavy clothing, such as coats and shoes, removed. Height was measured using a portable stadiometer with 0·1cm precision, with shoes removed and participants standing with feet adjacent and in an upright position. Height, weight and BMI Z-scores were calculated using WHO AnthroPlus software version 1.0.4( 15 ). Nutritional conditions were classified according to the WHO( Reference de Onis, Onyango and Borghi 4 ).
Statistical analysis
The statistical software package IBM SPSS Statistics version 22.0 was used for all data analyses. Descriptive statistics are presented as number and percentage for qualitative variables, and as mean and standard deviation or as median and range for quantitative variables. The normal distribution of data was evaluated using Kolmogorov–Smirnov and Shapiro–Wilk tests to guide choice of statistical test. Homogeneity of variances was investigated using Levene’s test. Relationships between continuous variables were examined using Spearman’s correlation coefficient. When interpreting the association based on Spearman’s correlation coefficients, reference ranges were adopted as follows: 0·00 <r <0·25, very weak; 0·26 <r <0·49, weak; 0·50 <r <0·69, moderate; 0·70 <r <0·89, high; and 0·90 <r <1·00, very high. When comparing the mean values between two independent groups, the Student t test was used for data with normal distribution and the non-parametric Mann–Whitney U test was used for data with a non-normal distribution. When comparing more than two groups, the non-parametric Kruskal–Wallis test was used because of the unavailability of hypotheses. Following the variance analysis, a post hoc pairwise comparison test was used to determine differences among the groups.
The association between height and BMI Z-scores and birth weight and breast-feeding duration was analysed using multiple linear regression. Risk factors influencing height and BMI category were determined using binary logistic regression analysis. To determine the ability of birth weight and breast-feeding duration to predict height (maximum sensitivity and specificity), the receiver-operating characteristic curve analysis method was used. Receiver-operating characteristic curves were drawn and the area under the curve and 95% confidence interval of this area were calculated. During the analyses, the significance of variables in determining at-risk groups was area under the curve >0·500 (0·9–1·0, perfect; 0·8–0·9, good; 0·7–0·8, moderate; 0·6–0·7, weak; 0·5–0·6, ineffective). To classify the success, sensitivity and specificity of data, positive predictive value, negative predictive value and positive likelihood values were calculated. The Youden index was used to determine the best cut-off point in the receiver-operating characteristic curve analysis. A total of fourteen students who had missing data for height, weight or date of birth were excluded in the statistical analyses. A P value <0·05 was considered statistically significant.
Results
A total of 1684 children were included in the study, consisting of 882 (52·4%) girls, with mean age of 11·7 (sd 3·3) years (range 5–17 years). Among the participants, 547 (32·5%) were students in primary school, 583 (34·6%) in secondary school and 554 (32·9%) in high school. A total of 1057 (63·0%) children were born via normal vaginal delivery. The median breast-feeding duration was 15 months (range 0–72 months; Table 1). Girls and boys did not differ significantly with respect to height and BMI Z-scores (P=0·436 and P=0·517, respectively). Girls’ median height and BMI Z-scores were 0·01 (range −5·0 to 4·5) and −0·23 (range −5·5 to 3·9), respectively. Boys’ median height and BMI Z-scores were 0·12 (range −5·0 to 3·5) and −0·22 (range −4·5 to 3·5), respectively.
Table 1 Sociodemographic characteristics of the school children aged 5–17 years (n 1684) from Çorum, Central Anatolia, Turkey, January–May 2017
After evaluating the children’s nutritional status, we found that 4·2% of them were stunted, 6·9% were thin, 13·8% were overweight and 6·6% were obese; 65·7% had normal height and weight, and 3·2% were tall with normal weight (Table 2).
Table 2 Comparison of height and weight status according to nutritional status and age among the schoolchildren aged 5–17 years (n 1684) from Çorum, Central Anatolia, Turkey, January–May 2017
OW/OB, overweight and obesity.
* A total of fourteen students who had missing height, weight or date of birth data were excluded from the statistical analyses.
The median height Z-score of 0·23 (range −3·4 to 3·5) in children aged ≤10 years was significantly higher than in those aged >10 years: −0·09 (range −5·0 to 4·5; P <0·001). After evaluating the distribution of stunting among children by age, a statistically significant difference was observed: 78·6% of participants were aged >10 years and 21·4% were aged ≤10 years (P <0·001; Table 3). Children’s height Z-score and age were weakly negatively correlated (r=−0·160, P <0·001; Fig. 1).
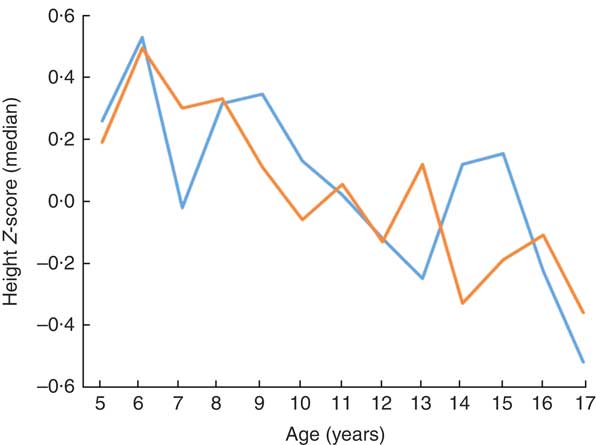
Fig. 1 (colour online) Height Z-score according to age and gender (![]() , girls;
, girls;
![]() , boys) among the schoolchildren aged 5–17 years (n 1684) from Çorum, Central Anatolia, Turkey, January–May 2017
, boys) among the schoolchildren aged 5–17 years (n 1684) from Çorum, Central Anatolia, Turkey, January–May 2017
Table 3 Comparison of nutritional status according gender and age among the schoolchildren aged 5–17 years (n 1684) from Çorum, Central Anatolia, Turkey, January–May 2017
OW/OB, overweight and obesity.
The frequency of thinness in children aged >10 years (8·6%) was higher than that in children aged ≤10 years (4·4%; P <0·001). After examining the distribution of thinness among children by age, 75·0% were aged >10 years and 25·0% were aged ≤10 years (P <0·001; Tables 2 and 3). The OW/OB frequency in children aged >10 years (22·0%) was higher than that in children aged ≤10 years (17·9%; P <0·001). When examining the distribution of OW/OB among children by age, 64·9% were aged >10 years and 35·1% were aged ≤10 years (P <0·001; Table 3).
When factors associated with children’s height and BMI Z-score were analysed, birth weight and breast-feeding duration were weakly correlated with height and BMI Z-scores (r=0·236, P <0·001 and r=0·168, P <0·001 for birth weight; and r=0·122, P <0·001 and r=0·83, P=0·001 for breast-feeding duration, respectively). When assessing the linear regression analysis, children’s height and BMI Z-scores were found to increase by +0·0421 and +0·032, respectively, for each 100-g increase in birth weight. Height and BMI Z-scores were also found to increase by +0·0129 and +0·012, respectively, for each 1-month increase in breast-feeding duration (Figs 2 and 3).
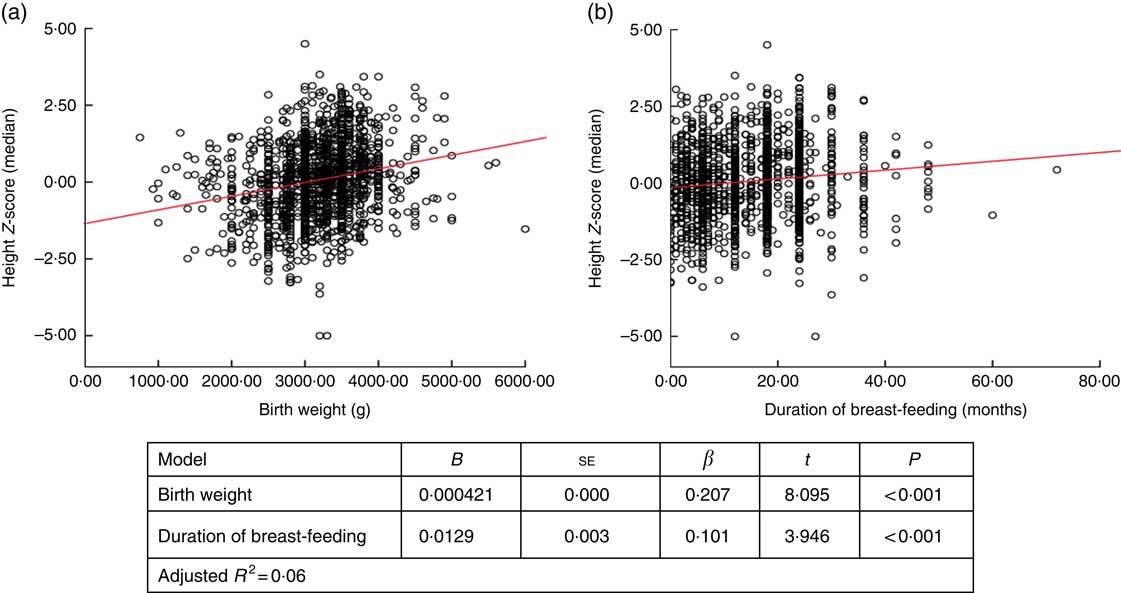
Fig. 2 (colour online) Correlation scatter graph (
![]() , observation;
, observation;
![]() , linear regression line) between (a) height Z-score and birth weight and (b) height Z-score and duration of breast-feeding among the schoolchildren aged 5–17 years (n 1684) from Çorum, Central Anatolia, Turkey, January–May 2017
, linear regression line) between (a) height Z-score and birth weight and (b) height Z-score and duration of breast-feeding among the schoolchildren aged 5–17 years (n 1684) from Çorum, Central Anatolia, Turkey, January–May 2017
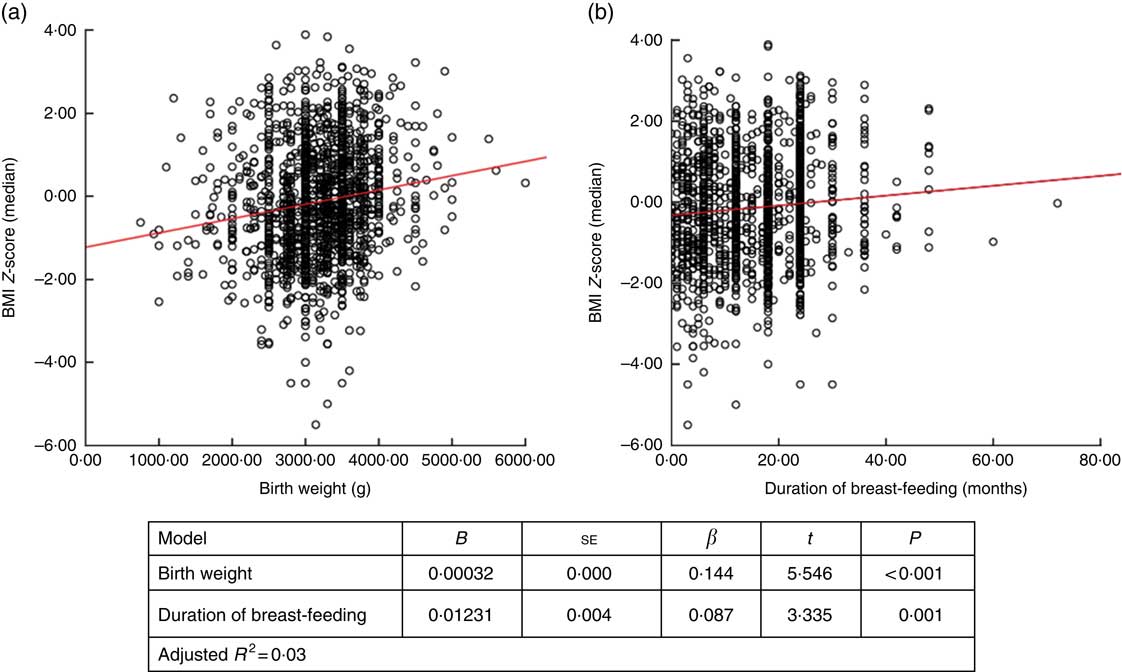
Fig. 3 (colour online) Correlation scatter graph (
![]() , observation;
, observation;
![]() , linear regression line) between (a) BMI Z-score and birth weight and (b) BMI Z-score and duration of breast-feeding among the schoolchildren aged 5–17 years (n 1684) from Çorum, Central Anatolia, Turkey, January–May 2017
, linear regression line) between (a) BMI Z-score and birth weight and (b) BMI Z-score and duration of breast-feeding among the schoolchildren aged 5–17 years (n 1684) from Çorum, Central Anatolia, Turkey, January–May 2017
Birth weight in children with stunting, median 2750 (range 1400–3600)g, was found to be significantly lower than in normal-height and tall children: 3200 (750–5500)g (P <0·001) and 3500 (2500–4900)g (P <0·001), respectively. Birth weight of thin children, median 3000 (range 1000–4500)g, was significantly lower than those of normal-weight and OW/OB children: 3200 (750–5500)g (P=0·026) and 3300 (1200–5500)g (P <0·001), respectively (Table 4).
Table 4 Factors associated with nutritional status of the schoolchildren aged 5–17 years (n 1684) from Çorum, Central Anatolia, Turkey, January–May 2017
OW/OB, overweight and obesity.
Breast-feeding duration in children with stunting, median 10 (range 0–36) months, was significantly shorter than in normal-height and tall children: 15 (0–72) months (P=0·011) and 18 (0–36) months (P=0·016), respectively. In thin children, median breast-feeding duration of 12 (range 0–36) months was found to be significantly shorter than in children with normal weight and OW/OB: 15 (0–72) months (P=0·045) and 16 (0–48) months (P=0·011), respectively (Table 4).
LBW children had significantly higher risk of stunting than NBW children (OR=3·855; 95%CI 2·236, 6·646). Children who were breast-fed for ≤12 months had significantly higher risk of stunting than those breast-fed for >12 months (OR=2·343; 95% CI 1·332, 4·120). HBW children were at significantly higher risk of being OW/OB than NBW children (OR=1·730; 95% CI 1·123, 2·667). The risk of being thin was found to be significantly higher in children who were breast-fed for ≤12 months than in those breast-fed for >12 months (OR=1·583; 95% CI 1·042, 2·405; Table 5).
Table 5 Binary logistic regression analysis results to predict stunting, overweight/obesity and thinness, respectively, according to control group with birth weight and breast-feeding time as independent variables, among the schoolchildren aged 5–17 years (n 1684) from Çorum, Central Anatolia, Turkey, January–May 2017
LBW, low birth weight; NBW, normal birth weight; HBW, high birth weight; OW/OB, overweight and obesity.
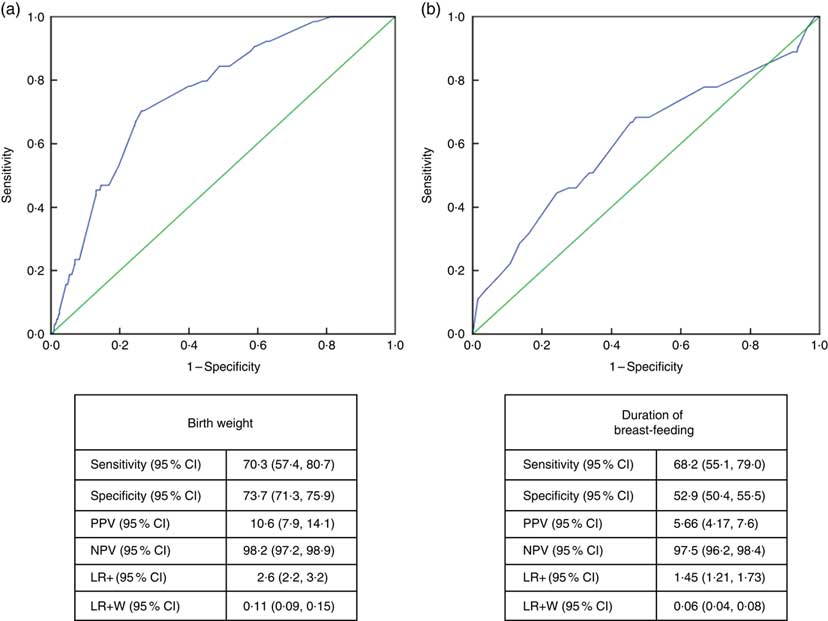
Receiver-operating characteristic curve analysis showed that the cut-off value between stunting and normal height and tallness was 2915g (area under the curve=0·759 (95% CI 0·706, 0·813), P <0·001) for birth weight and 14·5 months (area under the curve=0·611 (95% CI 0·532, 0·690), P <0·003) for breast-feeding duration (Fig. 4).
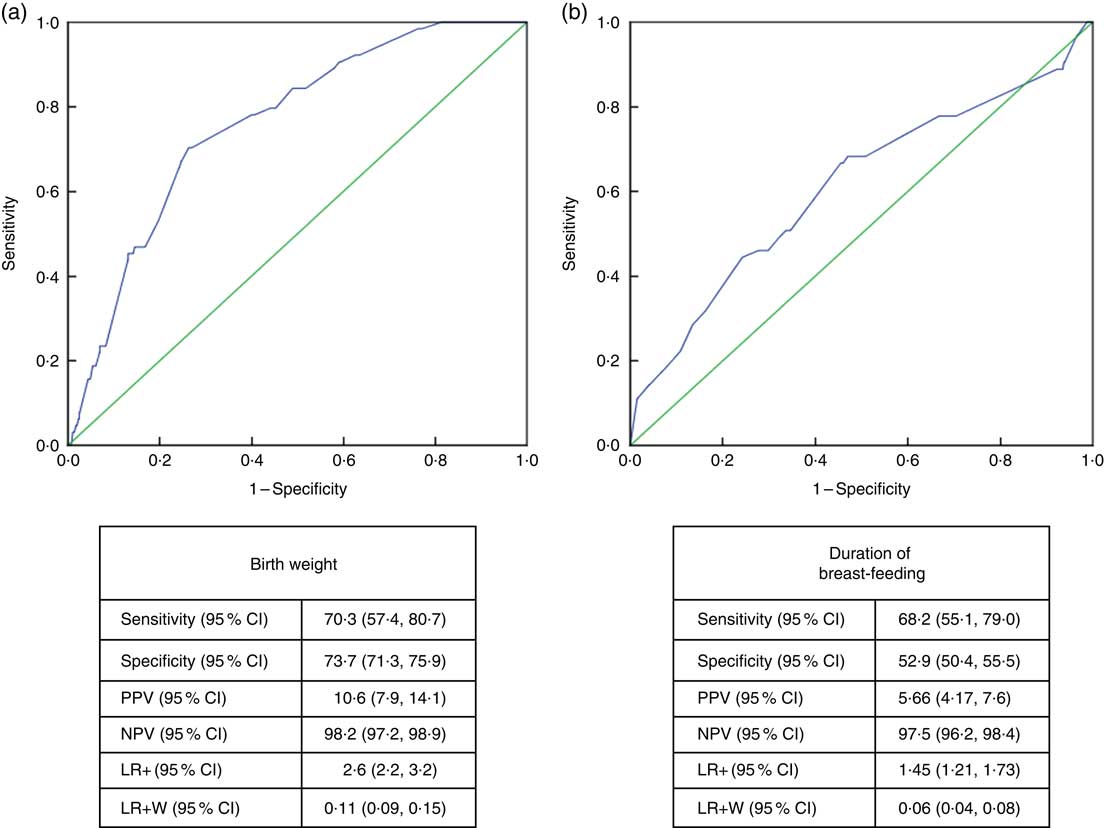
Fig. 4 (colour online) Receiver-operating characteristic curve analysis (
![]() , data;
, data;
![]() , line of no discrimination) for estimation of height Z-score group according to (a) birth weight and (b) duration of breast-feeding among the schoolchildren aged 5–17 years (n 1684) from Çorum, Central Anatolia, Turkey, January–May 2017. (a) AUC=0·759 (95% CI 0·706, 0·813), P<0·001; (b) AUC=0·611 (95% CI 0·532, 0·690), P<0·003 (AUC, area under the curve; PPV, positive predictive value; NPV, negative predictive value; LR+, likelihood ratio; LR+W, likelihood ratio weighted)
, line of no discrimination) for estimation of height Z-score group according to (a) birth weight and (b) duration of breast-feeding among the schoolchildren aged 5–17 years (n 1684) from Çorum, Central Anatolia, Turkey, January–May 2017. (a) AUC=0·759 (95% CI 0·706, 0·813), P<0·001; (b) AUC=0·611 (95% CI 0·532, 0·690), P<0·003 (AUC, area under the curve; PPV, positive predictive value; NPV, negative predictive value; LR+, likelihood ratio; LR+W, likelihood ratio weighted)
Discussion
Growth parameters of height and weight are primarily determined by genetic characteristics. However, these parameters are also largely affected by environmental factors, especially nutrition( Reference Grantham-McGregor and Cumper 13 , Reference Ozgüven, Ersoy and Ozgüven 16 ). Nutritional disorders are also known as malnutrition, which covers undernutrition, overnutrition and micronutrient deficiencies in children( 2 ). Weight is primarily affected during periods of acute undernutrition, which is shorter than 3 months, whereas chronic undernutrition, which lasts longer than 3 months, typically manifests as stunting because of especially reduced height velocity( Reference Mehta, Corkins and Lyman 1 ). Undernutrition in schoolchildren seriously impacts their health, cognition and subsequent educational achievement. Poor health and inadequate nutrition among schoolchildren likely prevent adequate cognitive development, either through physiological changes or by reducing their ability to participate in learning experiences, or both( Reference Best, Neufingerl and van Geel 5 , Reference Zhang, Bécares and Chandola 17 ). There is growing evidence that improving the nutrition of schoolchildren can have a measurable positive impact on cognition, linear growth and other health outcomes( Reference Zenebe, Gebremedhin and Henry 18 ).
In Turkey, both over- and undernutrition of school-aged children are public health problems( Reference Etiler, Cizmecioglu and Hatun 19 ). Undernutrition has decreased over the past two decades; however, the frequency of OW/OB has increased by 11·6-fold in the past two decades( 20 – Reference Alper, Ercan and Uncu 22 ). A national study conducted among children aged 6–18 years in the country found that the stunting frequency was 7·7%. This percentage varied between 2·2 and 13·0% in different regions. In addition, the thinness frequency was found to be 3·8%, varying between 1·3 and 6·2% across regions( 23 ). Similar to these studies, we also found a frequency of stunting of 4·2% and frequency of thinness of 6·9%.
Rapid changes in technology have greatly affected the way of life in many countries. Electronic devices and digital games have replaced outdoor games. Use of motorized devices and cell phones has reduced walking distances and increased sedentary lifestyles. Nutritional habits have shifted from the consumption of traditional foods to more fast foods, which are characterized by high fat, high cholesterol, high Na and low fibre contents. All these factors have played major roles in increasing the prevalence of obesity( Reference Sağlam and Tarım 24 , Reference Dündar and Öz 25 ). As in any transitional society, rapid changes have occurred in the social, economic, nutritional and lifestyle aspects of Turkish society over the past three decades. As a result, the prevalence of OW/OB has increased dramatically among the Turkish population( Reference Bereket and Atay 26 ). In a meta-analysis conducted by Alper et al.( Reference Alper, Ercan and Uncu 22 ) in Turkey in 2015, the prevalence of obesity increased from 0·6% in 1990–1995 to as high as 7·3% in 2010–2015, an 11·6-fold increase. Regional studies conducted in the past decade have found the incidence of overweight and obesity is 10·3–13·6% and 6·1%–9·9%, respectively( Reference Simsek, Akpinar and Bahcebasi 27 , Reference Koca, Akcam and Serdaroglu 28 ). A multicentre study performed across Turkey reported incidences of 14·3 and 8·2% for overweight and obesity, respectively( 23 ). Our results were consistent with these percentages, namely 13·8% for overweight and 6·6% for obesity.
In our study, the frequencies of stunting (5·5%), thinness (8·7%) and OW/OB (21·9%) among adolescents were significantly higher than those among primary-school children (2·3, 4·4 and 17·9%, respectively). After the first year and early years of life, adolescence is the second most critical period in which physical growth continues. In this period, various physiological, psychological and behavioural changes occur, and the risk of malnutrition is extremely high because of increased food and energy requirements( Reference Manyanga, El-Sayed and Doku 29 , Reference Das, Salam and Thornburg 30 ). Adolescents’ nutritional and health status affects their overall health in terms of stunting but is also closely associated with adult health and chronic diseases and fetal complications during pregnancy, because undernutrition and obesity are largely maintained during adulthood, which carries associated complications( Reference Das, Salam and Thornburg 30 , Reference Lassi, Moin and Das 31 ).
In transitional countries, a significant disparity among children’s nutritional outcomes exists between urban and rural societies( Reference Cai 32 ). In the rural societies, most individuals consume traditional foods whereas urban residents with moderate to high socio-economic status consume foods that are energy-dense but have poor nutritional content( Reference Cai 32 , Reference Tzioumis and Adair 33 ). Undernutrition exists alongside increasing obesity due to the coexistence of traditional and convenience foods. Coexistence of under- and overnutrition, a phenomenon known as the ‘double burden’, poses a novel public health challenge( Reference Abdullah 34 ) and causes health-care problems associated with malnutrition and obesity, which are more commonly observed in adolescents( Reference Zhang, Lin and Sun 35 ).
A great number of studies have shown that in addition to future health problems and chronic diseases, diet in the first 1000d has significant effects on body size/shaping and being OW/OB among children, adolescents and adults( Reference Martorell 8 , Reference Robinson and Fall 9 , Reference Qiao, Ma and Wang 36 , Reference Lausten-Thomsen, Bille and Nässlund 37 ).
In a cohort study, Eide et al.( Reference Eide, Øyen and Skjaerven 38 ) reported that both birth weight and height were predictors of adult height and weight and that each had independent contributions. In a study conducted in Brazil in 2012, birth weight was shown to be positively correlated with height in adolescents( Reference Wells, Dumith and Ekelund 39 ). In a meta-analysis that included five cohort studies conducted in five low- and middle-income countries, Kuzawa et al.( Reference Kuzawa, Hallal and Adair 40 ) concluded that birth weight is a strong predictor of adult fat-free mass, independent of sex and geographic location.
In a meta-analysis by Adair et al.( Reference Adair, Fall and Osmond 41 ) including five prospective studies and 8362 adults, HBW was found to be associated with increased BMI and substantial gain in height. In a study conducted among 5141 children between the ages of 9 and 11 years in twelve countries, Qiao et al.( Reference Qiao, Ma and Wang 36 ) found a positive association between children’s birth weight and BMI Z-score. In another meta-analysis, Yu et al.( Reference Yu, Han and Zhu 42 ) showed that HBW was a risk factor for obesity. Concurrently, children’s birth weight was found to be positively and linearly associated with height and BMI Z-scores. In our study, significant differences were found in birth weight for stunted, normal-height and tall children. LBW children’s risk of stunting was found to be 3·855 (95% CI 2·236, 6·646) times higher than that of NBW children.
In studies conducted among both children and adolescents, LBW and undernutrition were positively associated( Reference Djalalinia, Qorbani and Heshmat 43 , Reference Jahanihashemi, Noroozi and Zavoshy 44 ). Similarly, thin children’s birth weights were found to be significantly low in our study.
Epidemiological studies suggest that individuals who were breast-fed are taller in childhood and adulthood( Reference Martin, Holly and Smith 45 ). In previous studies, results regarding the effects of breast-feeding duration on adult height have differed: some findings have shown a positive effect but others have suggested no effect at all( Reference Djalalinia, Qorbani and Heshmat 43 , Reference Martin, Holly and Smith 45 – Reference Martin, Smith and Mangtani 47 ). In our study, children’s breast-feeding duration and height Z-score were significantly and positively associated. Breast-feeding for longer than 12 months protected the children from stunting.
While some meta-analyses have reported that breast milk has a significant protective effect against obesity, others have indicated a small protective effect and still others have reported no clear findings( Reference Lefebvre and John 48 – Reference Yan, Liu and Zhu 50 ). In a systematic review by the WHO in 2013, a long period of breast-feeding decreased the frequency of being OW/OB at a rate of 10%; however, it was also concluded that influencing factors, such as the mother’s educational and income levels, cannot be reset( Reference Horta and Victora 51 ). In the current study, duration of breast-feeding was not found to have a protective effect against obesity but did show a significant protective effect against thinness.
The present study has several limitations. The current heights of children, and not final heights, were assessed and other malnutrition indicators, such as mid-upper arm circumference, subcutaneous fat tissue thickness and fat-free mass, were not assessed. Information about children’s birth weight and early feeding practices was obtained from the mothers. However, difficulty in recalling or inability to recall this information may have existed. Influencing factors, such as the family’s socio-economic status or paternal factors, may have also affected the statistical results.
Conclusion
In conclusion, OW/OB was found in one of every five and undernutrition was found in one of every ten children in the current study. In addition, double malnutrition was found among adolescents. Normal birth weight and prolonged breast-feeding duration were found to significantly positively affect the growth of schoolchildren aged 5–17 years in Turkey.
Our study revealed evidence to support that OW/OB is a primary health problem and must be addressed in schoolchildren. Preventing LBW, promoting NBW and encouraging prolonged breast-feeding are important factors that foster normal growth in children. In addition, education and training on nutrition, especially among adolescents, should be conducted to help maintain a healthy body structure among adults.
Acknowledgements
Acknowledgements: The authors thank Hitit University Rectorship and the Çorum Provincial Directorate of National Education for supporting this project at every step and their cooperation. They also thank Şahin Özcan, Hayati Özdemir and İsmail Serdar Yakar from the Provincial Directorate of National Education Research and Development Unit for their active participation and great efforts. Financial support: This research received no specific grant from any funding agency in the public, commercial or not-for-profit sectors. Conflict of interest: No conflict of interest was declared by the authors. Authorship: A.C., E.D. and N.B.E. conceptualized and designed the study, drafted the initial manuscript, designed the data collection instruments, collected data, carried out the initial analyses, and reviewed and revised the manuscript. All authors approved the final manuscript as submitted and agree to be accountable for all aspects of the work. Ethics of human subject participation: This study was conducted according to the guidelines laid down in the Declaration of Helsinki and all procedures involving human subjects were approved by Hitit University’s Clinical Research Ethical Board (approval number 2017–83). Written informed consent was obtained from parents of all study participants.