


A growing body of epidemiological and short-term metabolic studies indicate that protein intake above the dietary reference intake (DRI) benefits muscle mass, strength and function among older adults(Reference Wolfe1). Furthermore, older persons with a lower protein intake are at increased risk of having mobility limitations(Reference Houston, Tooze and Garcia2), a worse disability trajectory(Reference Mendonça, Granic and Hill3) and of developing persistent protein-energy malnutrition (PEM)(Reference Hengeveld, Wijnhoven and Olthof4).
The DRI of protein for healthy older adults is 0·8 g/kg BW/d(5). National food consumption data indicate that the mean protein intake of Dutch community-dwelling older adults is equal or above the DRI, but variability is large. About 20 % of the community-dwelling older adults have an intake lower than the DRI(Reference Ocké, Buurma-Rethans and de Boer6), and the prevalence of PEM in older adults varies from 7 % in home-living older adults to 33 % in hospitalised patients(7–Reference Schilp, Kruizenga and Wijnhoven9).
There are indications that the timing of protein intake is important for total intake, but evidence is limited so far. In young adults, de Castro(Reference de Castro10) has found that eating a large proportion of protein in the morning is associated with a lower total protein intake. Studies in older adults are limited and show similar results(Reference Mendonça, Granic and Mathers11). Other previous studies often looked into meal occasions, while the exact time of the day of these meals was not incorporated. Additionally, any eating occasions reported outside the main meals were omitted or clustered into one category. Furthermore, they only investigated the proportion of protein eaten at different hours of the day and not the absolute amount of protein ingested (in grams)(Reference Paddon-Jones, Campbell and Jacques12–Reference Kim, Schutzler and Schrader18).
It is important to look in more depth into the timing of protein intake, as to investigate whether it may inform optimal strategies for dietary interventions. Therefore, the present study aimed to describe the protein intake pattern of Dutch community-dwelling older adults and to evaluate whether total protein intake and the risk of low protein intake depend on the protein intake pattern over the day. Additionally, we investigated whether the pattern of protein intake over the day is related to possible determinants of PEM, that is, poor appetite, involuntary weight loss and a positive screening for PEM.
Methods
Study population
Data from the Dutch National Food Consumption Survey–Older Adults 2010–12 (DNFCS–Older Adults) were used. The rationale and methodology of this survey are described in detail elsewhere(Reference Ocké, Buurma-Rethans and de Boer6). In short, of 2848 invited eligible men and women aged ≥70 years, 739 (26 %) participated in the study. Institutionalised older adults and those who were tube-fed or parenterally fed were not eligible. Additional exclusion criteria were having a high-intensity care package or being terminally ill. For practical reasons, older adults with impaired cognitive abilities and those with an inadequate command of the Dutch language were also excluded.
Assessment of dietary intake
Dietary intake was assessed by means of two non-consecutive, dietary record-assisted 24-h recalls using a multiple pass approach. Subjects were interviewed at home by trained dieticians twice, with a mean interval of 4 weeks. Because impaired short-term memory is common in old age, subjects were asked to fill in a food diary on the day before the interview(Reference de Vries, de Groot and van Staveren19). The completed diary was used as a memory aid during the 24-h recall the next day. The diary and 24-h recall covered the period from waking-up on the recall day until waking-up on the next day. Dieticians used a computer-controlled interview software (EPIC-Soft, IARC©)(Reference Slimani, Deharveng and Charrondiere20–Reference Slimani and Valsta22) to directly enter the answers in the computer. Seven food consumption occasions were asked for, and information on all foods and drinks ingested were entered at one of the following: (i) before breakfast, (ii) breakfast, (iii) during morning, (iv) lunch, (v) during afternoon, (vi) dinner, (vii) during evening. For each occasion where food or drink was ingested, also the time (per full hour) of consumption was reported with ’07.00 hours’ indicating that the occasion started between 06.30 and 07.29 hours. Recalls were equally spread over all days of the week and the four seasons(Reference Ocké, Buurma-Rethans and de Boer6). Both the subjects and the dieticians were unaware that the time of day of intake was being studied.
The consumed foods and drinks were converted into energy and nutrient intake using an extended version of the Dutch Food Composition Database (NEVO table 2011)(23). Energy intake was expressed as kilojoules per day (kJ/d). Protein intake was expressed as grams per day (g/d), percentage of daily energy intake (En%), and as grams per kilogram adjusted BW per day (g/kg aBW/d) as suggested by Berner et al. (Reference Berner, Becker and Wise24). This was done to adjust for excessive BW (which comprises mostly of fat mass contributing little to the body protein turnover) among obese people as well as for insufficient protein availability to maintain muscle mass among underweight people. Using aBW may, therefore, be more sensible to detect the population at risk of low protein intake. aBW is the nearest BW that would place a participant with an undesirable BW in the healthy BMI range of 18·5–24·9 kg/m2 for adults aged ≤70 years, and of 22·0–27·0 kg/m2 for adults aged ≥71 years(Reference Berner, Becker and Wise24). In total, 392 BW adjustments were made. If only measured BW was available and not body height (and BMI could, thus, not be calculated), actual weight was used (n 18). For twelve subjects, BW was missing, and therewith protein intake expressed as g/kg aBW/d. Recall days with a protein intake ≥0·8 g/kg aBW were labelled as days with a high protein intake, while those with intake <0·8 g/kg aBW were labelled as days with a low protein intake. The contribution of animal and vegetable protein and that of the three main food groups contributing to daily protein intake in Dutch older adults (‘meat, meat products and poultry’, ‘dairy products’ and ‘cereals and cereal products’(Reference Ocké, Buurma-Rethans and de Boer6)) were also calculated.
Protein intake pattern over the day
We calculated the absolute amount of protein ingested for each hour of the day. Any occasion where food or drink was ingested was included. This provides, however, little information on the distribution of total protein intake over the day. Therefore, we also calculated the proportion of protein ingested during every hour of the day by dividing the amount of protein ingested at each hour of the day by total protein intake of that day.
Screening for risk of undernutrition
Subjects were screened for (risk of) undernutrition during the first home visit with the Short Nutritional Assessment Questionnaire for 65+ (SNAQ65+)(Reference Wijnhoven, Schilp and van Bokhorst-de van der Schueren25). Short Nutritional Assessment Questionnaire for 65+ includes questions on appetite, unintentional weight loss and functional limitation. Appetite was assessed by asking whether a person experienced poor appetite in the past week (yes/no). Unintentional weight loss was assessed by asking whether a person unintentionally lost ≥4 kg within the past 6 months (yes/no). Functional limitation was assessed by asking whether a person could climb up and down a staircase of fifteen steps without stopping (yes/no). In addition, left mid-upper arm circumference was measured at the midpoint between the tip of the shoulder and the tip of the elbow. The following three groups were defined: (1) undernutrition (mid-upper arm circumference <25 cm or unintentional weight loss ≥4 kg in 6 months), (2) risk of undernutrition (poor appetite in the preceding week and difficulties climbing stairs) and (3) no undernutrition (others).
Potential confounding variables
Information on age, sex, education, income, physical activity, type of housing and household composition was collected through an interviewer-administered general questionnaire during the first home visit. For the analyses, four categories of education were distinguished: primary education, lower vocational or advanced elementary education, intermediate vocational or higher secondary education, and higher vocational education or university. Income was categorised into low income (old age pension only) or middle/high income (old age pension with supplementary pension). Physical activity was based on responses to the Short QUestionnaire to ASsess Health enhancing physical activity (SQUASH)(Reference Wendel-Vos, Schuit and Saris26). The activity level of subjects was classified based on the average number of days per week with at least 30 min of moderately intense physical activity. Distinguished categories were inactive (0 d), semi-active (0·5–4·5 d) or norm-active (≥5·0 d). Type of housing was aggregated into two categories: living fully independent (single-family dwelling, detached house, apartment, farm, flat) or living in a home especially intended for older adults (service flat, elderly commune, flat for elderly/pensioners/old people or living self-reliantly near a rest home). For the composition of the household, living alone was distinguished from living with partner, spouse or other person(s). Body height and weight were measured during one of the two home visits by trained dieticians, and BMI was calculated as weight in kilograms per height-squared in m2. Wake-up time was obtained by asking at what hour the subject woke up on the morning of each recall day.
Statistical analysis
Participant characteristics were expressed as frequency and percentage for categorical data, and mean and standard deviation for continuous data. In the remainder of the analyses, recall days were used as the unit of observation.
Repeated-measures ANOVA was used to compare protein intake between hours of the day and between days with high and low protein intake. Hours that contributed <1 % to total protein intake over all recall days were excluded. As time of wake-up may affect the timing of protein intake, analyses were repeated while adjusting for wake-up time. In addition, the timing of protein intake was examined using time since wake-up. For these analyses, hours were defined as the number of hours being awake, with ’00.00 hours’ indicating that the occasion where food or drink was ingested started 0–59 min after the time of wake-up.
As a secondary analysis, differences in the timing of protein intake according to self-reported unintentional weight loss (≥4 kg in the past 6 months) were assessed using linear mixed models. A similar analysis was performed according to being screened as undernourished. To examine whether the timing of protein intake varied according to appetite, linear regression was used, using only the first 24-h recall. This was done because the question on poor appetite in the preceding week was solely asked during the first home visit.
To examine the association between the timing of protein intake and total protein intake, regression coefficients were calculated between the amount of protein ingested during every hour of the day (independent variable) and the total amount of protein ingested over that day (dependent variable) for every hour of the day. Since each subject contributed two observations, linear mixed models with an unstructured covariance matrix were used to account for within-person correlation. The association between the amount of protein ingested during every hour of the day and the risk of low protein intake was determined using mixed-effects modelling for logistic regression. Similar analyses were done with the proportion of protein ingested during every hour of the day as independent variable. Additional analyses were done expressing total protein intake in g/kg aBW, which yielded similar results. Therefore, these results are not presented.
Possible confounding variables were identified by ‘stepwise selection’. Effect modification by sex was checked by adding an interaction term with the proportion of protein intake to the model. Analyses were adjusted for age, sex, BMI and total energy intake (model 1) and additionally for wake-up time (model 2).
Four sensitivity analyses were conducted. First, we excluded non-typical days (due to, e.g., celebrations, illness or extreme tiredness, being very busy or away from home) and days on which a special diet was followed. Second, as some studies excluded occasions where <210 kJ was consumed(Reference Ocke, Larranaga and Grioni27,Reference Haines, Hama and Guilkey28) , analyses were repeated excluding these occasions to see whether this influenced the results. Third, possible influence of outliers was tested by removing the 1 % most extreme data points of both the total protein intake and amount or proportion of protein intake in the morning depending on the analysis. Among younger adults, dietary intake on weekdays tends to be lower and earlier in the day compared to weekend days(Reference Ocke, Larranaga and Grioni27). Therefore, a fourth sensitivity analysis was conducted separately for weekdays (Monday through Thursday) and weekend days (Friday through Sunday). Friday was categorised as weekend day, since previous research has reported that intakes on Friday are more similar to those on Saturday and Sunday than they are to intakes on other weekdays(Reference Ocke, Larranaga and Grioni27,Reference Haines, Hama and Guilkey28) .
All analyses were performed using SAS software®, version 9.4, of the SAS System for Windows. The significance threshold was set at 0·05.
Results
Participant characteristics
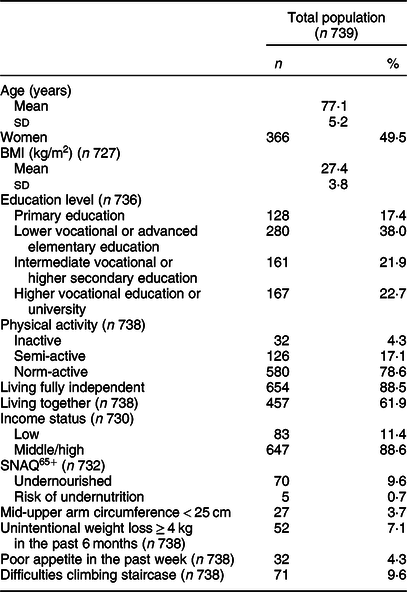
The mean age of the study population was 77·1 (sd 5·2) years, and 49·5 % were women. Most were norm-active (78·6 %), lived in fully independent housing (88·5 %) and lived together with a partner or other person (61·9 %). The percentage being screened as undernourished was 9·6 % (Table 1).
Table 1 Characteristics of Dutch community-dwelling older adults aged ≥70 years (Dutch National Food Consumption Survey–Older Adults 2010–12)*
SNAQ65+, Short Nutritional Assessment Questionnaire for 65+.
* Data are presented as number of participants and percentages (all categorical variables); mean values and standard deviations (all continuous variables).
Total protein intake
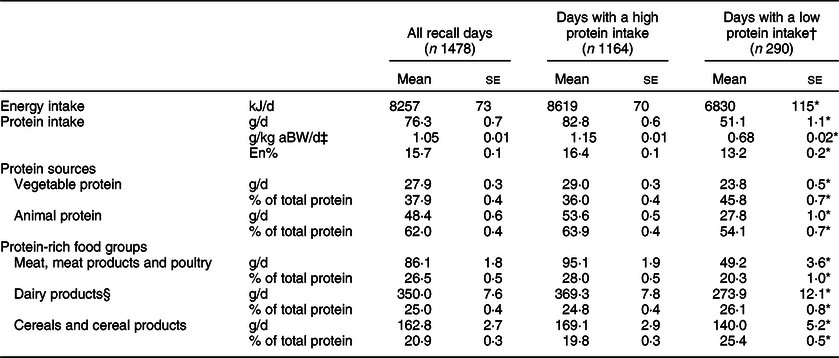
The mean dietary protein intake was 76·3 (se 0·7) g/d, 1·05 (se 0·01) g/kg aBW/d and 15·7 (se 0·1) En% (Table 2). Animal protein, especially from meat and dairy products, contributed most to total protein intake (62·0 (se 0·4) %). On 19·6 % (n 290) of all recall days, the reported protein intake was low, that is, <0·8 g/kg aBW. The mean protein intake on these days was 51·1 (se 1·1) g as compared to 82·8 (se 0·6) g on days with a high protein intake. Also, the contribution of protein to total energy intake was lower (13·2 (se 0·2) v. 16·4 (se 0·1) %, respectively). The difference in animal protein intake between days with low and days with high protein intake (27·8 (se 1·0) v. 53·6 (se 0·5) g/d, P < 0·0001) was larger than the difference in vegetable protein intake (23·8 (se 0·5) v. 29·0 (se 0·3) g/d, P < 0·0001). This resulted in a larger proportion of vegetable protein on days with a low protein intake compared to days with a high protein intake (45·8 (se 0·7) v. 36·0 (se 0·4) %, P < 0·0001).
Table 2 Mean energy and protein intake of Dutch community-dwelling older adults aged ≥70 years for all recall days and separately for days with a low protein intake and days with a high protein intake (Dutch National Food Consumption Survey–Older Adults 2010–12)
aBW, adjusted body weight; En%, percentage of energy intake.
† Days with a low protein intake represent days with protein intake <0·8 g/kg aBW.
‡ Grams of protein per kilogram BW calculated after adjustment to the nearest weight that would place the subject in the healthy BMI range (18·5–24·9 kg/m2 for adults ≤70 years; 22–27 kg/m2 for adults aged ≥71 years). Missing for n 24 recall days.
§ Dairy products represent milk and milk products and cheese.
* P ≤ 0·05 for days with a low v. days with a high protein intake.
Protein intake pattern over the day
The pattern of protein intake over the day is presented in Fig. 1. Protein intake, expressed as the proportion of total protein intake, differed across hours of the day (F 371·6, P < 0·0001) with peaks between 08.30 and 09.29 hours (mostly breakfast), 12.30 and 13.29 hours (mostly lunch) and 17.30 and 18.29 hours (mostly dinner). Adjusting for wake-up time did not influence the proportions nor the differences in proportions across hours of the day. The proportion of protein intake also differed across hours of being awake (F 159·3, P < 0·0001) with peaks between 00.00–00.59, 05.00–05.59 and 10.00–10.59 hours after waking up (Supplemental Fig. S1). Excluding non-typical days, occasions providing <210 kJ energy or outliers did not influence the protein intake patterns. On weekdays, protein intake was earlier in the day than on weekend days, but total protein intake was similar (75·5 (se 0·9) v. 77·2 (se 1·0) g/d, P = 0·13).
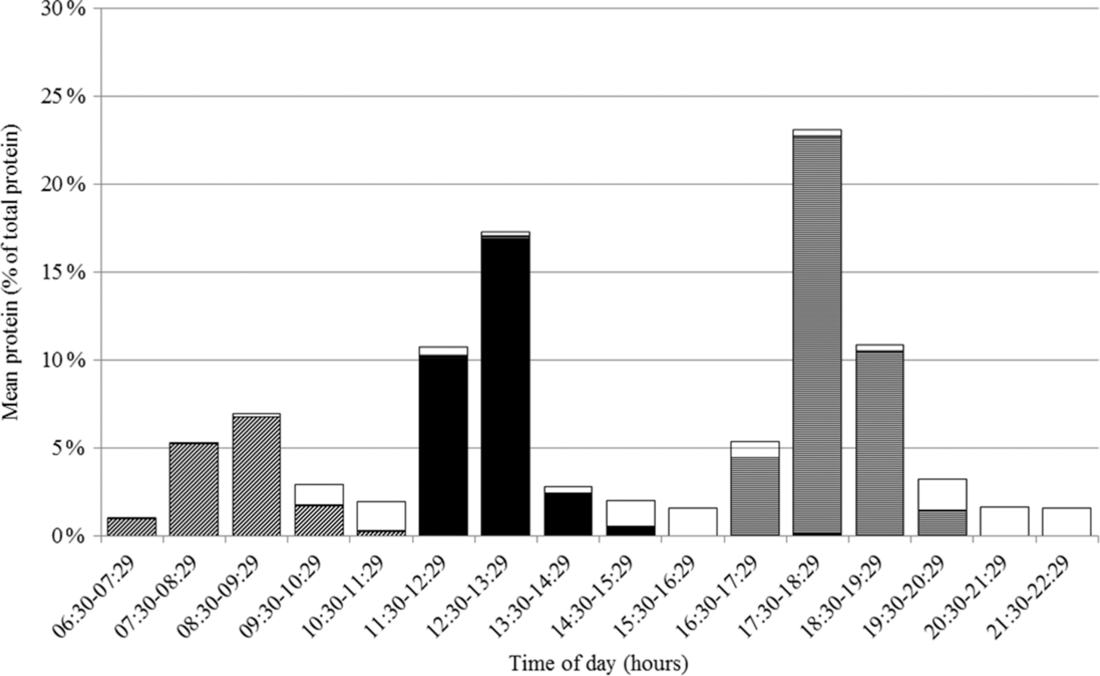
Fig. 1 Proportion of total protein intake in Dutch community-dwelling older adults aged ≥70 years across time of the day and specified for breakfast (![]() ), lunch (
), lunch (![]() ), dinner (
), dinner (![]() ) and in between meal (
) and in between meal (![]() ) occasions (Dutch National Food Consumption Survey–Older Adults 2010–12)
) occasions (Dutch National Food Consumption Survey–Older Adults 2010–12)
Differences in protein intake pattern between days with low and high protein intake
At each hour of the day, absolute protein intake was lower on days with a low protein intake than on days with a high protein intake. Only at four time-points the difference was not statistically significant (Fig. 2(a)). The differences were largest (>3 g) for intake between 11.30–12.29, 12.30–13.29, 17.30–18.29 and 18.30–19.29 hours. Relatively (as a proportion of total protein intake), a significantly higher proportion of protein was ingested between 08.30–09.29, 09.30–10.29 and 10.30–11.29 hours on days with a low protein intake compared to days with a high protein intake (Fig. 2(b)). No statistically significant differences were observed for hours later in the day. Similar results were found when using time since wake-up instead of actual time (00.00–00.59 hours after wake-up, Δmean 1·82 %, P = 0·003; 01.00–01.59 hours after wake-up, Δmean 1·44 %, P = 0·022).
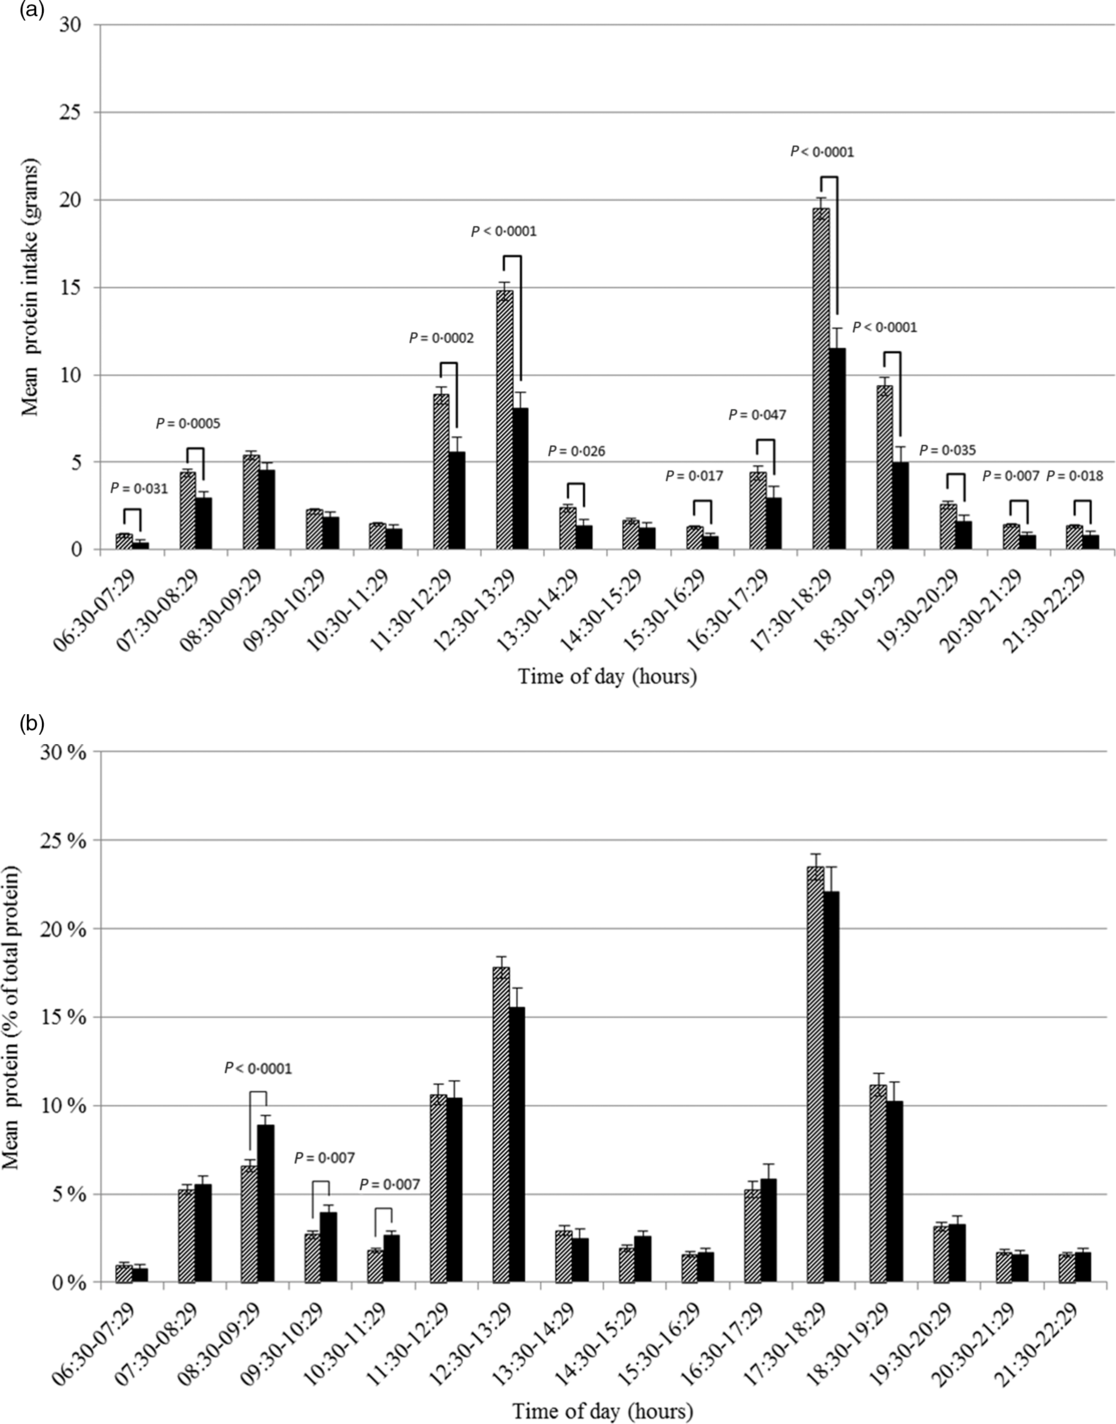
Fig. 2 Amount (a) and proportion (b) of total protein intake in Dutch community-dwelling older adults aged ≥70 years across time of the day and stratified by low protein intake (Dutch National Food Consumption Survey–Older Adults 2010–12). ![]() , days with a high protein intake;
, days with a high protein intake; ![]() , days with a low protein intake
, days with a low protein intake
Differences in protein intake pattern according to appetite, unintentional weight loss and undernutrition
Protein intake was somewhat lower on days of subjects reporting a poor appetite than on days of subjects not reporting a poor appetite (71·1 (se 4·1) v. 77·3 (se 0·9) g), but this difference was not statistically significant (P = 0·15). There was no difference in the protein intake pattern over the day between these two groups (Fig. 3). Furthermore, no differences in the protein intake pattern were found according to reported unintentional weight loss. For 2 h of the day, the proportion of protein intake on days of subjects being screened as undernourished differed significantly from the proportion on days of subjects not being screened as undernourished. However, for 17.30–18.29 hours the proportion was higher (27·7 (se 2·3) v. 22·9 (se 0·7) %, P = 0·048) and for 18.30–19.29 hours the proportion was lower (11·6 (se 0·6) v. 6·2 (2·0) %, P = 0·0089), suggesting no clear shift in the timing of protein intake.
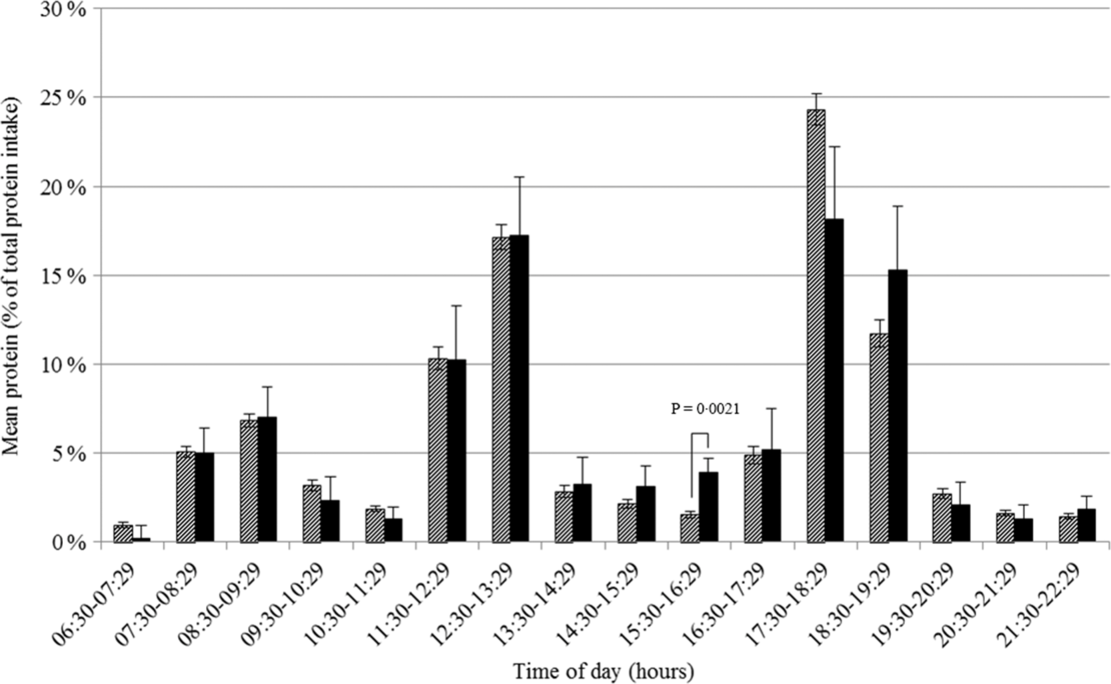
Fig. 3 Proportion of total protein intake in Dutch community-dwelling older adults aged ≥70 years across time of the day and stratified by loss of appetite in the past week (Dutch National Food Consumption Survey–Older Adults 2010–12). ![]() , no appetite loss;
, no appetite loss; ![]() , appetite loss
, appetite loss
Association between the protein intake pattern over the day and total protein intake
For all but one hour of the day, the amount of protein ingested that hour was associated with total protein intake. In contrast, there was a significant association between the proportion of protein intake and total protein intake only for several morning hours (08.30–09.29 hours, β 1 –0·16, P < 0·0001; 09.30–10.29 hours, β 1 –0·13, P = 0·030; 10.30–11.29 hours, β 1 –0·23, P = 0·012). Therefore, further analyses focused on morning protein intakes (between 06.30 and 11.29 hours pooled together). For the other remaining hours, similar timeframes were defined (11.30–16.29 and 16.30–22.29 hours), representing mid-day and evening.
The amount of protein intake in the morning, mid-day and evening was lower on days with a low protein intake as compared to days with a high protein intake (11·4 (se 0·4) v. 14·1 (se 0·3) g, 16·9 (se 0·9) v. 28·9 (se 0·5) g and 22·6 (se 0·9) v. 38·5 (se 0·5) g, respectively; all P < 0·0001).
A higher amount of protein intake in the morning, mid-day and evening were all associated with a higher total protein intake (β 1 1·11, 0·86 and 0·90 g, respectively; all P < 0·0001), also after adjusting for age, sex, BMI and total energy intake (β 1 0·46, 0·55, 0·65 g; P < 0·0001) (Table 3 and Fig. 4). The sensitivity analyses yielded comparable results. When time was expressed in hours being awake, regression coefficients were smaller.
Table 3 Association between the amount of protein (g) ingested in the morning (06.30–11.29 hours), mid-day (11.30–16.29 hours) and evening (16.30–22.29 hours) and total protein intake and risk of low protein intake (Dutch National Food Consumption Survey–Older Adults 2010–12)
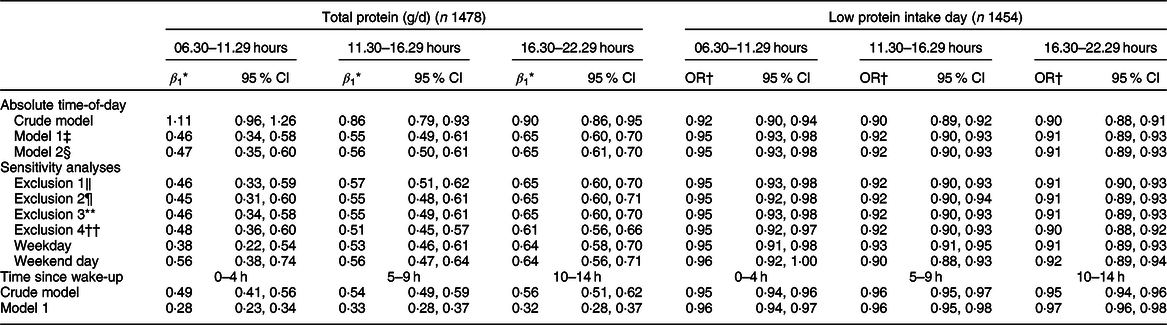
β 1, slope.
* β for a 1 % higher amount of protein intake.
† OR for a 1 % increase in the amount of protein ingested.
‡ Model 1: adjusted for age + sex + BMI + energy intake.
§ Model 2: adjusted for age + sex + BMI + energy intake + wake-up time.
‖ Exclusion 1: model 1 excluding non-typical days.
¶ Exclusion 2: model 1 excluding special diets.
** Exclusion 3: model 1 excluding occasions with energy intake <210 kJ.
†† Exclusion 4: model 1 excluding 1 % most extreme data points of the amount of protein intake per time period and total protein intake.
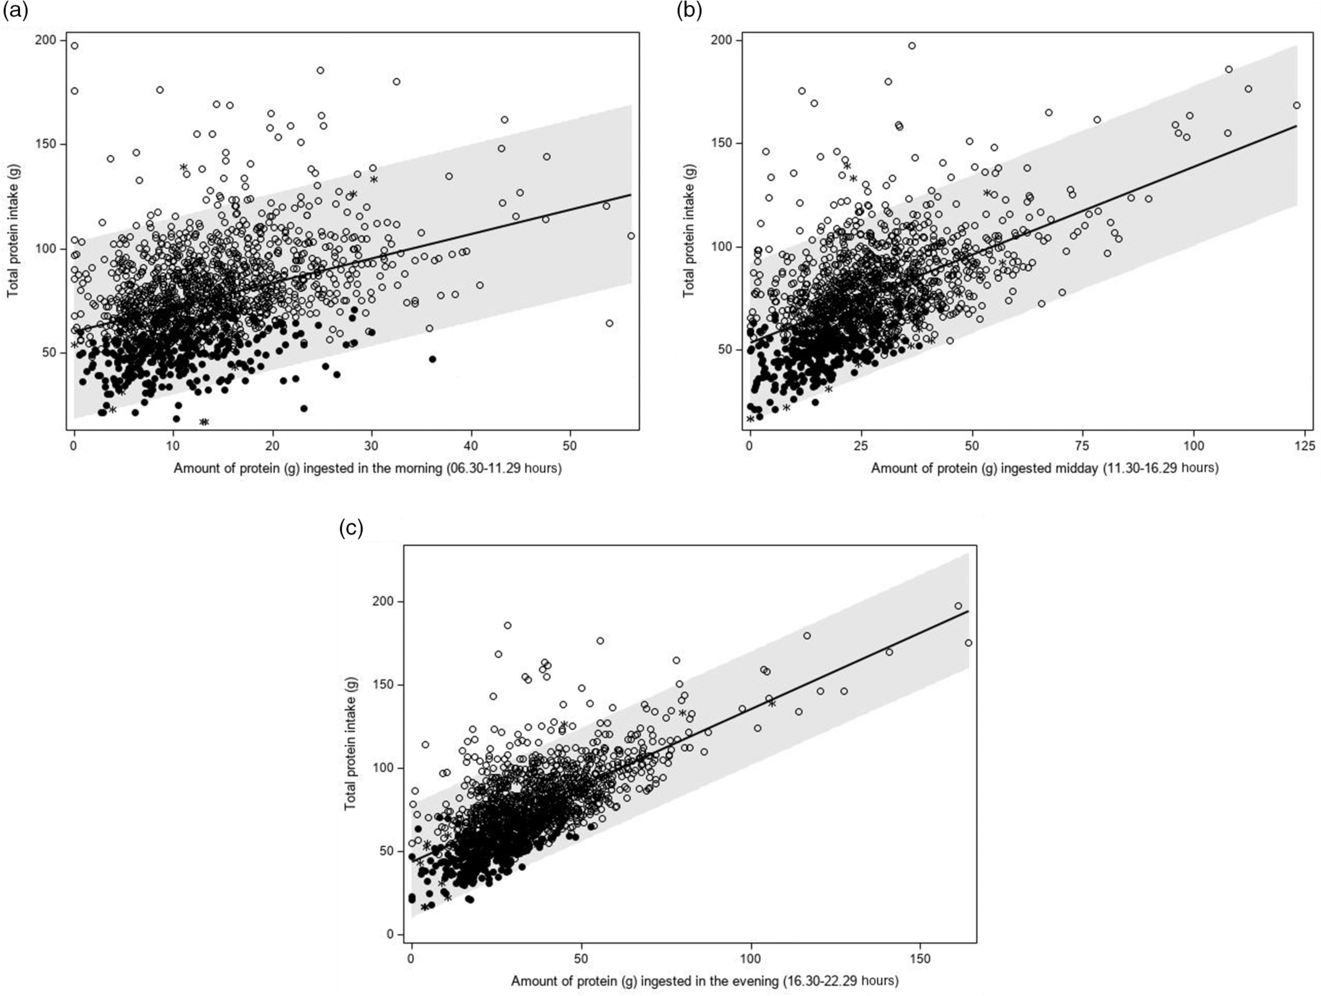
Fig. 4 Association between the amount of protein ingested in the morning (a: 06.30–11.29 hours), mid-day (b: 11.30–16.29 hours) or evening (c: 16.30–22.29 hours) and total protein intake (g/d) (Dutch National Food Consumption Survey–Older Adults 2010–12). ![]() , day with a high protein intake;
, day with a high protein intake; ![]() , day with a low protein intake;
, day with a low protein intake; ![]() , non-labelled day
, non-labelled day
The proportion of protein intake ingested in the morning was higher on days with a low protein intake than on days with a high protein intake (22·0 (se 0·6) v. 17·2 (se 0·3) %, P < 0·0001). The proportion of protein intake mid-day and evening was lower on days with a low protein intake (32·3 (se 0·9) v. 34·9 (se 0·5) g, P = 0·006; and 44·4 (se 0·9) v. 46·3 (se 0·5) g, respectively, P = 0·048).
A higher proportion of protein intake in the morning was significantly associated with a lower total protein intake (β 1 –0·58 g, P < 0·0001) (Table 4 and Fig. 5(a)). A higher proportion of protein intake mid-day or evening was associated with a higher total protein intake (β 1 0·09 g, P = 0·035 and β 1 0·14 g, P = 0·0003, respectively), but regression coefficients were smaller than those observed for the proportion of protein ingested in the morning (Table 4, Fig. 5(b) and (c)). The regression coefficients decreased slightly after adjusting for age, sex, BMI and total energy intake and were quite similar for weekdays and weekend days. Further adjusting for wake-up time did not alter the abovementioned findings. When time was expressed in hours being awake, regression coefficients were smaller. Excluding non-typical days, occasions providing <210 kJ energy and outliers had little effect on the regression coefficients.
Table 4 Association between the proportion of protein (g) ingested in the morning (06.30–11.29 hours), mid-day (11.30–16.29 hours) and evening (16.30–22.29 hours) and total protein intake and risk of low protein intake (Dutch National Food Consumption Survey–Older Adults 2010–12)
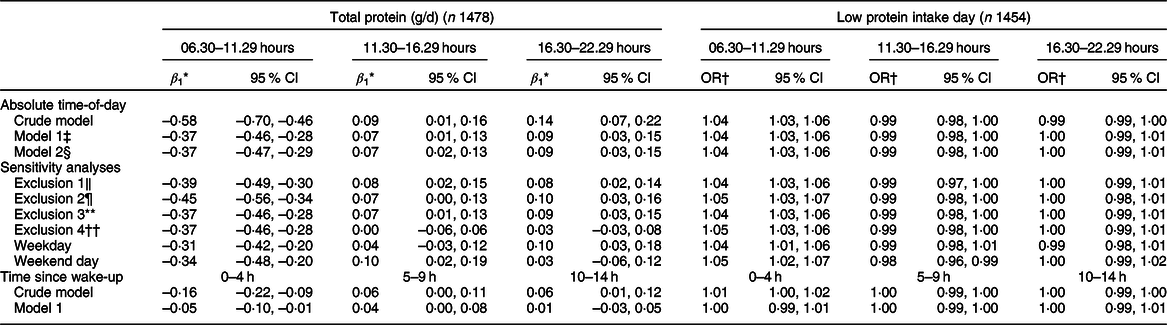
β 1, slope.
* β for a 1 % higher amount of protein intake.
† OR for a 1 % increase in the amount of protein ingested.
‡ Model 1: adjusted for age + sex + BMI + energy intake.
§ Model 2: adjusted for age + sex + BMI + energy intake + wake-up time.
‖ Exclusion 1: model 1 excluding non-typical days.
¶ Exclusion 2: model 1 excluding special diets.
** Exclusion 3: model 1 excluding occasions with energy intake <210 kJ.
†† Exclusion 4: model 1 excluding 1 % most extreme data points of the amount of protein intake per time period and total protein intake.
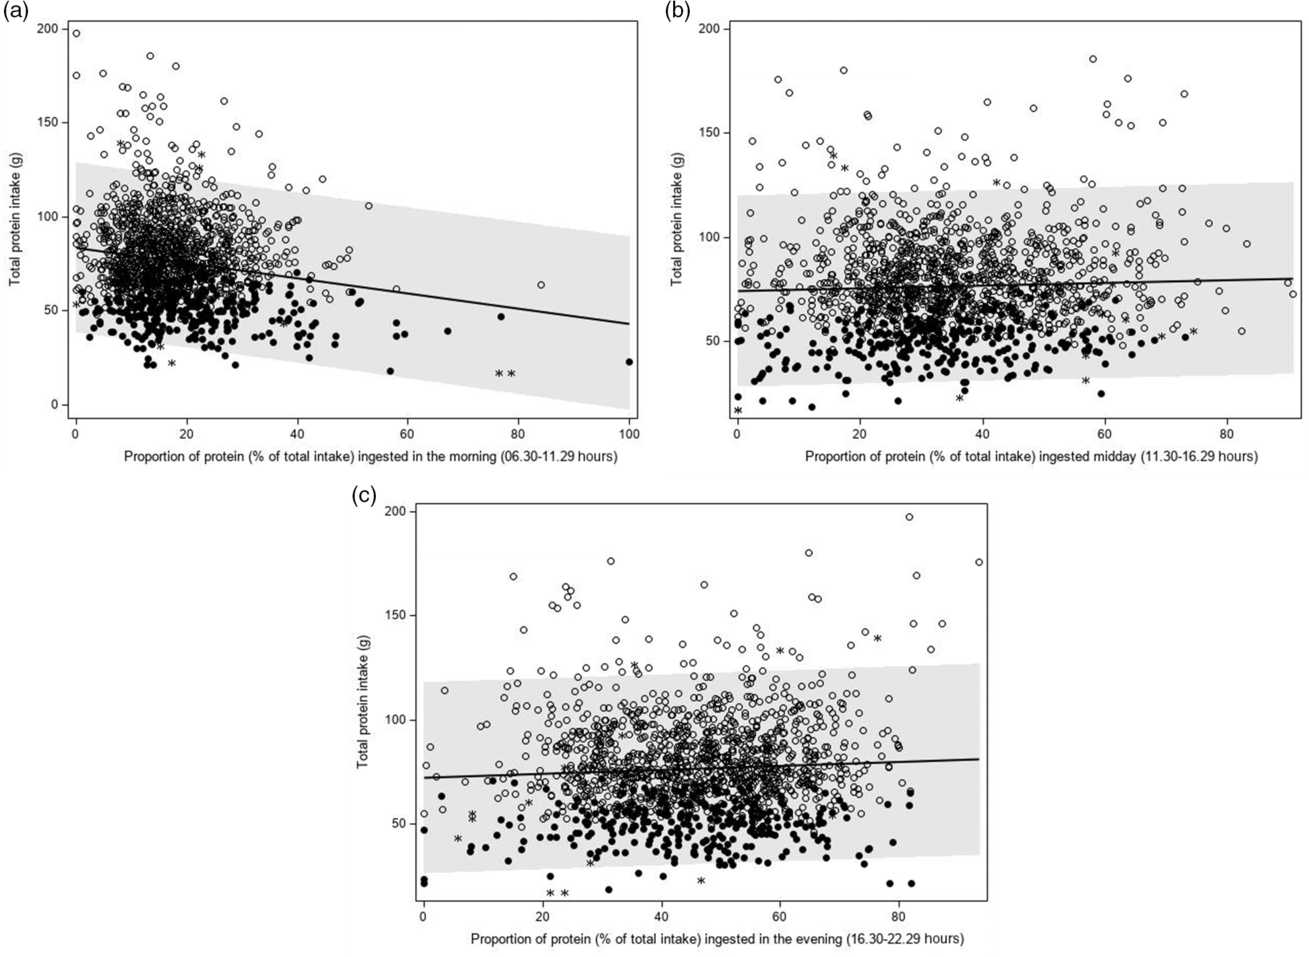
Fig. 5 Association between the proportion of protein ingested in the morning (a: 06.30–11.29 hours), mid-day (b: 11.30–16.29 hours) or evening (c: 16.30–22.29 hours) and total protein intake (g/d) (Dutch National Food Consumption Survey–Older Adults 2010–12). ![]() , day with a high protein intake;
, day with a high protein intake; ![]() , day with a low protein intake;
, day with a low protein intake; ![]() , non-labelled day
, non-labelled day
Association between protein pattern and the odds of low protein intake
An increase in the amount of protein intake in the morning, mid-day or evening resulted in a lower odds of low protein intake (Table 3). An increase in the proportion of protein intake in the morning, however, was significantly associated with a higher odds of low protein intake (OR per 1 % increase in the proportion of protein intake in the morning: 1·04, 95 % CI 1·03, 1·06) (Table 4). For protein intake mid-day, an opposite but weaker association was observed (OR 0·99, 95 % CI 0·98, 1·00 after adjusting for age, sex, BMI and energy intake). For the evening hours, the association was not statistically significant after adjustment (OR 1·00, 95 % CI 0·99, 1·01). In the sensitivity analyses, similar results were obtained.
Discussion
The present study provides detailed information on the protein intake patterns over the day in Dutch community-dwelling older adults. Protein intake varied considerably over the day, and the distribution of protein intake over the day differed between days with a low protein intake and days with a high protein intake. The amount of protein ingested in the morning, mid-day or evening was lower on days with a low protein intake. In addition, a higher amount of protein intake in all three parts of the day was associated with a higher total protein intake and a lower risk of low protein intake. In contrast, the morning hours accounted for a larger proportion of total protein intake on days with a low protein intake, and a higher proportion of protein in the morning was associated with a lower total protein intake and a higher risk of low protein intake. Associations for the proportion of protein ingested mid-day or evening were much weaker. Associations were insensitive to adjustment for wake-up time, exclusion of non-typical days, outliers and occasions providing <210 kJ, and were consistent across weekdays and weekend days. These results suggest that the timing of protein intake may affect total protein intake.
Our findings in older persons extend those of de Castro(Reference de Castro10) who found that the proportion of protein intake in the morning was negatively associated with total protein intake among 867 men and women with a mean age of 36 years. To the best of our knowledge, there is only one other study that addressed the protein intake pattern in relation to total protein intake in older adults. Also, in that study, morning eating contributed more to total protein intake in the group of old (85+) men and women defined as having a low protein intake using the same cut-off values as we did(Reference Mendonça, Granic and Mathers11). de Castro(Reference de Castro10) postulated that a higher contribution of morning meals to protein intake might produce greater satiety than later in the day. This hypothesis is supported by Leidy et al.(Reference Leidy, Bossingham and Mattes17) who found that a breakfast high in protein (1·4 g/kg BW/d) led to greater overall fullness compared to a high-protein lunch or dinner in nine men (mean age 48 years) during energy restriction. In contrast, Bollwein et al.(Reference Bollwein, Diekmann and Kaiser15) have reported that among community-dwelling older adults (≥75 years), frail subjects ingested significantly less protein at breakfast (absolute intake), but more protein at lunch, than pre-frail and non-frail older adults. However, no differences in total protein intake were found. This indicates that morning protein intakes contributed less to total protein intake in frail compared to pre-frail and non-frail older adults. The time at which the meals were consumed was not reported. Therefore, it is not possible to determine whether differences in the timing of meals might have played a role.
A higher amount of protein in the morning is associated with a higher total protein intake and a lower risk of low protein intake even when adjusting for total energy intake. Similar positive associations were observed for the amount of protein ingested mid-day or evening. Based on these associations, one may hypothesise that increasing protein intake at any time of day may positively affect total protein intake. A higher intake at either time of day may, however, probably just reflect a higher food consumption and does not necessarily provide information on the distribution of protein intake over the day. The association between the proportion of energy intake in the morning and total protein intake observed in our study was stronger than the association between the proportion of energy ingested mid-day and that in the evening. Based on these associations and the supporting evidence described above, one may hypothesise that increasing protein intake in the morning may negatively impact total protein intake.
It has been suggested that 25–30 g of dietary protein per meal is required to maximally stimulate skeletal muscle protein synthesis and prevent sarcopenia(Reference Paddon-Jones and Rasmussen29). This would imply that morning intake, which is 13·5 (se 0·3) g in our population, should be increased. The mean absolute protein intake in the morning was somewhat lower on days with a low protein intake compared to days with a high protein intake (11·4 v. 14·1 g, respectively). The differences in absolute protein intake mid-day (16·9 v. 28·9 g) and in the evening (22·6 v. 38·5 g) were much larger, resulting in a higher proportion of protein intake in the morning on days with a low protein intake. To improve protein intake, it may therefore be better to focus more on the hours after noon.
Drawing conclusions on the effect of timing of protein intake on total protein intake from our study is thus difficult. Therefore, experimental studies actively manipulating protein intakes at different hours of the day are needed to study the effect of timing of protein intake on total protein intake and to define optimal timing strategies to increase the likelihood of adequate protein intake. Such experimental studies will also shed more light on the possible clinical implications of manipulating the timing of protein intake.
Strengths of the present study include the use of exact timing of meals, enabling us to look more closely at the protein intake pattern compared to studies that only collected data on main meals and/or other food consumption occasions. Another strength of our study is the adjustment for wake-up time, which is a significant confounding factor, especially among older adults where a large variation in wake-up time exists(Reference Ohayon and Vecchierini30,Reference Reyner, Horne and Reyner31) . Yet, none of the referenced studies addressed wake-up time. In the current study, wake-up time ranged from 00.00 to 11.00 hours, but did not differ between days with high and low protein intakes. In addition, both the regression coefficient and the OR for time of protein intake since wake-up were smaller compared to the estimates for the absolute time of protein intake. This suggests that absolute time is more important in this context than time since wake-up. The use of 24-h recalls combined with the food dairy is another strength, as it provided detailed information on specific foods consumed. The food diary was filled out at the time of consumption, thereby reducing reliance on memory and minimising the probability of misreporting by participants(Reference Baranowski and Willet32).
A limitation of the present study is its cross-sectional design that did not allow making inferences on causal relations. In addition, the participation rate was low (26 %). Subjects who participated in DNFCS–Older Adults had lesser cognitive and physical impairments than the general population of older Dutch adults. Only few older adults with functional disabilities took part, and they had the lowest protein intake(Reference Ocké, Buurma-Rethans and de Boer6). If the survey would have been more representative for the general older population, more older adults with disabilities must be included. This would probably have resulted in more days with a low protein intake and a lower average protein intake on these days.
To conclude, a larger amount of protein intake during morning, mid-day or evening hours is associated with a higher total protein intake among Dutch community-dwelling older adults. However, a higher proportion of protein in the morning was associated with a lower total protein intake, whereas the proportion of protein ingested mid-day or evening showed an opposite but weaker association with total protein intake. This suggests that the timing of protein intake may also be important. Future research should focus on establishing whether active manipulation of the timing of protein intake could influence total protein intake. If confirmed, this may have implications in dietary strategies to prevent protein-related health outcomes, such as PEM, among older adults.
Acknowledgements
Acknowledgements: Not applicable. Financial support: Funding for this research was provided by the European Horizon 2020 PROMISS Project ‘Prevention of Malnutrition in Senior Subjects in the EU’, grant agreement no. 678732 (J.M.A.B., L.M.H., M.V.). The content only reflects the authors’ view, and the Commission is not responsible for any use that may be made of the information the article contains. Conflict of interest: None. Authorship: T.H.R. and J.M.A.B. were responsible for the development of research questions and analysing the data. M.C.O. was one of the principal investigators of DNFCS–Older Adults and consulted for methodological and statistical advice. L.M.H. and M.V. contributed by providing their expertise in PEM in older adults. T.H.R. and J.M.A.B. wrote the article. The other authors commented on draft versions and approved the final version. Ethics of human subject participation: This study was conducted according to the guidelines laid down in the Declaration of Helsinki, and all procedures involving study participants were approved by the Ethics Committee of the University Medical Centre Utrecht. Written informed consent was obtained from all subjects.
Supplementary material
For supplementary material accompanying this article visit https://doi.org/10.1017/S1368980020000026


 Open access