


While the prevalence of undernutrition has declined( 1 ), the number of overweight and obese individuals has surged from 857 million in 1980 to more than 2·1 billion in 2013( 1 , Reference Ng, Fleming and Robinson 2 ). Obesity is a multifactorial issue, stemming from a range of social, economic, biological and environmental influences( Reference Swinburn, Sacks and Hall 3 – Reference Vandevijvere, Chow and Hall 8 ). Debates on the drivers of obesity have often been dichotomized, with arguments emphasizing either individual responsibility or obesogenic environments as critical influences( Reference Swinburn, Kraak and Rutter 9 ).
Swinburn et al.( Reference Swinburn, Sacks and Hall 3 , Reference Vandevijvere, Chow and Hall 8 ) emphasize that the global food system is the main culprit in the simultaneous increases of obesity observed in almost all countries. Unhealthy food environments foster unhealthy diets through widespread availability of cheap, highly palatable, heavily promoted, energy-dense and nutrient-poor foods. Governments can play a crucial role in improving the healthiness of food environments through policies and regulations( Reference Lang and Rayner 10 – 13 ). While there is agreement by international experts and organizations on the priorities for improving the healthiness of food environments and reducing obesity( 13 , 14 ), global progress on implementation of those priorities is very sparse( Reference Roberto, Swinburn and Hawkes 15 ). Therefore, monitoring and benchmarking of progress to increase accountability of governments and other actors is critical( Reference Swinburn, Kraak and Rutter 9 ).
INFORMAS (The International Network for Food and Obesity/non-communicable diseases Research, Monitoring and Action Support) developed the Healthy Food Environment Policy Index (Food-EPI) to assess and benchmark the extent of implementation of policies for creating healthy food environments by national governments globally to reduce obesity and nutrition-related non-communicable diseases. The Food-EPI has two components, a ‘policy’ and ‘infrastructure support’ component( Reference Swinburn, Vandevijvere and Kraak 11 ), each comprising a series of policy domains and good practice indicators within those domains. The Food-EPI allows national public health experts to rate the extent of implementation of each of the good practice indicators by their government compared with international best practice( Reference Swinburn, Vandevijvere and Kraak 11 , Reference Swinburn, Dominick and Vandevijvere 16 , Reference Phulkerd, Vandevijvere and Lawrence 17 ), resulting in a dashboard of indicators( Reference Phulkerd, Vandevijvere and Lawrence 17 , Reference Vandevijvere, Dominick and Devi 18 ). However, the relative contribution of these good practice policies within the Food-EPI to improve population nutrition has not been established.
The aim of the present study was therefore to quantify, through the development of weightings, the relative contributions of the nineteen widely recommended good practice food environment policies within the ‘policy’ component of the Food-EPI to improve population nutrition, based on evidence of their effectiveness from the literature and food policy expert ratings. This will enable calculation of a composite Food-EPI score for each country and therefore facilitate benchmarking of the implementation of food environment policies globally. Weightings for the indicators within the ‘infrastructure support’ component of the Food-EPI (e.g. indicators on leadership, governance, funding, etc.) are set at 1 due to the lack of empirical evidence of their impact on improving population nutrition and because all those indicators are considered necessary for policy development and implementation.
Methods
A Delphi study( Reference Ziglio 19 ) with two rounds was conducted in 2015 to obtain consensus among a group of international food policy experts on the relative contributions of nineteen recommended food environment policies (see online supplementary material, Supplemental Table 1) to improve population nutrition. An electronic Delphi method was used to enable experts who are geographically dispersed to contribute their opinions and offered quasi-anonymity, allowing participants to complete the study in their own time without being influenced by other participants in the group and/or group pressure to conform. Ethics approval to conduct this study was obtained from the University of Auckland Human Participants Ethics Committee (reference number: 012195).
Recruitment of experts
International experts with knowledge, experience and contributions to the field of food or nutrition policy were identified using different sources, including the INFORMAS, World Public Health Nutrition Association and World Obesity Federation membership databases, as well as personal contacts. An initial list of eighty potential experts was identified, including scientists and advocates from international non-governmental organizations. This list of experts was reduced to fifty-six experts after applying a set of eligibility criteria: (i) having in-depth knowledge and a high level of practical engagement in the area of food and nutrition policy in the context of reducing obesity and diet-related non-communicable diseases, including an understanding of the influence of food environments; (ii) having made excellent scientific contributions in this field; and (iii) having more than 10 years of experience in the field of food and nutrition policy.
Review of evidence on the effectiveness of recommended food environment policies
Prior to data collection, a comprehensive narrative summary of evidence of effectiveness on improving population nutrition over the last 10 years (since 2004) was produced for each of the nineteen good practice policies. The methods and results of this review can be found in the online supplementary material, Supplemental File 1. This review was intended for use by experts participating in the Delphi process to support their judgements in the rating process. The evidence summary comprised results from systematic reviews where available. Where systematic reviews could not be found, reviews and individual studies were used. Only evidence relating to improving population nutrition was summarized, excluding outcomes such as consumer rights and inequalities, because there is less scientific evidence for those considerations, and it would require different experts to be included and a different set of weightings to be created. The INFORMAS module leaders were asked to review the respective evidence summaries (e.g. wording of the evidence, providing extra references) for their policy domain before it was sent out.
Data collection
The Analytic Hierarchy Process (AHP) method was used as it allows making complex decisions using pairwise comparisons( Reference Saaty 20 ). A questionnaire was constructed in Microsoft® Excel 2013 using the basic principles and mathematical calculations of the AHP method( Reference Saaty 20 ). Experts compared and rated all possible pairs of policy domains and good practice policies within domains according to the Saaty scale (1 to 9). Experts were also asked to provide brief comments to justify their ratings. Weightings were then calculated using the AHP method from those expert ratings for each policy domain and each good practice policy within each policy domain. More details about the AHP method and its application in the present study can be found in the online supplementary material, Supplemental File 2.
For Round 1, an email was sent out to participants containing three attachments: (i) instructions, (ii) a questionnaire including items to be rated in pairwise comparisons and (iii) a sixty-five-page summary on evidence of effectiveness of the nineteen good practice policies on improving population nutrition. A second Delphi round was conducted so that experts could reconsider their ratings based on feedback and results from the first round.
In Round 2, experts were provided with a summary of the results including the weightings (and variance around the average weightings) and participant comments from Round 1, any clarifications based on those comments and a new questionnaire.
During Round 2, participants were asked to revise or adjust their weightings from Round 1 for each good practice indicator within each policy domain. The sum of weightings for the group of good practice policies within a policy domain was fixed at 100. Experts were also asked to take the level of consensus (i.e. width of confidence intervals around the average weightings) for each policy from Round 1 into account, when revising the weightings. Revising weightings for food policy domains was not needed in Round 2 given that the group’s ratings for all food domains achieved high consensus in Round 1.
Data analysis
Analyses were undertaken in 2016 in Microsoft Excel 2013 and were similar for Round 1 and 2. The priority weightings derived from the AHP method were used to create aggregated weightings for each good practice policy and food policy domain( Reference Forman and Peniwati 21 ). The geometric mean weighting was calculated for each good practice policy and each policy domain( Reference Forman and Peniwati 21 ). Final weightings for each good practice indicator were determined by multiplying the weighting of the good practice policy (e.g. front-of-pack labelling) with the weighting of its respective food policy domain (e.g. labelling). These weightings were then normalized. From the normalized weightings, relative weightings were created by comparing the weighting of each policy to the lowest good practice policy weighting.
Descriptive statistical analyses were undertaken which included measures of central tendency (arithmetic mean of individual geometric means) and confidence intervals calculated at the 0·05 significance level to assess levels of consensus among experts.
Results
Thirty-seven of the fifty-six experts invited to participate in the Delphi process consented to participate. Of the thirty-seven experts who were sent the questionnaire, twenty-seven returned a completed questionnaire for the first round and twenty-one for the second round. The overall response rate was 48·2 % for the first round and 37·5 % for the second round of the Delphi. Participants from the first round were geographically diverse with 33 % from Australia/New Zealand, 26 % from UK and Europe, 19 % from North America, 15 % from South and Central America and 7 % from Asia.
First-round weightings
The aggregated weightings showed that, overall, policies within the Food Price domain were evaluated as the most important in terms of their effectiveness to improve population nutrition while policies within the Food Trade domain were assessed as contributing the least to improving population nutrition. There was relatively high consensus for the weightings of all policy domains as the confidence intervals were relatively small (Table 1).
Table 1 Aggregated weightings for the different food policy domains to improve population nutrition derived from Round 1 of the Delphi process performed with international food policy experts (n 27) in 2015
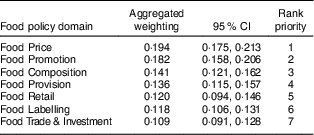
Figure 1 shows the normalized relative weightings of each good practice policy ordered from smallest to largest. The top seven policies evaluated as being the most important to improve population nutrition were: High tax on unhealthy foods>Restriction of unhealthy food marketing in children’s settings>Healthy school food policies>Low tax on healthy foods>Intent of existing subsidies for healthy foods>Front-of-pack labelling>Restriction of unhealthy food marketing to children on non-broadcast media and broadcast media. The three policies that were evaluated as contributing the least to improving population nutrition were: Menu board labelling>Food claim regulation>Private workplace food policies. The weighting for High tax on unhealthy foods was more than three times that of Private workplace food policies. Confidence intervals around the weightings were generally found to be small (Fig. 1).
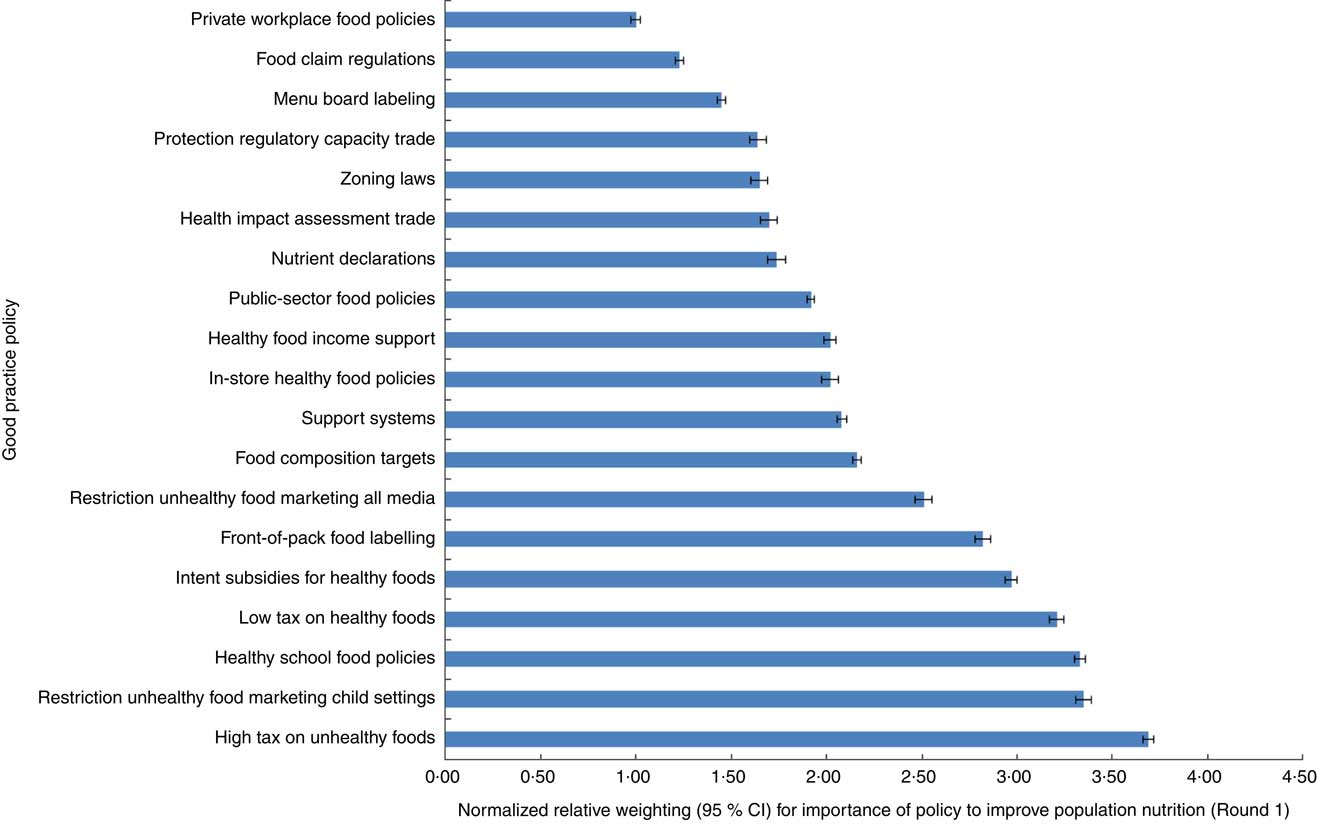
Fig. 1 (colour online) Bar chart showing the normalized relative weightings (with 95 % CI represented by horizontal bars) for each of the good practice policies to improve population nutrition derived from Round 1 of the Delphi process performed with international food policy experts (n 27) in 2015
First-round expert commentary
Based on expert comments from Round 1, two issues were clarified/changed in regard to the good practice policies for Delphi Round 2:
1. Some experts’ comments indicated that ‘food claim regulations’ were rated lower than other policies because of their potential to mislead and cause harm to consumers. However, the weightings should have been based on the relative contribution of policies to restrict health and nutrition claims on improving population nutrition and not on the impact of the claims themselves.
2. The original policy statement on ‘restricting unhealthy food marketing to children through all media’ was found to be too broad by the experts to obtain robust weightings and was split into two different marketing policies, one focusing on broadcast and the other one on non-broadcast media.
Second-round weightings
The top eight policies that were evaluated the most important to improve population nutrition were the same as in Round 1 but the order was slightly different: High tax on unhealthy foods>Healthy school food policies>Low tax on healthy foods>Intent of existing subsidies for healthy foods>Restriction of unhealthy food marketing in children’s settings>Front-of-pack labelling>Restriction of unhealthy food marketing to children on non-broadcast media>Restriction of unhealthy food marketing to children on broadcast media. The three policies that were evaluated as contributing the least to improving population nutrition were: Menu board labelling>Nutrient declarations>Private workplace food policies (Fig. 2).
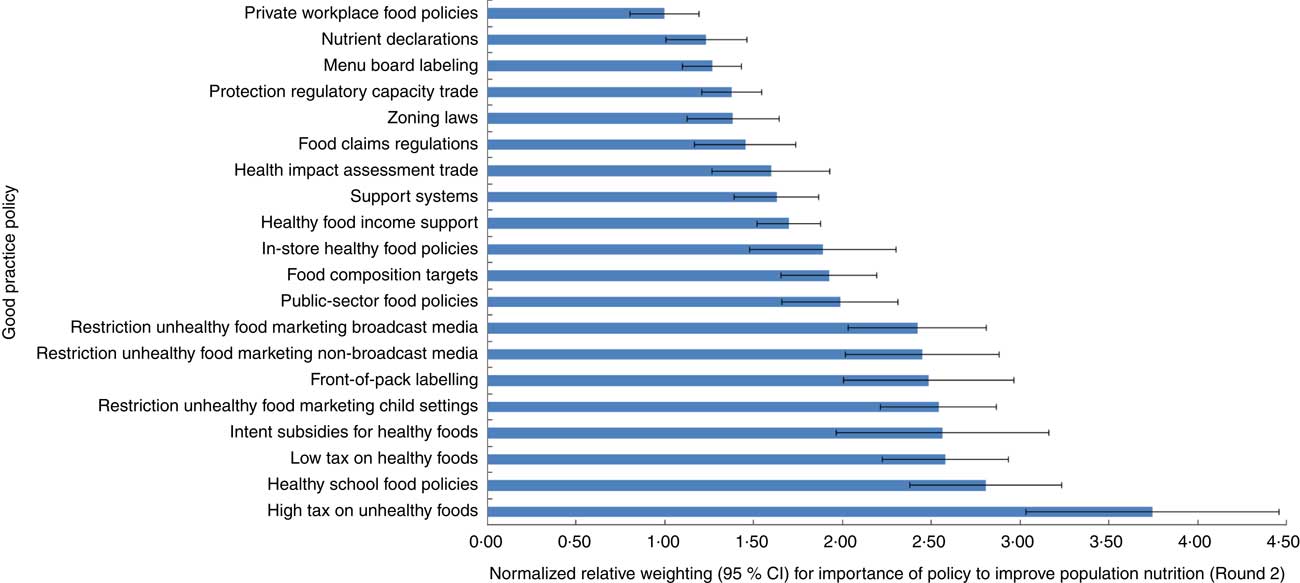
Fig. 2 (colour online) Bar chart showing the normalized relative weightings (with 95 % CI represented by horizontal bars) for each of the good practice policies to improve population nutrition derived from Round 2 of the Delphi process performed with international food policy experts (n 21) in 2015
The ranking of policies changed slightly compared with Round 1, but the weightings derived were similar. The confidence intervals around the weightings were higher than in Round 1 (Fig. 2).
Application of the weightings
As a matter of illustration, Table 2 shows the results of applying the normalized relative weightings for the relative contributions of the different good practice food environment policies to calculate the composite Food-EPI scores for Thailand( Reference Phulkerd, Vandevijvere and Lawrence 17 ) and New Zealand( Reference Vandevijvere, Dominick and Devi 18 ). The average weightings are multiplied by the average rating given by the national expert panel on the percentage of implementation of governments compared with international best practice for each indicator.
Table 2 Healthy Food Environment Policy Index (Food-EPI) composite scores for New Zealand and Thailand
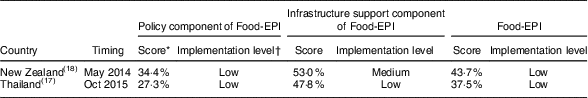
* Weighted score on the overall degree of implementation of food environment policies compared with international best practice.
† Degree of implementation compared with international best practice: <25 %, very little if any; 25–50 %, low, 50–75 %, medium; >75 %, high.
The indicators within the infrastructure support component domains (e.g. leadership, governance, funding, monitoring, platforms and health-in-all-policies) of the Food-EPI get assigned a weighting of 1.
Discussion
Despite growing interest worldwide for preventive action to be taken to curb the obesity epidemic, there has been very little examination of the relative contribution of different recommended policies to improving population nutrition. The present study utilized a modified Delphi technique to obtain expert opinion and agreement on the relative contribution of different food policy domains and good practice policies within the domains to improving population nutrition.
The study showed that, as evaluated by international food policy experts, policies such as taxing unhealthy foods and healthy food provision in schools were given the highest weightings for relative contribution to improve population nutrition, as supported by the evidence (Supplemental File 1) and international recommendations( 14 ). The relative order of the weightings for the policies is largely in line with the strength and quantity of the evidence of effectiveness for improving population nutrition. In general, the policies with the highest weightings have relatively stronger evidence of effectiveness for improving population nutrition compared with the policies with the lowest weightings, for which evidence is weak, mixed or very limited (Supplemental File 1).
Furthermore, the weightings for the top two policies are roughly three times larger than for those policies which ranked lowest. This indicates that implementing the top policies such as taxing unhealthy foods and healthy food provision in schools will likely have a larger impact on improving population nutrition compared with weaker policies such as nutrient declarations on foods, menu board labelling or private-sector food policies.
The following sections discuss in more detail the top two policy recommendations which were weighted as having the highest relative contribution in terms of their effectiveness to improving population nutrition.
High tax on unhealthy foods
The evidence from the literature suggests that taxing unhealthy foods leads to reductions in consumption of the taxed foods or nutrients of concern( Reference Thow, Downs and Jan 22 – Reference Jensen, Smed and Aarup 26 ), which is supported by the aggregated expert-derived weightings in the present study. Experts stated that the evidence base was relatively strong for taxes on unhealthy foods and believed it was the best policy to limit the availability of unhealthy foods. There are currently a few robust evaluations( Reference Colchero, Popkin and Rivera 27 , Reference Falbe, Thompson and Becker 28 ) identified in the literature that assess the impact of ‘real-world’ unhealthy food taxes on improving population nutrition. The Mexican soda tax implemented in January 2014 showed a 12 % reduction in the consumption of taxed beverages over a one-year period( Reference Colchero, Popkin and Rivera 27 ), while the junk food tax in Mexico showed a 5 % reduction of consumption in the taxed foods( Reference Batis, Rivera and Popkin 29 ). Falbe et al.( Reference Falbe, Thompson and Becker 28 ) evaluated the implemented excise tax on sugary drinks in Berkeley, California, USA and found that there was a 21 % decrease in consumption of soda in lower-income neighbourhoods four months after implementation. In Denmark, although the tax on saturated fat has been repealed, it showed an impact on saturated fat intake of the population about one year after implementation( Reference Smed, Scarborough and Rayner 25 , Reference Jensen, Smed and Aarup 26 ). It is worth noting that sugary drink taxes are now moving towards a tipping point with more action and more evaluations and evidence becoming available( Reference Backholer, Blake and Vandevijvere 30 , Reference Backholer, Blake and Vandevijvere 31 ).
Provision of healthy foods in schools
Overall, the evidence suggests that there is an association between the implementation of state/national policies and (i) changes in the school food environment and (ii) shifts in the food consumption and purchasing behaviour of students in the expected direction (i.e. towards healthy foods)( Reference Chriqui, Pickel and Story 32 – Reference Driessen, Cameron and Thornton 35 ). Studies also showed that the availability of less healthy foods decreased after the implementation of policies( Reference Chriqui, Pickel and Story 32 – Reference Driessen, Cameron and Thornton 35 ). Evidence on the provision of free/subsidized fruits and vegetables and the intake of fruits and vegetables is, however, mixed( Reference de Sa and Lock 33 , Reference Delgado-Noguera, Tort and Martínez-Zapata 34 ). Many experts agreed that healthy school food policies are an important priority because of the evidence available, the potential to reach a wide range of population groups, and because a large percentage of children’s time is spent in school. Some experts mentioned that this policy intervention can establish norms for children around the acceptability of foods/drinks as food preferences and habits are developed in childhood.
Strengths and limitations
One of the major strengths of the current study is that it provides informative evidence from international experts on the policies that are likely the most important to improving the healthiness of food environments. Engaging experts to provide their opinion represents an important source of evidence, as current empirical evidence alone is not sufficient to determine relative contributions of different policy options to improve population nutrition. The study used the AHP method to derive weightings for each policy domain and their respective good practice policies, to produce a reliable ranking of the rated policies. Consistency of participants’ judgements was measured and only consistent judgements were used to produce valid results.
There are some recognized limitations that are inherent to the Delphi methodology relating to the internal and external validity of the findings. However, careful consideration was taken to limit selection bias by following strict criteria. The reliability of findings is uncertain, as a different set of responses may have resulted if all those invited to the study participated or a different group of experts was selected. Due to a slight change in methodology for rating in Round 2 mainly to make it less burdensome for experts, the confidence intervals for the aggregated weightings were higher in Round 2 than in Round 1. However, they were still within an acceptable range and the weightings and ranking of the different policies were similar in both rounds.
It is not certain if findings from the present study can be extrapolated to low- to middle-income countries as the majority of studies included in the evidence for the good practice policies were conducted in developed high-income countries. In addition, practical real-world relevance for low- to middle-income countries might not be congruent with the health and political context of those countries. Also, while policies can be thought ‘global’, local contexts of implementation are very diverse and may have a significant impact on policy effectiveness.
Recommendations for policy, practice and research
Recommended food environment policies do not all contribute equally to improving population nutrition, as shown in the present study, with some food policies such as taxation receiving a higher weighting from experts, relative to other recommended policies. The implementation of the Food-EPI tool in New Zealand and Thailand shows that the levels of implementation for top priority policies as derived from the present study (such as high taxation on unhealthy foods, healthy school food policies) are ‘very little if any’ or ‘low’( Reference Phulkerd, Vandevijvere and Lawrence 17 , Reference Vandevijvere, Dominick and Devi 18 ).
Weightings derived from the present study will help public health professionals and policy makers to prioritize strategies that have the highest potential to improve population nutrition. In addition, these study results will allow calculating a composite score for the Food-EPI, which aims to benchmark food environment policy implementation across countries globally. In the future, additional weightings could also be developed for other policy considerations, such as consumer rights, child rights and nutrition inequalities.
Conclusion
In conclusion, government action is essential to implement policies to create healthier food environments. The present study is the first known attempt at using the Delphi methodology and AHP method to derive weightings and achieve consensus among a group of international food policy experts regarding the relative contribution of implementing recommended good practice food policies to improving population nutrition. Prioritizing the implementation of recommended good practice food environment policies is important to focus public health efforts on the most effective strategies to improve population nutrition. The weightings for the policies can also be applied to generate the Food-EPI composite scores in different countries to facilitate benchmarking food environment policy implementation globally. Additional weightings for the impact of those policies on reducing inequalities and improving consumer and child rights could be developed in a future study.
Acknowledgements
Acknowledgements: The authors want to thank the experts who participated in the Delphi process. Financial support: This research received no specific grant from any funding agency in the public, commercial or not-for-profit sectors. Conflict of interest: S.V. is a Deputy Editor for the journal Public Health Nutrition. Authorship: S.V. and B.S. designed the study, R.M. collected the data, R.M. and C.D. analysed the data, R.M. and S.V. wrote the manuscript and all authors critically revised draft versions of the manuscript. Ethics of human subject participation: This study was approved by the Human Participants Ethical Committee of the University of Auckland.
Supplementary material
To view supplementary material for this article, please visit https://doi.org/10.1017/S1368980018001076


