


According to the WHO, Saudi Arabia ranks fourteenth among the most obese nations, with one in three and one in ten adults classed as obese and severely obese, respectively(Reference Al-Khaldi1,2) . A rapid cultural shift from traditional to more westernised dietary patterns is considered one of the main contributing factors to the rising rates of obesity in Saudi Arabia(Reference Alqarni3,Reference DeNicola, Aburizaiza and Siddique4) . This transition in the pattern of consumption is reflected in the rapid growth of western-style fast-food outlets and dining-out restaurants in Saudi Arabia(Reference Alfaris, Al-Tamimi and Al-Jobair5–Reference Nada7). In total, fast-food sales in 2010 in Saudi Arabia were valued at US$4 billion and was expected to double to an estimated US$7·9 billion by 2020(8). Money that is spent on fast-food and eating out in restaurants typically goes towards meals that are high in energy and saturated fat, and low in fibre, Ca, fruit and vegetables, which constitutes a dietary pattern that is associated with obesity(Reference Bowman and Vinyard9). In a study, Bhutani et al. estimated that every meal per week consumed from fast-food or dining-in restaurants was associated with an increase in BMI by 0·8 and 0·6 kg/m2, respectively(Reference Bhutani, Schoeller and Walsh10).
Obesity is currently a major public health concern in Saudi Arabia(Reference Kyrou, Randeva, Weickert, De Groot, Beck-Peccoz and Chrousos11), placing a high financial burden on the Saudi government, which covers healthcare costs for its nationals(12). Thus, the country’s National Transformation Program (2020), which serves as a roadmap to achieve the goals set out in Vision 2030, focuses on improving public health and integrating initiatives to reduce obesity(13). In August 2018, under this initiative, the Saudi Food and Drug Authority (SFDA) announced a new policy, which requires all restaurants, including dine-in restaurants, fast-food restaurants, cafes, ice cream shops, fresh fruit juice shops, bakeries, universities and government agencies, to clearly post energetic information in their menus by the end of December 2018(Reference Burton, Creyer and Kees14). The new policy requires all restaurants, regardless of the number of locations, to declare the energy on their menu, and nutrient values must be made available in the restaurant upon customer request. All restaurants should declare a statement that ‘children ages 4–13 require 1200 energy on average per day, and those over 13 years old require 2000 energy on average per day, and individual energetic needs differ from person to person’ in the main menu. This statement should be displayed clearly, placed on all pages of a paper menu, or at the front if the menu is paperless. The SFDA requirements for displaying energetic information are given in Box 1. The main purpose behind this policy is to educate the people of Saudi Arabia about the amount of energy and nutrient values (such as trans fats) of foods offered in restaurants(Reference Burton, Creyer and Kees14).
Box 1. SFDA requirements for displaying energetic information on restaurant menus (translated from Arabic by the authors)
General requirements
-
1. Energy must be displayed on all types of menus permanently in all restaurants, whether on a wooden board or an electronic screen, paper, brochures, flyers or any other form.
-
2. Energy should be displayed in a clear and upfront manner for each menu item, using a font size, type and colour consistent with the display of food item names and price.
-
3. Restaurants should display the energy of a single dish, for example, pizza pie – 1600 energy, and in the event that a dish is displayed in the form of individual units, like pizza slices, then it must give energy per unit (e.g. ‘pizza pie 200 energy per slice, 8 slices’).
-
4. The energy of each component of a multi-item dish should be shown in the main menu, so if a food plate has several components such as chicken wing, cheese slice and potato slice, it should express energy as follows: 80 energy per chicken wing/five chicken wings per dish; 170 energy per slice of cheese/five slices of cheese per dish; 280 energy per slice of potato/five potato slices per dish, including declaring energy for all kinds of added sauces.
-
5. Restaurants serving different ingredients of food must declare energy separately for all items (e.g. open-buffet ingredients or sandwiches consisting of different fillings) as the number of energy could vary depending on the customer’s choice of a number of ingredients per serving.
-
6. Energy must be declared separately for each method of preparation on the menu (e.g. grilled chicken, fried chicken or chicken with herbs).
-
7. Energy should be announced separately for all side orders on the menu (e.g. ice cream, soft drinks, fresh fruit juices, cakes, sauces), and energy should be announced as energy per unit of measure (cup, tablespoon, teaspoon) for each food item, such as one cup of soup contains 200 energy.
-
8. Energy must be announced separately for all side additions to the basic order on the menu, for example, nuts – 25 energy.
-
9. Restaurants should put the statement ‘children ages 4–13 require 1200 energy on average per day, and those over 13 years old require 2000 energy on average per day, and individual energetic needs differ from person to person’ on the main menu. This statement should be displayed clearly, placed on all pages of a paper menu, or at the front if the menu is paperless (e.g. on the menu, online or at the place where you order meals).
-
10. Restaurants must put the statement ‘additional nutritional information available on request’ on the menu, whether displayed on a wooden board or an electronic screen, paper, brochures, flyers or any other form. Additional nutritional data for each of the main menu items is:

-
11. The unit of measurement of energy in food must be energy, and the font size, type and colour should be consistent with the display of menu items.

Studies have consistently demonstrated that the public underestimate their energetic consumption(15). Therefore, raising awareness among consumers regarding the energetic content of foods consumed could promote better food choices, which would consequently assist in curbing the epidemic levels of obesity; this was one of the main aims of the policy(Reference Burton, Creyer and Kees14).
This menu energy-labelling policy is aligned with other policies and legislations implemented worldwide, such as in the USA, Canada and Europe, which require fast-food and dining-in restaurants to post energetic and other nutritional information on their menus(Reference Goodman, Vanderlee and White16–Reference Bleich and Pollack19). Surveys conducted in a number of different countries have reported broad public support for mandatory menu energy-labelling in restaurants(Reference Bleich and Pollack19,Reference Radwan, Faroukh and Obaid20) . However, whether restaurant owners and managers are in support of this policy is less certain. Understanding the viewpoint of restaurant owners towards mandatory energy-labelling will be important to ensure effective implementation of the policy, which requires integrated support from legislators, the public and restaurant owners. In a study involving 178 restaurant managers in the USA, researchers reported a positive inclination to reformulate menus and offer lower-energetic food items to participants who had knowledge and experience of the labelling policy. However, the majority remained sceptical regarding the impact of such a policy in improving public health(Reference Yeh, Platkin and Fishman21). Furthermore, whether the main goal of the menu energy-labelling policy (i.e. to reduce energetic intake and improve food choice) is effective remains debatable. Several western studies that evaluated the effectiveness of displaying nutritional information in restaurants on consumer food choice showed mixed results(Reference Roberto, Larsen and Agnew22–Reference Dumanovsky, Huang and Nonas26). As suggested by Kiszko et al., energy-labelling alone may not be sufficient to modify the behaviour of consumers, as it may be affected by the method in which the information is presented(Reference Kiszko, Martinez and Abrams27). Other marketing and non-marketing factors (e.g. taste, price, food preference and convenience) could also influence food choices(Reference Burton, Howlett and Tangari28).
As the menu energy-labelling policy in Saudi Arabia was newly implemented (August 2018), there has been no study conducted to date to evaluate the views of the public or restaurant owners towards it. This step is very important as the result of this survey will fill a gap in the current evidence and provide an important, early ‘snapshot’ of perceptions to mandatory energy-labelling in Saudi Arabia. This will be useful for policymakers to understand the response of Saudis towards the policy, which is currently unknown, and for local researchers interested in exploring the impact of the policy over time. It will also benefit international researchers interested in the effect of country-specific factors on policy implementation. Therefore, the aim of the present study was to evaluate the knowledge, views and observations of the public and restaurant owners towards the SFDA mandatory menu energy-labelling policy, and the influence of the policy on the public’s restaurant eating behaviour.
Methods
Study design
This is a cross-sectional study conducted between 24 February and 28 March 2019. The study was approved by the Unit of the Biomedical Ethics Research Committee at King Abdulaziz University (Jeddah, Saudi Arabia) (reference no. 115-19). Informed consent was obtained from all study participants.
Participants and recruitment
A convenience sample of 1228 adult participants aged between 18 and 80 years were included. Participants were asked to complete a publicly distributed electronic questionnaire created using Google form. The public electronic questionnaire was distributed via different social media platforms, such as Twitter and WhatsApp. For distribution via Twitter, a request was placed that the faculty’s Twitter accounts and public figures and influencers with a high number of followers in Saudi Arabia re-tweet the link to the questionnaire. WhatsApp was utilised to send the link to the questionnaire to the authors’ contacts (such as staff members of universities, friends, neighbours, companies, students and businesses), requesting them to forward it to all their contacts. In this study, a total of forty-one restaurant owners or managers were included and recruited via emails, phones and social media accounts (i.e. Twitter and WhatsApp) of restaurants to complete an electronic questionnaire created using Google form.
Sample size calculation
Since there have been no similar previous studies in Saudi Arabia to use as a reference to calculate the sample required to evaluate the knowledge, views or observations of Saudis towards the SFDA mandatory menu energy-labelling policy, we performed sample size calculation to estimate the frequency of responses based on Saudi adults numbering 14 289 649 (≥18 years old) as reported by the Saudi General Authority for Statistics in 2018. Therefore, the online Epi Info sample size calculator (Division of Health Informatics and Surveillance, and Centre for Surveillance, Epidemiology and Laboratory Services, GA, USA)(29) was used to calculate the required sample size by estimating that 50 % of target subjects would agree to participate in the study, with a confidence level of 99 %, margin error of 5 % and design effect of 1. Hence, the total calculated sample size was 1083 participants.
Study instruments
Public questionnaire
A public questionnaire was used to determine the knowledge, views and observations of the public regarding energetic requirements and the SFDA mandatory menu energy-labelling policy and to assess its influence on their dietary behaviour. The pubic questionnaire was adapted from Bleich and Pollack(Reference Bleich and Pollack19). The questionnaire was subsequently modified and translated from English to Arabic using the Brislin backtranslation method(Reference Brislin30,Reference Cha, Kim and Erlen31) . The modifications made to the Bleich and Pollack survey included: a) adding more questions about participant characteristics and their background of diet and weight issues; b) modifying the response options for energy requirement questions; c) removing a question about government responsibility due to differences in governmental policies; d) substituting ‘McDonalds’ or ‘Subway’ with the generic word ‘restaurants’; e) adding a section about the influence of the energy-labelling policy on eating behaviour. For review, the survey was shared with three PhD holders in nutrition. The survey was subsequently revised based on their responses. Briefly, changes made to the pilot survey included revising response options by grouping and rewording some questions. As a result of these modifications, the final questionnaire was composed of four main sections, totalling twenty-eight questions, and took approximately 15 min to complete. Information regarding the aim (to evaluate the views towards the mandatory menu energy-labelling policy in fast-food and dining-in restaurants), importance, confidentiality of collected data, ethical approval number/address, estimated time to fill out the questionnaire was provided at the beginning of the questionnaire.
The first section of the questionnaire included questions regarding the sociodemographic and background information of participants. The sociodemographic information included age, gender, marital status, level of education, work status, household income, field of study, geographic location, self-reported weight and height (used to calculate BMI) and relevant medical history. The background information of participants included their perceived overall quality of diet, weight perception, whether they had received information and advice regarding their daily energetic requirements, the source of that information and the frequency of restaurant visits. In the same section, participants were asked whether they favoured or opposed the new SFDA policy.
The second section was used to assess the knowledge of participants regarding the recommended daily energetic intake for moderately active men and women, as well as inactive adults. They were asked to select one of the following choices: ≤1500, 1500 to ≤2000, 2000 to ≤3500, or ≥3500 kcal. The original responses by Bleich and Pollack(Reference Bleich and Pollack19) (<1500, 1500 to <3000, 3000 to <4500, or ≥4500 energy) were changed. This was because Bleich and Pollack reported that the correct answer to the energetic knowledge questions fell within the same category for moderately active men and women and inactive adults, which may affect the expectation of the participants that the answer must change across groups, thus influencing their results. The correct recommended daily energetic intakes for moderately active men and women, as well as inactive adults (2000 to ≤3500, 1500 to ≤2000, and 1500 to ≤2000, respectively), are within the average of the 2015–20 Dietary Guidelines (2600, 2000, and 2000 kcal, respectively). Currently, there are no available data for Saudi or Middle East populations. Thus, the response categories for the questions were consistent with the US Department of Health and Human Services and the US Department of Agriculture 2015–2020 Dietary Guidelines for Americans.
In the third section, the views of participants towards the menu energy-labelling policy were tested. They were asked questions in the following two domains: (a) The perceived knowledge of participants on menu energy-labelling policy, effect of energetic knowledge on food selections, whether they support the energetic posting policy and their probability of eating in restaurants with energy-labelling. The question of probability of eating in restaurants with energy-labelling was considered in this section, even though the policy is mandatory for all restaurants, because the study was conducted shortly (approximately 2 months) after policy introduction and not all restaurants had fully implemented it. (2) The perception of participants towards menu energy-labelling policy, the influence of the policy on their dietary behaviour and food selections, their feelings towards selecting foods with higher energetic content and whether they would be more attentive to the price or energy posted on the menu.
In the last section, the menu observations of participants and the influence of the new menu energy-labelling policy on their behaviour were assessed. Questions in this section asked the participants whether they noticed any nutritional information the last time they visited a restaurant, if they understood it and whether it affected their food selections, quantities eaten and eating behaviour in restaurants.
Restaurant owner questionnaire
This questionnaire was used to explore the views and responses of restaurant owners towards the SFDA energy-labelling policy in restaurants in Saudi Arabia. Two faculty members with backgrounds in nutrition science drafted the survey questions. For review, the survey was shared with four PhD holders in nutrition to ensure that the survey questions were clear, comprehensive and aligned with the research question of exploring the views and responses of restaurant owners towards the policy, and to eliminate any questions relating to the operational systems’ perspective. The survey was subsequently revised based on their responses. Changes made to the pilot survey included: a) revising response options; b) grouping questions of similar concepts under one main section; c) adding questions regarding the influence of the new policy on restaurant owners’ business in general; and d) asking if they had already changed their preparation methods to reduce energy. The questionnaire was composed of fourteen questions and took approximately 5 min to complete.
Restaurant characteristics (i.e. name of the restaurant, number of branches, restaurant type and location of the main office) were collected. Questions in this questionnaire tested the awareness of the new menu energy-labelling policy among restaurant owners, whether they supported or opposed the policy, the way they calculated the energy, whether they faced difficulties in calculating the energy, the influence of the policy on their business and whether the policy influenced the food selection of consumers.
In addition, questions included in this section assessed whether the calculated energy in restaurant meals matched the expectations of the owners, the influence of the new policy on their business in general, whether the sale of higher-energetic food had decreased and whether the sale of lower-energetic meals had increased following the introduction of the policy. Lastly, whether the owners had considered making changes to meal preparation, or if they had already changed their preparation methods to reduce the energy, was also investigated.
Statistical analysis
Data were analysed using the SPSS software (version 23.0; IBM Corp.). Data were described using frequency statistics. To test the differences between two variables, a χ 2 test of independence was used with a P-value <0·05 denoting statistical significance. Bonferroni correction was used due to multiple comparisons.
Results
Characteristics of participants in the public study
Table 1 shows the general characteristics of study participants. The most frequently reported characteristics of study participants were: age between 25 and 39 years (54 %), female (60 %), married (58 %), educated to bachelor’s degree (71 %), employed (52 %), approximately evenly drawn from across the income and field-of-study categories, from the west region (72 %), with 35 % of respondents reported normal weight and 34 % overweight.
Table 1 Characteristics and backgrounds of participants (n 1228)*

SR, Saudi Riyal.
* Data presented as numbers and percentages.
† Employee/student.
‡ Self-reported weight and height used to calculate BMI. BMI categories were defined as follows: healthy weight (BMI, 18·5–24·9 kg/m2), overweight (25·0–29·9 kg/m2) and obese (≥30 kg/m2).
§ Includes hypertension, hypercholesterolaemia and hypertriglyceridaemia.
In terms of the backgrounds of participants, 60 % reported they had poor-to-fair diet, whereas the remaining 40 % thought they had a good-to-excellent diet. In terms of weight perception, the majority of participants (64 %) reported being overweight, 27 % thought their weight was normal, and only 9 % thought they were underweight. Approximately three-quarters of participants (73 %) considered they had adequate knowledge regarding energetic information, and most of them (59 %) reported they were obtaining information from specialists. In addition, social media, including Instagram (33 %), Twitter (31 %), Snapchat (28 %) and Facebook (4 %) constituted a significant source of information, particularly when considered as a combined group. All the respondents reported visiting restaurants at least once a week, and the vast majority (90 %) had positive views towards the new policy (Table 1).
Knowledge of daily energetic requirements
At least half the participants were able to identify the correct energetic intake for moderately active men (51 %) and women (69 %). However, only 36 % of participants reported the correct energy requirements for inactive adults. The estimation of correct daily energy requirements for moderately active men and women differed significantly according to age, gender, education level and field of study of the participants (P < 0·05). The correct estimation of energy requirements for inactive adults differed significantly according to gender and field of study (P < 0·05).
Views towards the menu energy-labelling policy
Perceived knowledge towards the menu energy-labelling policy
Table 2 shows the self-perceived energetic knowledge of participants towards the new energy-labelling policy in restaurants. Approximately 40 % of participants reported sufficient knowledge regarding the daily energetic requirements to make healthy choices, while 42 % felt they did not. Age, gender, level of education and field of study are significant variables associated with the perceived ability to apply their knowledge when selecting food items (P < 0·05). More than half the participants (55 %) reported that menu-labelling is very useful. Gender, education level, work status, field of study and BMI are all significant variables in the perceived usefulness of menu energy-labelling (P < 0·05). Half the participants (51 %) reported they would be less likely to eat at restaurants that showed energy, with only 22 % of them being more likely to choose a energy-labelling restaurant. Age, marital status and BMI are significant variables associated with the likelihood (perceived by participants) of eating at restaurants with energetic information on the menu (P < 0·05).
Table 2 Participants’ self-perceived knowledge and views on the usefulness of the menu energy-labelling policy (n 1228)*
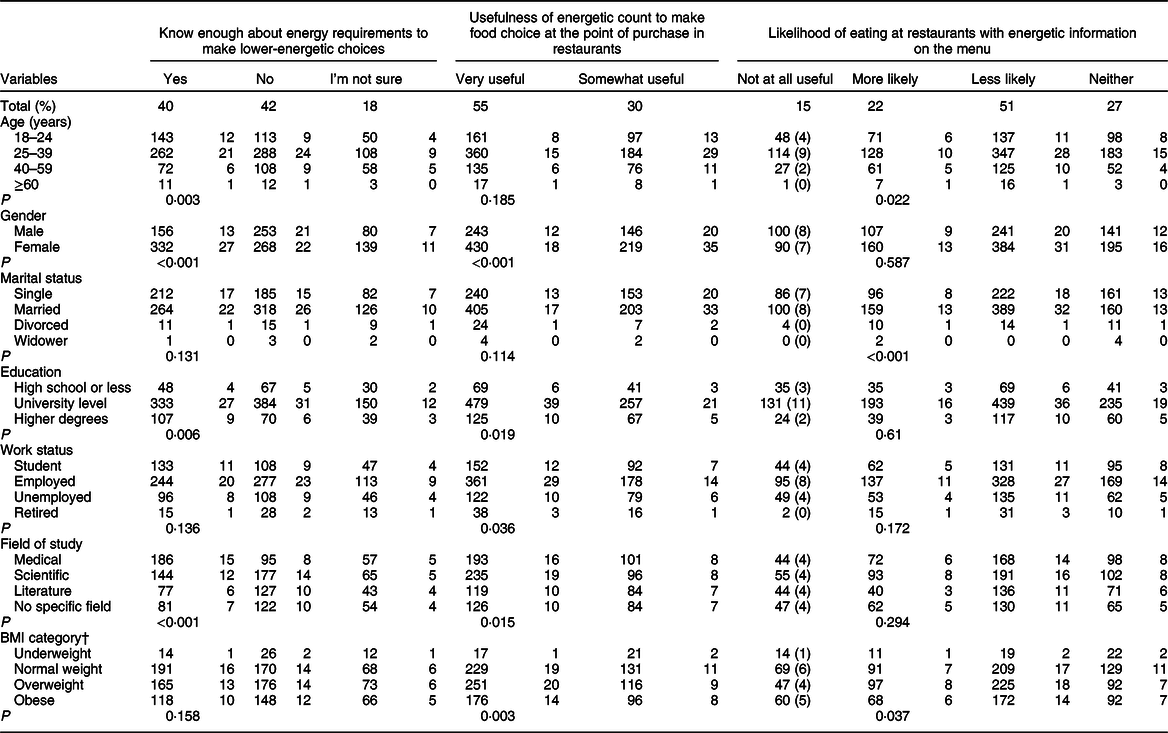
* Data presented as number and percentage.
† Self-reported weight and height used to calculate BMI. BMI categories were defined as follows: healthy weight (BMI, 18·5–24·9 kg/m2), overweight (25–29·9 kg/m2) and obese (≥30 kg/m2); P-values for χ 2 tests were calculated among age, gender, education, work status, income, specialisation and BMI.
Perception towards the menu energy-labelling policy
Table 3 shows the perceptions of participants towards menu-labelling. The majority of participants (76 %) reported that posting energetic information in menus would make them select foods with lower energetic content. Gender, marital status and BMI are significant variables associated with the influence of menu energy-labelling on food selections (P < 0·05). Approximately 80 % of participants reported they felt guilty after selecting a high-energetic food. Age, gender, marital status, work status and BMI are significant variables associated with feeling guilty (P < 0·05). More than half the participants (56 %) reported that menu-labelling made them pay attention to the energetic content of the food over the price. Gender, work status, income, field of study and BMI are significant variables in which information is more noteworthy (P < 0·05).
Table 3 Participants’ perceptions towards the menu energy-labelling policy (n 1228)*
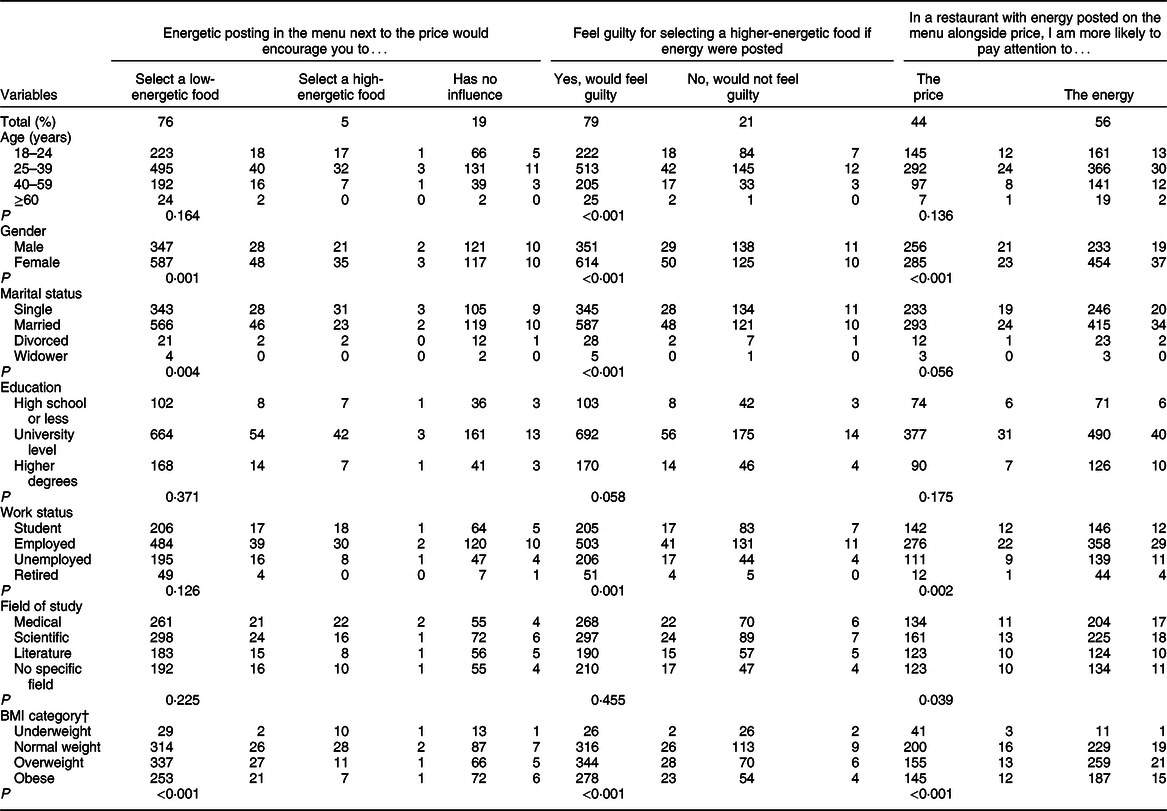
* Data presented as numbers and percentages.
† Self-reported weight and height used to calculate BMI. BMI categories were defined as follows: healthy weight (BMI, 18·5–24·9 kg/m2), overweight (25·0–29·9 kg/m2) and obese (≥30 kg/m2); P-values for χ 2 tests were calculated among age, gender, education, work status, income, specialisation and BMI.
Observations and influence of the menu energy-labelling policy
Approximately 60 % of participants reported they had noticed energy-labelling in the restaurant at their recent visit, with half (56 %) observing the labelling information on the menu, 28 % on the display screen, 9 % on the meal, 3 % on the wall and 3 % at another location. Among those who had observed energy-labelling, 78 % reported they understood the labelling information, and 60 % reported that it had affected their order. In terms of the influence of providing energetic information, 62 % of participants reported making changes to eating behaviour or food selection as a result of menu-labelling. These behaviour changes included 20 % of participants changing their orders, 14 % eating a smaller portion of the ordered food, 4 % changing restaurants and 24 % reducing the frequency of eating in restaurants (Figure 1). Age (P = 0·01), work status (P = 0·001), field of study (P = 0·03) and BMI (P < 0·001) are significant variables associated with the influence of menu-labelling.
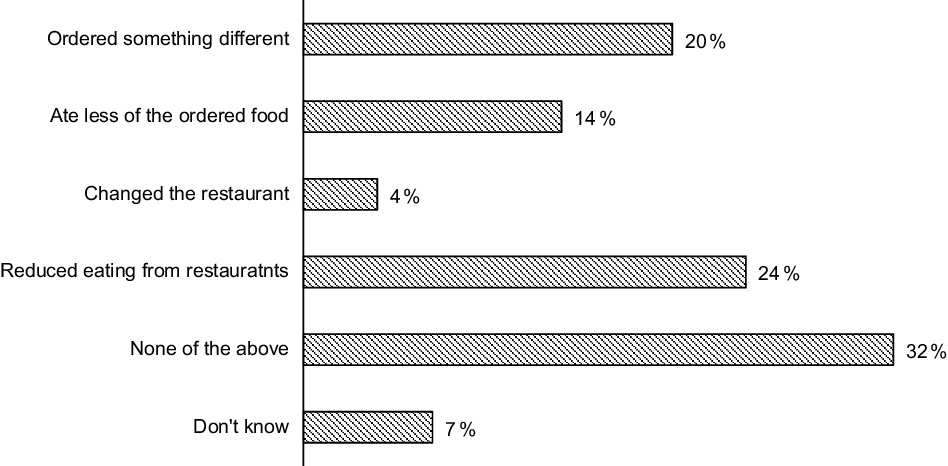
Fig. 1 Influence on participants’ eating behaviour and food selection: Have you done any of the following because of menu-labelling? (n 1228)
Characteristics and responses of restaurant owners
Most of the restaurants (85 %) that participated were local, while the remaining (15 %) were international chains, with a mean of 3 (sd 2) branches. Approximately half of restaurant owners (46 %) responded they knew the reason for implementing the new menu energy-labelling policy, while the rest either did not know (17 %) or were not sure (37 %). The majority (56 %) were supportive of the policy or neutral (17 %), with only 22 % in opposition. In terms of the source of energetic calculations, a quarter (25 %) of restaurants used a manual calculation, 22 % contacted registered dietitians and 22 % used the SFDA application. Only 20 % (n 8) of restaurants reported they were not calculating the energetic content of their meals.
Approximately three-quarters (73 %) of restaurant owners did not report any problems in calculating or displaying energetic information. Approximately half of restaurants (54 %) were surprised by the amount of energy found in their meals. However, only 19 % observed a decline in sales of all foods following the introduction of the new menu energy-labelling policy. A greater decline was reported more specifically in the sales of high-energetic meals (37 % reported a reduction), with a corresponding increase in the sales of low-energetic meals (44 %). Regarding their future plans, 41 % were not considering any modification to reduce the energetic content of meals, 27 % were considering such a modification and only 2 % (n 1) had already changed their meal preparation process.
Discussion
This is the first study in Saudi Arabia to evaluate the response of the public and restaurant owners towards the mandatory menu energy-labelling policy (introduced in August 2018) in restaurants in Saudi Arabia. Evaluating the views of Saudis towards this new policy at the time of implementation will provide important initial responses to assess its influence on the energetic knowledge, intake and food choices of consumers over time.
Although the majority of participants (73 %) perceived they had sufficient energetic information, in fact only half of those were able to correctly estimate the daily energy requirement for moderately active men, and only a third correctly estimated it for inactive adults. Similar results were reported by Bleich and Pollack and Radwan et al., who found that Americans(Reference Bleich and Pollack19) and Emiratis(Reference Radwan, Faroukh and Obaid20) were able to estimate the daily energy requirements for moderately active men and women; however, the daily energy requirements of inactive adults were underestimated. Specifically, the results of our study found that females, middle-aged participants, those with a higher level of education and those in the medical/science fields were better at estimating the energy requirements for moderately active men and women. This confirms the necessity for further nutritional education of the Saudi population targeting males, older adults and those with poor educational or non-medical background.
Collectively, most Saudis in this study welcomed the menu energy-labelling policy in restaurants and believed that such energetic information would encourage them to select lower-energetic food items. These perceptions were most prominent among female participants, with some associations also observed towards those who were highly educated, employed and normal- to overweight, as well as those with a medical/scientific background. Remarkably, despite the strong support shown to the menu energy-labelling policy by the participants, the majority also declared they would be less likely to eat in a restaurant with energetic information. This opinion was particularly prominent among younger adults (25–39 years) and overweight participants. This may be attributed to the fact that most young adult participants and those with a higher BMI are more likely to eat away from home compared with others(Reference Bhutani, Schoeller and Walsh10,Reference Paddock, Warde and Whillans32) . The high frequency of restaurant visits in most instances is to satisfy the feeling of hunger without any dietary restrictions, which may interrupt the eating pleasure and satisfaction of an individual(Reference Yamamoto, Yamamoto and Yamamoto33). Participants were questioned about their likelihood to eat in restaurants that display energetic information because even though the policy is mandatory for all restaurants, when the study was conducted (2 months after the policy came into effect), not all restaurants had fully implemented it. The majority of restaurants in all cities in Saudi Arabia adhered to the law, but some restaurants, particularly those that are independent or part of a smaller chain, are still in the process of applying the law. As the policy becomes fully implemented nationally, individuals in Saudi Arabia will shortly not have the option to eat in a restaurant without energetic information.
Moreover, participants reported they would feel guilty for selecting a higher-energetic food. This could deter them from visiting a restaurant displaying energetic information, because they perceive it might reduce their pleasure and satisfaction. Further research is warranted to address the reasons behind these observations. Over three-quarters of participants disclosed they would be influenced by energetic information, such that they would feel guilty about choosing a higher-energetic food and be encouraged to select a lower-energetic food. Consistent with previously published studies, this attitude was particularly noted among female, married and overweight participants(Reference Bleich and Pollack19,Reference Deb and Vargas34) . Indeed, 62 % of participants declared that menu energy-labelling had already resulted in behaviour changes. The most popular of these changes was a reduction in the frequency of eating out, as well as modifying food choices when ordering in restaurants with menu energy-labelling. Age, field of study and BMI are significant variables associated with the influence of menu-labelling. The high influence observed in the current study could be due to that 54 % of study participants were younger adults (25–39 years) and 60 % were females. A study by Roseman et al. has reported that menu-labelling had a significant impact on Generation Y with a much greater effect on females than males(Reference Roseman, Joung and Choi35). Younger adults are more health-conscious and could feel conflicted about eating out for this reason, but are also more likely to want nutrition information on restaurant menus compared with other generations(Reference Roseman, Joung and Choi35). In addition, 59 % of participants were educated with either a medical or scientific specialisation, with 73 % of them reporting they had previously received information about energy. This could contribute to a higher influence of the policy among our study participants. Previous studies have indicated that nutrition information positively influenced the attitudes of US customers towards healthy food choice and lower-energetic foods(Reference Hwang and Lorenzen36,Reference Hwang and Lin37) . Some previous studies have also reported that consumers’ subjective knowledge has a significant impact on their decision-making and behaviour and could be considered as their ‘confidence level’ about their nutrition knowledge(Reference Roseman, Joung and Choi35). In the current study, 60 % of participants were either overweight or obese using BMI values calculated from self-reported height and weight measurements. This could also contribute to the high influence of menu-labelling on reported consumer eating behaviours. A study by Reale and Flint (2016) has shown that obese subjects had a strong intention to eat healthily as they were motivated to lose weight than health concerns(Reference Reale and Flint38). Overall, these results show the potential influence of nutritional information on menus towards food choice behaviours, particularly for overweight subjects, in helping them reduce energetic intake.
Healthier foods have been linked to increased costs compared to unhealthy foods, and this may limit the ability of individuals to make better food choices(Reference Jones, Conklin and Suhrcke39). However, the perception of Saudis towards food prices is not well understood. In this study, males, employed participants, those with a normal weight and those with a monthly income <2000 SR were more likely to pay attention to the price than energetic information. On the other hand, the majority of participants reported they would pay more attention to energetic information, and this was mostly observed in female, married, employed and overweight individuals as well as those with scientific/medical background.
Overall, the data suggest that, at this current time of policy implementation, a majority of the Saudi population (e.g. females, married, educated, etc.) are more attentive to energetic information provided on menus, and are more inclined to using this information for modifying their food choices. However, variations in the responses of Saudis regarding the influence of the new policy on their eating behaviour and food selection suggest that awareness and understanding of energetic information remains an issue among numerous Saudi nationals, particularly males, older adults, poorly educated and those lacking a medical/scientific background. Energetic information if presented in different ways such as using traffic light labelling, physical activity equivalents, healthy logos and colour coding could enhance the effectiveness of the new policy towards better food selection(Reference Kiszko, Martinez and Abrams27).
The results of the questionnaire targeting restaurant managers revealed that the majority had a positive view towards the mandatory menu energy-labelling policy (56 %). Approximately half of the responding restaurant managers were aware of the reasons for implementing the policy. Among them, two-thirds either supported or felt neutral towards the mandatory menu energy-labelling policy. The majority (80 %) of restaurant owners reported they had implemented the energy-labelling policy using a variety of sources for energy estimation (i.e. manual calculation, registered dietitians or SFDA application). Eight out of the forty-one restaurants reported non-disclosure of energetic information in their menu. Although the reasons for this non-compliance are not known, three-quarters of the restaurants reported they faced difficulties in calculating and displaying energy. Therefore, further research is warranted to identify the barriers experienced by restaurateurs when introducing menu energy-labelling in order to improve the implementation of this policy.
With regard to the effect of the mandatory menu energy-labelling policy on sales, 44 % of restaurant owners reported that sales of low-energetic meals increased, while 37 % of restaurant owners reported that sales of high-energetic meals decreased. Despite these noticeable effects on sales, restaurant managers did not show a strong intention to reduce the energetic content of their menu items. Only 27 % disclosed they would be modifying the way their meals are prepared to reduce energy. Notably, only one restaurant had already implemented modifications to reduce energy. Therefore, the increase in the sales of low-energetic meals is not currently aligned with the reluctance of restaurant owners to modify menu items towards reducing energetic content. Moreover, the positive perceptions of customers about the policy – that most of them would select lower-energetic foods and would feel guilty after selecting a high-energetic food – are not aligned with the restaurant owners’ opinion and intention to modify their menu items to reduce energetic content. Overall, the results of this study suggest that there may be practical barriers, rather than attitudinal resistance, to a successful implementation of the policy by restaurateurs. To overcome this disconnect between customers and restaurant owners, as well as the policy-maker, there is a need to discuss the importance of cooperation and the need for careful policy formulation for a better implantation of this policy. Further studies are warranted to explore this issue and fully support all restaurants in applying the policy. To our knowledge, this study is the first to assess the response of the public and restaurant owners to the mandatory menu energy-labelling policy implemented in restaurants in Saudi Arabia since August 2018. The preliminary view of restaurant managers provides additional support that they are willing to support the policy; however, there needs to be more focus on understanding the difficulties faced by restaurants.
This study has several limitations. Firstly, this cross-sectional analysis only allows associations between variables to be addressed, but cannot demonstrate causality. Secondly, the use of convenience sampling and Twitter and WhatsApp to distribute the electronic questionnaire could limit the study’s generalisability and introduce some slight bias as the sociodemographic data of our study might not reflect the proportional structure of the whole Saudi population. However, convenience sampling is the most time- and cost-effective method to gather responses from a large demographic population(Reference Jager, Putnick and Bornstein40). We believe the data gathered by this study using social media platforms offer a valuable ‘snapshot’ of perceptions to mandatory energy-labelling at the early stage of policy implementation. Therefore, we recommend that government-funded research centres in Saudi Arabia could conduct national surveys on the mandatory menu energy-labelling policy, taking into consideration the use of probability sampling with a view to generalise their findings. Third, BMI was calculated using self-reported weight and height, which may have led to an underestimation of the levels of obesity. Fourth, there are currently no Saudi guidelines providing recommendations for daily energetic intake; therefore, the American guidelines were used. Moreover, perception questions did not measure whether individuals actually selected lower-energetic options. Nevertheless, the descriptive results of this study are the first step towards exploring the views of the public towards this policy. The low response rate of restaurant owners resulted in a small sample size, implying that the data might suffer from selection bias; those who chose to respond may have stronger feelings in favour of or against menu-labelling than most non-participating restaurant owners. In addition, no energetic range to define ‘high’ and ‘low’ energetic meals was provided in the questionnaire; therefore, questions regarding the categorisation of such meals were subject to individual interpretation. Future studies need to ensure they clearly define the ‘energetic range’ within the questionnaire. However, the findings of this study could inform further explorations about the views and responses of restaurant owners towards this policy in order to successfully implement the policy. In addition, although the questionnaire was reviewed by an expert, its validity and reliability were not assessed. Future studies may be necessary to establish the validity and reliability of the questionnaire.
Conclusions
There is a high frequency of eating out at restaurants and a high level of obesity in Saudi Arabia. Mandating energy-labelling in restaurant menus may be a useful tool for promoting balanced energy intake and encouraging healthier food selection. This is particularly important among individuals who are at a higher risk of obesity, as we move towards the country’s vision of significantly reducing obesity by 2030. Further studies are warranted to evaluate the most effective ways of displaying energetic information on menus, considering the sociodemographic characteristics of the population.
Acknowledgements
Acknowledgements: We would like to thank all our participants for their time and contribution to this study. Financial support: This research received no external funding. Conflict of interest: The authors declare no conflicts of interest. Authorship: Conceptualisation: A.A.A., D.S.T. and S.E.A.; methodology: A.A.A., D.S.T., S.E.A., M.M.A. and R.K.N.; data collection: A.A.A., D.S.T., S.E.A. and M.M.A.; data entry and analysis: A.A.A., D.S.T., S.E.A. and R.K.N.; writing – original draft preparation: A.A.A., D.S.T., S.E.A. and R.K.N.; writing – review and editing: A.A.A., M.M.A. and R.K.N.; supervision: A.A.A., M.M.A. and R.K.N.; project administration: A.A.A. All authors approved the final version of the manuscript. Ethics of human subject participation: This study was conducted according to the guidelines laid down in the Declaration of Helsinki, and all procedures involving study participants were approved by the Unit of the Biomedical Ethics Research Committee at King Abdulaziz University (Jeddah, Saudi Arabia) (reference no. 115-19). A digital written informed consent was obtained from all subjects.


