


Cardiovascular risk factors in childhood and adolescence are related to disease risk in adults( Reference Morrison and Glueck 1 , Reference Hayman, Williams and Daniels 2 ). Thus, a better understanding of risk factor(s) relationships and disease pathogenesis in youth may aid in prevention and early treatment( Reference Morrison and Glueck 1 , Reference Hayman, Williams and Daniels 2 ). Observational studies and some randomized trials suggest that homocysteine (tHcy) is a continuous, independent and modifiable risk factor of CVD, especially stroke( Reference Ridker, Manson and Buring 3 – Reference Retterstol, Paus and Bohn 7 ). Elevation of tHcy as a result of dietary, genetic, metabolic and hormonal factors( Reference McCully 8 ) may result in vascular wall damage( Reference Berwanger, Jeremy and Stansby 9 , Reference Selhub and D'Angelo 10 ), smooth muscle and connective tissue proliferation( Reference Berwanger, Jeremy and Stansby 9 , Reference Selhub and D'Angelo 10 ), procoagulant activity( Reference Berwanger, Jeremy and Stansby 9 , Reference Selhub and D'Angelo 10 ), inflammatory response( Reference Mansoor, Seljeflot and Arnesen 11 ) and oxidative stress( Reference Loscalzo 12 ).
An intermediate in methionine metabolism, tHcy is metabolized via a vitamin B6-dependent conversion to cysteine or a folate- and vitamin B12-dependent remethylation to methionine( Reference Selhub and Miller 13 ). Serum folate, vitamin B6 and vitamin B12 concentrations are inversely associated with serum tHcy concentrations( Reference Hoey, McNulty and Askin 14 , Reference Shimakawa, Nieto and Malinow 15 ), and dietary supplementation of these vitamins reduces tHcy concentrations( Reference Hoey, McNulty and Askin 14 , 16 ). In particular, folate appears to be the most important dietary determinant of tHcy concentration( Reference Boushey, Bresford and Omenn 17 , Reference Brattstrom 18 ) and a high intake of dietary folate/folic acid has been associated with lower concentrations of tHcy in adults, independent of other dietary or lifestyle factors( Reference Rasmussen, Ovesen and Bulow 19 – Reference Clarke and Armitage 22 ). Furthermore, high blood concentration of folate or intake of folate/folic acid has also been associated with a reduced risk of CVD and stroke in some studies( Reference Voutilainen, Virtanen and Rissanen 23 ).
The US Food and Drug Administration mandated that cereal-grain products be fortified with 140 μg folic acid/100 g grain by 1 January 1998( 24 ), providing a unique opportunity to examine the effect of folic acid fortification on tHcy concentrations in the general population. Numerous studies in adults have demonstrated that folic acid fortification resulted in increased folate intake, significantly improved serum folate concentrations and decreased circulating tHcy concentrations( Reference Hoey, McNulty and Askin 14 , 16 , Reference Jacques, Rosenberg and Rogers 25 ). In contrast, few studies have investigated the effects of folic acid fortification of food in children and adolescents( Reference Pfeiffer, Osterloh and Kennedy-Stephenson 26 ). To date, most studies examining serum tHcy and folate concentrations in children and adolescents have been cross-sectional, based on data collected pre-fortification( Reference Must, Jacques and Rogers 27 ) or post-fortification( Reference Ganji and Kafai 28 ), and compared to reference values. Among an ethnically diverse cohort of youth from the Child and Adolescent Trial for Cardiovascular Health (CATCH)( Reference Luepker, Perry and McKinlay 29 , Reference Osganian, Stampfer and Spiegelman 30 ), we therefore examined changes in serum tHcy and folate concentrations pre- and post-folic acid fortification and associations with demographic, behavioural and physiological factors.
Methods
Overview of the study
The subjects for the present analysis were part of CATCH, a trial designed to evaluate the effectiveness of a multi-component school-based cardiovascular health promotion intervention, described elsewhere in detail( Reference Luepker, Perry and McKinlay 29 , Reference Osganian, Stampfer and Spiegelman 30 ). The main trial (1991–1994) was conducted among students in grades 3 to 5 attending ninety-six public elementary schools (fifty-six intervention and forty control schools) in California, Louisiana, Minnesota and Texas. Following the main trial, two observational studies were conducted that measured physiological and behavioural risk factors in study participants from grades 6 to 8 (1994–1997; pre-fortification) and in grade 12 (2000–2001; post-fortification)( Reference Osganian, Stampfer and Spiegelman 30 ). The current report is based on analysis of data collected during the grade 8 and grade 12 follow-up assessments.
Study population
The CATCH study initially recruited 5106 grade 3 students to participate in a risk factor screening at baseline. Of these, 3645 (71 %) participated in risk factor screening at the end of grade 8 when serum tHcy, folate, vitamin B6 and vitamin B12 were first assessed and 2909 (57 %) students participated in the follow-up risk factor screening in grade 12. Of these students, 2445 attended both grade 8 and grade 12 examinations and provided blood at both examinations. This group constituted the study population for the present report. Students were recruited through schools or direct mailing to their homes. Parental consent was obtained for those under 18 years of age. Written informed consent was obtained from all participants and their parents, respectively. Institutional Review Boards at all four study sites and the coordinating centre at the New England Research Institutes approved the study.
Data collection
To ensure comparability, data collection methods( Reference Luepker, Perry and McKinlay 29 , Reference Osganian, Stampfer and Spiegelman 30 ) were similar across all time points and during the initial trial. Information on family history of risk factors for CVD and smoking was collected by student completed questionnaires. Dietary history including information on dietary folate intake and dietary supplement use was assessed at grade 12 only using a 149-item self-administered FFQ, the Youth/Adolescent Questionnaire (YAQ)( Reference Rockett, Breitenbach and Frazier 31 ), validated for use with children and adolescents aged 9 to 18 years. Examinations were conducted primarily in schools and to a lesser extent in other central community settings and participants’ homes (in mobile vans). These examinations were conducted by trained and certified CATCH study staff at the sites. BMI was calculated as weight in kilograms divided by the square of height in metres.
Non-fasting blood samples were collected from each student enrolled in the study as reported elsewhere( Reference Osganian, Stampfer and Spiegelman 30 ). Briefly, blood was collected via venepuncture in red-top serum separator tubes and allowed to clot for exactly 20 min at room temperature, then placed directly on crushed ice until centrifugation. All samples were centrifuged 3–4 h later at the study centres and serum was placed in 5 cm3 labelled Nalgene Cryule Vials (Nalgene Co., Rochester, NY, USA) and refrigerated until shipment for processing at the Central Laboratory at Miriam Hospital (Providence, RI, USA). Total serum tHcy was measured using the fluorimeteric method of Vester and Rasmussen, except that 20 % methanol by vol. was used in buffer B in the HPLC procedure( Reference Vester and Rasmussen 32 ). Serum folate and vitamin B12 were measured using a solid-phase, no-boil RIA in a commercial kit (Diagnostic Productions Corp., Los Angeles, CA, USA)( Reference McNeely 33 , Reference El Shami and Durham 34 ). Serum vitamin B6 was measured using a radioassay kit (ALPCO, Windham, NH, USA) that measures the conversion of titrated tyrosine to tyramine by the vitamin B6-dependent enzyme tyrosine decarboxylase( Reference Shin, Rasshofer and Friedrich 35 ). The same laboratory methods and assays were used at both time points.
Statistical analysis
Demographic characteristics and physiological measures in the study sample were summarized pre-fortification (grade 8) and post-fortification (grade 12) by percentages, means and standard deviations as appropriate.
Serum tHcy and folate concentration changes between grade 8 and grade 12 were compared according to sex, race, smoking status and multivitamin use. These comparisons were made first without adjustment or statistical testing (means and their standard errors tabulated at grade 8 and grade 12), then by mixed-effects regression analyses. The regression models used change from grade 8 to grade 12 concentrations as the dependent variable. For serum tHcy, each model was adjusted for design factors (CATCH site, school, intervention group); for covariates (sex, race, age at grade 8, smoking status and multivitamin supplement use at grade 12); for changes (between grade 8 and grade 12) in cardiovascular risk factors (BMI and systolic blood pressure); and for changes (between grade 8 and grade 12) in serum folate, vitamin B6 and vitamin B12. For serum folate, each model was adjusted for design factors (CATCH site, school, intervention group); for covariates (sex, race, age at grade 8, smoking status and multivitamin supplement use at grade 12); for changes (between grade 8 and grade 12) in BMI; and for grade 12 intakes of dietary folate. These analyses were also conducted on a subset of the cohort that excluded multivitamin and folic acid supplement users. We obtained comparable results using log-transformed and untransformed values and therefore report the latter.
We modelled the inverse relationship between serum tHcy and folate concentrations as a two-segment linear relationship( Reference Osganian, Stampfer and Spiegelman 30 ), with both variables log-transformed to reduce the influence of extreme values. We used non-linear regression analysis to determine the segment slopes and their junction point separately at grade 8 and grade 12 measurements. Neither segment showed a significant change in slope between the two measurements (P > 0·05). The change in the folate–tHcy relationship was therefore modelled as a simple translation of the junction point. Age trends in tHcy and folate concentrations were estimated by performing the linear regression of log concentrations v. age. Neither trend showed a significant change in slope between the two measurements (P > 0·05). The grade 8 and grade 12 trends were therefore modelled as parallel, with separate intercepts allowing us to detect any discrete increase or decrease in tHcy and folate concentrations following fortification. These analyses were restricted to non-users of multivitamin and folic acid supplements and were stratified by sex.
All tests were conducted with type I error set at 0·05 for each pairing of dependent and independent variables. The SAS statistical software package version 9·1 was used for all computations.
Results
The mean age of participants was 14·1 years (range: 10·9 to 16·8 years) at grade 8 (pre-fortification) and 18·2 years (range: 15·2 to 20·7 years) at grade 12 (post-fortification) assessments (Table 1). Males and females were equally represented at both time points. Respondents were more likely to be female or of white race compared with non-respondents (50·5 % female v. 46·1 % female, P = 0·0015 or 74·4 % white v. 64·2 % white, P < 0·001, respectively). However, there was no significant difference in the distribution of respondents’ and non-respondents’ original school intervention condition. The proportion of respondents who reported smoking cigarettes increased from 12 % to 27 % from grade 8 to grade 12, and the proportion who reported taking a multivitamin remained the same at approximately 23 % of the sample. Average serum concentrations of tHcy, folate and vitamin B6 increased (by 17 %, 16 % and 14 %, respectively) while serum concentrations of vitamin B12 decreased (by 11 %). When calculating folate intakes of students at grade 12, using the nutrient database values with and without fortification, fortification with folic acid provided, on average, an additional 118 μg folate/d, for a total mean folate intake of 359 μg/d. We observed similar findings among the sub-cohort that was restricted to non-users of multivitamins or folic acid supplements.
Table 1 Characteristics of the CATCH (Child and Adolescent Trial for Cardiovascular Health) cohort; 2445 students examined at both grade 8 (1996–1997) and grade 12 (2000–2001)

*Non-users of multivitamins or folic acid supplements, n 1530.
†Not determined at grade 8.
Average serum tHcy concentrations increased from 5·28 μmol/l in grade 8 to 6·19 μmol/l in grade 12 (Table 2). After adjusting for demographic, physiological and behavioural variables, and changes in serum folate, vitamin B6 and vitamin B12, the increase in serum tHcy was significantly greater among males compared with females (1·24 μmol/l v. 0·59 μmol/l, respectively; P < 0·0001). Similarly, the increase in serum tHcy was significantly greater among whites compared with blacks (1·01 μmol/l v. 0·43 μmol/l, respectively; P = 0·0008). Change in BMI showed a small but significant inverse relationship with change in tHcy concentration (0·05 μmol/l decrease in tHcy per 1 kg/m2 increase in BMI, P = 0·006). Change in serum folate concentration was strongly and inversely associated with change in serum tHcy concentration (an average decrease of 0·72 μmol/l in tHcy for every 50 nmol/l increase in serum folate, P < 0·0001). Changes in systolic blood pressure, serum vitamin B12 and B6 were not significantly associated with change in serum tHcy concentrations. These results were not substantially different when analyses were restricted to those who did not use multivitamins or folic acid supplements.
Table 2 Serum homocysteine concentration in the CATCH (Child and Adolescent Trial for Cardiovascular Health) cohort before and after folate fortification
*From mixed-effects regression analysis, adjusting for age, sex, race, CATCH site, intervention group, random variation among schools, multivitamin supplement use and smoking in grade 12, and changes between grade 8 and 12 in BMI, systolic blood pressure and serum concentrations of folate, vitamin B6 and vitamin B12. P tests for non-zero difference in mean serum homocysteine change between indicated subgroup and reference subgroup, or for non-zero change in serum homocysteine per indicated change in predictor.
†Unadjusted.
‡Reference group.
Serum folate concentrations increased from 42·6 nmol/l in grade 8 to 49·3 nmol/l in grade 12 (Table 3). In analyses simultaneously adjusted for age, sex, race, current smoking, current multivitamin use and change in BMI, females, current non-smokers and multivitamin users had significantly greater increases in serum folate concentration than males, smokers and multivitamin non-users, respectively (10·8 nmol/l in males v. 2·5 nmol/l in females, P < 0·0001; 8·0 nmol/l in non-smokers v. 3·1 nmol/l in smokers, P < 0·0001; 13·2 nmol/l in multivitamin users v. 4·8 nmol/l in non-users, P < 0·001). Dietary folate intake was strongly and positively associated with change in serum folic acid concentration (1·01 nmol/l increase in serum folic acid concentration for every 100 μg/d increase in folate intake, P = 0·001). The differences in demographic and behavioural factors were similar and remained significant after adjusting for total folate intake (which included folic acid from fortification) in grade 12. These results were not substantially different when analyses were restricted to those who did not use multivitamins or folic acid supplements.
Table 3 Serum folate concentration in the CATCH (Child and Adolescent Trial for Cardiovascular Health) cohort before and after folate fortification
*From mixed-effects regression analysis, adjusting for age, sex, race, CATCH site, intervention group, random variation among schools, multivitamin supplement use and smoking in grade 12, dietary folate intake at grade 12 and change between grade 8 and 12 in BMI. P tests for non-zero difference in mean serum folate change between indicated subgroup and reference subgroup, or for non-zero change in serum folate per indicated increment in predictor.
†Unadjusted.
‡Reference group.
The inverse relationship of serum tHcy with serum folate in students not taking multivitamins or folic acid supplements is illustrated in Fig. 1, as modelled by a segmented log–log relationship. In grade 8, serum tHcy concentrations levelled off above a junction point located at a serum folate concentration of 37·8 nmol/l. In grade 12, the junction point shifted rightward, to a higher serum folate concentration of 51·9 nmol/l (37 % higher, P < 0·0001) and upward by a serum tHcy concentration of 0·4 μmol/l (8 % higher, P < 0·003). The upward age trend in serum tHcy (Fig. 2) was uninterrupted in its course between the two measurement periods (P > 0·50). In contrast, folate concentrations showed a downward trend but incurred a discrete jump upward (17 % higher, P < 0·0001) between grade 8 and 12. Sex-stratified analyses indicated more pronounced trends in males than in females (P < 0·001 for interaction) for both tHcy concentration (+3·8 %/year in males, P = 0·006 v. +1·4 %/year in females, P = 0·19) and folic acid concentration (−7·1 %/year in males, P = 0·0001 v. −3·4 %/year in females, P = 0·008).
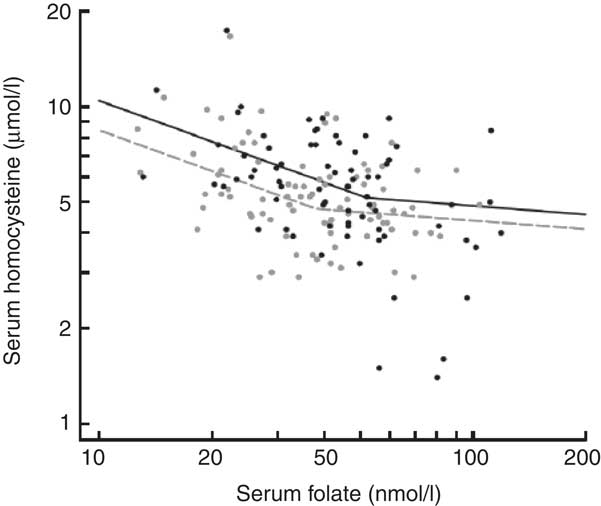
Fig. 1 Inverse relationship between serum homocysteine and serum folate concentrations in the CATCH (Child and Adolescent Trial for Cardiovascular Health) cohort before and after national folic acid fortification. From grade 8 (grey, pre-fortification) to grade 12 (black, post-fortification) the breakpoint of the fitted segmented regression curve shifted rightward, indicating higher folate levels, while the entire curve shifted upward, indicating higher homocysteine levels for a given folate level. Segmented regression curves were fitted to 3152 available joint measurements of homocysteine and folate concentrations, excluding users of multivitamins or supplements. Symbols represent a 5 % random sample of the fitted data
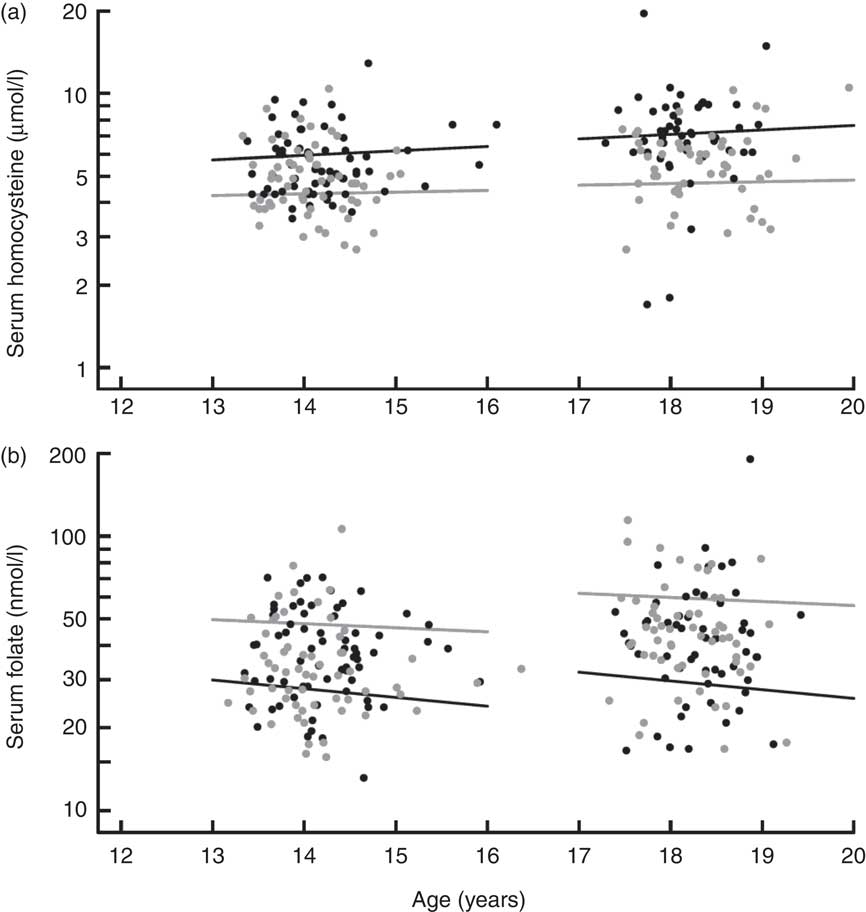
Fig. 2 Trends in serum homocysteine and serum folate concentration in the CATCH (Child and Adolescent Trial for Cardiovascular Health) cohort before and after national folate fortification. (a) For both males (black) and females (grey), the increase in homocysteine levels from grade 8 to grade 12 was a continuation of the within-grade age trend. (b) For both males (black) and females (grey), post-fortification folate levels (grade 12) were significantly higher than would be predicted by continuation of the within-grade age trend at grade 8 (P < 0·0001 for discontinuity between grades). Regression lines were fitted to 4620 measurements for the combined grades, excluding users of multivitamins or supplements. Symbols represent a 5 % random sample of the fitted data. For both homocysteine (a) and folate (b), the age trend was significantly steeper for males than females (P < 0·0001 for age × sex interaction)
Discussion
In the present study we found that folic acid fortification was associated with 16 % higher mean serum folate concentrations. It significantly prevented the age-related downward trend in serum folate concentrations among US adolescents and to a greater extent for females compared with males. Folate intakes at grade 12 were 118 μg/d higher from fortified foods. However, despite the increase in serum folate concentrations, tHcy concentrations increased by 17 % and the age-related increase in serum tHcy concentration reported in other studies( Reference Pfeiffer, Osterloh and Kennedy-Stephenson 26 ) was not affected. The increase in tHcy was more marked for males than females. The inverse relationship between serum folate and tHcy concentrations demonstrated a plateau that levelled off at higher serum folate concentrations post-fortification than pre-fortification (37·8 nmol/l v. 51·9 nmol/l, respectively). We also observed encouraging dietary intakes of folate and vitamins in our adolescent population. Mean intakes observed in our study (359 μg/d for folate, 1·5 mg/d for vitamin B6 and about 6·1 μg/d for vitamin B12) were comparable to the RDA for folate (400 μg/d), vitamin B6 (1·3 mg/d) and vitamin B12 (2·4 μg/d) for adolescents( 36 ).
Folic acid fortification was introduced by the US Food and Drug Administration in 1998 with the intention of reducing the occurrence of neural tube birth defects in women of childbearing age( 37 ). The level of folic acid fortification was set at 140 μg/100 g cereal-grain product and was estimated to increase the intake of folic acid by women of reproductive age by approximately 100 μg/d( 38 ), similar to the 118 μg/d that we observed among US adolescents in the current study. The post-fortification folic acid intake in the present study (359·1 μg/d) is much higher in comparison with countries where folic acid fortification has not been mandated. For instance, in Germany, Spain, Sweden, Denmark and the Netherlands, adolescents aged 13–18 years have mean overall folate/folic acid intakes ranging between 203 and 295 μg/d for males and between 192 and 265 μg/d for females( Reference de Bree, van Dusseldorp and Brouwer 39 , 40 ). These values are similar to the mean folate intake we observed in the present study, pre-fortification (241·1 μg/d). The higher folate intake post-fortification we observed is also consistent with reports from Canada, where folic acid fortification has been mandated( Reference Hennessy-Priest, Mustard and Keller 41 ). In European countries where folic acid fortification has not been mandated, serum folate concentrations in adolescents have been nearly one-third lower than the concentrations reported in our study( Reference van Beynum, den Heijer and Thomas 42 ).
Data from the National Health and Nutrition Examination Surveys have shown that folic acid fortification in the USA is associated with significantly lower plasma tHcy concentrations compared with concentrations before fortification. One study found that folic acid fortification resulted in, on average, a 1·0 μmol/l decrease in tHcy in US children( Reference Ganji and Kafai 28 ). Pfeiffer and colleagues( Reference Pfeiffer, Osterloh and Kennedy-Stephenson 26 ) found a small significant decrease in tHcy concentration post-folic acid fortification (1991–1994 v. 1999–2000) among male adolescents but not females, and concentrations then showed small non-significant increases during the post-fortification time points (1999–2000 v. 2003–2004). It is possible that once serum folate reaches an optimal concentration, its effect on tHcy concentrations plateau and tHcy concentrations are subsequently determined by other factors such as increasing age. Our findings are comparable to the age-related increase found in the Bogalusa Heart Study( Reference Greenlund, Srinivasan and Xu 43 ) which showed an average increase in serum tHcy concentration of 15 % from 12–14 years to 15–17 years. In addition, recent evidence from healthy individuals supplemented with folic acid( Reference Quinlivan, McPartlin and McNulty 44 ) and studies examining factors contributing to elevations in tHcy post-fortification( Reference Liaugaudas, Jacques and Selhub 45 ) suggest that once folate status is optimal, vitamin B12 may become the main nutritional determinant of tHcy concentrations. In addition, increased tHcy has been shown to occur in children with low plasma vitamin B12 ( Reference van Beynum, den Heijer and Thomas 42 ). It is possible that our finding that tHcy concentrations increased post-fortification may in part be due to decreased vitamin B12.
Folic acid supplementation and fortification have been shown to increase folate intake and serum folate concentrations while decreasing serum tHcy concentrations in different populations( Reference Hoey, McNulty and Askin 14 , Reference Jacques, Selhub and Bostom 46 , Reference Quinlivan and Gregory 47 ). Among adults in the Framingham Offspring study, folate intake increased (approximately 190 μg/d) and serum tHcy concentrations decreased (approximately 50 %) post-fortification( Reference Jacques, Selhub and Bostom 46 ). Dose–response relationships between serum tHcy and folate concentrations that level off at higher folate concentrations have also been demonstrated. Among children, plasma folate was negatively associated with plasma tHcy in a dose-dependent fashion only until folate concentrations reached 20 nmol/l( Reference Vester and Rasmussen 32 ). A plateau was observed in our study for the relationship between folate and tHcy at both pre- and post-fortification. Post-fortification, this plateau appeared to be reached at higher concentrations of folate and tHcy in our study, which may be related to age trends of increasing tHcy.
Our study findings indicate differences in age-related trends of increase in serum tHcy and decrease in serum folate concentrations among males and females. Differences in remethylation rates( 36 ), lean body mass( 37 ) and hormone-related metabolism( 38 , Reference de Bree, van Dusseldorp and Brouwer 39 ) may account for observed male/female differences in relationships between tHcy, folate and other vitamins. Inconsistencies( 16 , Reference El Shami and Durham 34 , 40 ) in reports of sex-related differences in the literature may be related to differences in vitamin nutritional status, ethnicity composition and other related risk factor differences between study populations.
Some limitations of our study deserve mention. Only 53 % of the original cohort was included in the present study, which may lead to bias. Analyses suggested some significant demographic differences between respondents and non-respondents that may have resulted in inaccurate estimates of changes in tHcy and folate status for gender and race subgroups. Our blood samples were non-fasting. However, an earlier study( Reference Must, Jacques and Rogers 27 ) reported that fasting did not appear to affect tHcy concentrations in participants after adjusting for age and race. Single measurements of tHcy at particular time points do not accurately reflect tHcy variability over time. However, it has been previously demonstrated that an individual's tHcy concentration remains relatively constant over a 30-month period (reliability coefficients: 0·66–0·82)( Reference Must, Jacques and Rogers 27 ). It is also important to note differences in folate equivalents between folic acid used for fortification and dietary folate, as well as limitations in food databases used to determine folate intake. Folic acid taken with food is 85 % bioavailable while food folate is only 50 % bioavailable; thus, folic acid taken with food has 1·7-fold (85/50) higher folate equivalents compared with dietary folate (polyglutamate)( 48 ). Current food databases, the majority of which were generated prior to current applications of trienzyme methods, underestimate actual folate content( Reference Gregory 49 ). Further, incomplete food tables and seasonal variation in nutrient content or variation in preparation methods may either under- or overestimate actual folate intake( Reference Gregory 49 ). However, investigators have reported that estimates of folate intake derived from FFQ are significantly correlated with folate nutritional status among adults( Reference Jacques, Sulsky and Sadowski 50 ). Finally, our study lacks a control group parallel to the post-folic acid fortification group, making a direct inference not possible. However, our attempt to disentangle age and fortification effects was facilitated by the considerable variability in age among the study population at the two time points. The 2-year spread within grade, coupled with the large sample size, enabled us to establish the age trend precisely within grade and demonstrate with high statistical significance that the trend was interrupted after fortification for folate but not for tHcy.
Conclusion
In summary, we have shown that among US adolescents, fortification substantially improved serum folate concentrations and attenuated the age-related decrease in serum folate concentrations, with a greater impact on females than males. Furthermore, fortification resulted in dietary intakes of folate that approached or exceeded the RDA. Future studies are warranted to investigate the significance of these improvements in folate status on clinical outcomes, in the post-fortification era.
Acknowledgements
This study was supported by grants from the National Heart, Lung, and Blood Institute, National Institutes of Health (R01-HL-66643, U01-HL-3988, U01-HL-39852, U01-HL-39906, U01-HL-39927 and U01-HL-39870). None of the authors had a personal or financial conflict of interest. The authors’ contributions were as follows: D.A.E., interpretation, manuscript preparation; H.A.F., study design, statistical analysis, interpretation, manuscript preparation; D.H.H., study design, interpretation, manuscript preparation; L.M.S., study design, interpretation, manuscript preparation; L.S.W., study design, interpretation, manuscript preparation; M.M.Z., study design, interpretation, manuscript preparation; E.B.R., interpretation, manuscript preparation; M.J.S., interpretation, manuscript preparation; S.K.O., study design, statistical analysis, interpretation, manuscript preparation.


