


Over the past 30 years, there has been a dramatic increase in overweight among children and adolescents in developed countries( Reference Wang and Lobstein 1 ). However, more recent studies suggest that prevalence rates in overweight have stabilized since the late 1990s( Reference Olds, Maher and Zumin 2 , Reference Rokholm, Baker and Sørensen 3 ). In the Netherlands, a stabilizing trend has been observed, but only in the four largest cities (Amsterdam, The Hague, Rotterdam and Utrecht)( Reference Schönbeck, Talma and van Dommelen 4 , Reference De Wilde, Verkerk and Middelkoop 5 ). Overweight prevalence rates among children and adolescents living in these cities were stable at 14 % between 1997 and 2009, whereas in other regions the prevalence rose from 9 % to almost 13 %( Reference Schönbeck, Talma and van Dommelen 4 ). A recent study in The Hague, examining time trends among four ethnic groups (Dutch, Turkish, Moroccan and Surinamese South Asian), even showed a significant decrease in overweight prevalence between 1999 (13 %) and 2011 (11 %), but only for the children and adolescents of Dutch ethnic background( Reference De Wilde, Verkerk and Middelkoop 5 ).
In the past few years, overweight prevention strategies have been targeted specifically towards the population in the urban areas in the Netherlands, and the observed stabilizing and decreasing trends in overweight might indicate that children and their parents have become more aware of important energy balance-related behaviours (EBRB). EBRB are behaviours that presumably determine energy intake and energy expenditure and are thereby factors that contribute to overweight when intake exceeds expenditure( Reference Rey-Lopez, Vicente-Rodríguez and Biosca 6 ). Examples of healthy EBRB are, among others, regular breakfast consumption, daily fruit and vegetable consumption, regular physical activity (e.g. participation in sports and walking or cycling to school) and limited screen time (watching television (TV) or playing sedentary computer games)( Reference Croezen, Visscher and Ter Bogt 7 – Reference Kautiainen, Koivusilta and Lintonen 11 ). Targeting these EBRB in health-promotion strategies becomes even more important as children grow older, because they will become more and more autonomous in their behavioural choices( Reference Bassett, Chapman and Beagan 12 ).
Previous studies have shown that adolescents with low socio-economic status/education and adolescents of non-Dutch ethnic background are more likely to skip breakfast( Reference Hulshof, Brussaard and Kruizinga 13 – Reference O’Dea and Caputi 15 ), to be less physically active( Reference Stalsberg and Pedersen 16 , Reference Mo, Turner and Krewski 17 ), to watch more TV and to play more sedentary computer games( Reference Simons, de Vet and Brug 18 , Reference Cornelisse‐Vermaat and Brink 19 ). At the same time, they are at higher risk of developing overweight than adolescents of Dutch ethnic background( Reference Brussaard, Van Erp-Baart and Brants 20 , Reference Labree, Van De Mheen and Rutten 21 ). Although we expect general positive trends in EBRB based on the stabilizing or decreasing time trend of overweight in Dutch urban cities, this could coincide with negative trends in lower educated adolescents and adolescents of non-Dutch ethnic background. To adequately target health-promotion activities for adolescents, insight into the time trends of important EBRB, and ethnic and educational disparities therein, is essential. The present study therefore aimed to: (i) investigate seven-year time trends in EBRB among 14-year-old Dutch adolescents in the city of Amsterdam; and (ii) examine the influence of educational level and ethnicity on these time trends.
Methods
Sample and materials
Data for the present study were available from the Youth Health Monitor used by the Public Health Service Amsterdam. The Youth Health Monitor is an annually ongoing project to assess the health status of adolescents in secondary schools in Amsterdam. Results of the monitor are used to develop health policies and health-promoting activities targeted at adolescents. From school year 2006–2007 to school year 2009–2010, data were collected on demographics and different lifestyle factors of 13- to 14-year-old second grade students by a paper questionnaire. From school year 2010–2011 to school year 2012–2013 an electronic questionnaire was used. Questions in the Youth Health Monitor are used nationally and based on international, validated questionnaires where possible. Every year, all regular secondary schools in Amsterdam are approached by the Public Health Service Amsterdam to participate in the project. Each year before data collection, information letters are sent to parents and students. A passive informed consent procedure is used, thus students and their parents can decide to not take part in the Youth Health Monitor. Questionnaires are completed confidentially in class, under the supervision of teachers and employees of the Public Health Service Amsterdam. Annual response rates of participating schools in Amsterdam are over 90 %. Approximately 37 000 adolescents completed the questionnaires between school year 2006–2007 and school year 2012–2013. The project is registered at the Dutch Data Protection Authority.
Measures
In the paper and electronic questionnaires adolescents were asked about numerous health topics. Questions were, among others, related to sociodemographic factors, health, drugs, alcohol, smoking, sexuality, nutrition and physical activity (including screen-time behaviour). In the present study, only questions related to sociodemographic variables, nutrition and physical activity were used.
Breakfast consumption
To assess breakfast consumption the following question was used: ‘How many days per week do you eat breakfast?’, with response values ranging from 0 to 7 d/week( Reference Martens 22 ). To calculate the percentage of adolescents with healthy breakfast behaviour, a dichotomous variable was made with ‘non-regular’ (0–4 d/week) and ‘regular’ (5–7 d/week) as values. The cut-off point was based on a previous cross-sectional study that showed that the odds of overweight is lower when breakfast is consumed on five or more days per week( Reference Croezen, Visscher and Ter Bogt 7 ).
Fruit and vegetable consumption
Fruit and vegetable consumption were assessed by the questions: ‘How many days per week do you eat fruit?’ and ‘How many days per week do you eat vegetables?’ Response values ranged from 0 to 7( Reference Martens 22 , Reference De Nooijer and De Vries 23 ). To calculate the percentage of adolescents meeting the guidelines for fruit and vegetable consumption, dichotomous variables were made for respectively daily (7 d/week) fruit and daily vegetable consumption. The Netherlands Nutrition Centre recommends to consume fruit and vegetables every day( 24 ).
Physical activity
Questions on physical activity were modified in the electronic questionnaire in school year 2010–2011. In the paper questionnaire, physical activity questions were only related to active transport to school and participation in sports in leisure time. However, in the electronic questionnaire, two questions on physical activity were added, resulting in four different topics related to physical activity: (i) participation in sport activities outside; (ii) participation in sport activities in a sports club; (iii) school gymnastics; and (iv) active transport to school (walking or cycling). A last question was added (based on those four different physical activities) to assess the percentage of children who meet the Dutch healthy exercise norm (NNGB) of being physically active for at least one hour per day( Reference Kemper, Ooijendijk and Stiggelbout 25 ). Because this question was not included in the paper questionnaire, it was only possible to assess the three-year trends in physical activity (2010–2011 to 2012–2013). The question used to assess how many children were physically active for more than one hour per day was: ‘Think of last week. How many days of this week did you spent at least one hour on these activities? Thus walking or cycling from and to school, gymnastics at school, participation in sport activities in a sports club and/or sport activities outside a sports club (for example, playing soccer on the streets)’( Reference Chinapaw, Slootmaker and Schuit 26 , Reference Wendel-Vos, Schuit and Saris 27 ). Response values ranged from 0 to 7. To calculate the percentage of children meeting the guideline of at least one hour of physical activity each day, responses were dichotomized based on the number of days per week (<7 or 7 d/week).
Screen-time behaviour
Total screen-time behaviour included computer use and watching TV. From school year 2006–2007 to school year 2009–2010, computer use was measured by using the question: ‘How many days per week do you use the computer in your leisure time? Think of for example using internet at home, playing computer games, chatting’. To accommodate the societal changes in computer use, the question was modified in school year 2010–2011 to: ‘How many days per week are you sitting behind a computer (internet, Game Boy, Nintendo) (not for school). Think of last week’. In school year 2011–2012 the question was modified again to: ‘How many days per week are you sitting behind a computer (internet, Game Boy, Nintendo, video game console (not for school). Think of last week’. In school year 2012–2013 computer use was assessed by the question: ‘How many days per week are you sitting behind a computer (laptop, tablet, video game console) (not for school). Think of last week’. Response values ranged from 0 to 7. To measure computer use in minutes per week the following question was used: ‘How long do you on average use the computer in your leisure time?’ Answer options were ‘<30 min/d’, ‘30–60 min/d’, ‘1–2 h/d’, ‘3–4 h/d’ and ‘>4 h/d’. Midpoints of the categorical variables were used (15, 45, 90, 160 and 210 min) to create a continuous variable of computer use in minutes per day. Subsequently, computer use in minutes per week was calculated by multiplying the number of days per week with the minutes per day. Watching TV was assessed by using the following questions: ‘How many days per week do you watch TV (DVD) in your leisure time?’ and ‘How long do you on average watch TV (DVD) in your leisure time?’ In a similar way to what is described above, the number of minutes of watching TV per week was calculated. Watching TV in minutes per week and computer use in minutes per week were summed and this sum was subsequently divided by seven to obtain screen-time behaviour in average minutes per day. It is advised to watch TV or play the computer for no longer than two hours per day on average( Reference Kemper, Ooijendijk and Stiggelbout 25 ). To calculate the percentage of adolescents adhering to this advice, a dichotomous variable was made with the cut-off points ‘<2 h/d’ and ‘2 h/d or more’.
Educational level
Students reported their educational level in the questionnaire. Four categories were made according to the Dutch secondary-school system from low to high: the practical pathway of pre-vocational education (PP VMBO), the theoretical pathway of pre-vocational education (TP VMBO), senior general secondary education (HAVO) and pre-university education (VWO). For the present study, adolescents who were first grade students or who were enrolled in special education were excluded.
Ethnicity
Ethnicity was based on self-reported country of birth of both the student and his/her parents. Conforming with the Netherlands Central Bureau of Statistics, we defined a person to be of non-Dutch ethnic background when the person him/herself and/or at least one parent was foreign-born( Reference Sanderse and Verweij 28 ). For the present study, only the four main ethnic groups in the Netherlands were included, which are the Dutch, Surinamese, Turkish and Moroccan ethnic groups.
Sociodemographic covariates
Basic sociodemographic information, i.e. age, sex and postal code, which was used to determine the district of Amsterdam in which the student lived, was included in the questionnaires.
Statistical analysis
Data analysis was performed using the statistical software package IBM SPSS Statistics 20·0. A total of 36 367 adolescents completed the questionnaires over seven years. Adolescents who were first grade students or were enrolled in special education (n 8330) were excluded, as were adolescents who did not belong to one of the four main ethnic groups (n 6342). We furthermore excluded participants with missing data on the covariates (n 2090) and on EBRB (n 361), resulting in a final study sample of 19 244 individuals: 2351 in 2006–2007, 2547 in 2007–2008, 2185 in 2008–2009, 2580 in 2009–2010, 3230 in 2010–2011, 3331 in 2011–2012 and 3020 in 2012–2013.
After descriptive analyses to assess differences in sociodemographic variables across school years, logistic regression analyses were performed to assess seven-year time trends in regular breakfast consumption, daily vegetable consumption, daily fruit consumption, regular physical activity and positive screen-time behaviour. The EBRB were dichotomized so that a higher value indicated a more healthy behaviour. First, potential non-linearity of the association between time (as continuous independent variable) and all five healthy EBRB (as dichotomous dependent variables) was checked by adding a quadratic term to the regression equation. All associations between time and healthy EBRB were linear, except for daily vegetable consumption. Therefore the logistic regression analysis for daily vegetable consumption was performed with time as categorical instead of a continuous variable. School year 2006–2007 was used as the reference category. After linearity checks, logistic regression analyses were performed using a stepwise hierarchical adjustment approach. First, crude analyses were adjusted for age, sex and district of Amsterdam. Second, analyses were subsequently adjusted for educational level and ethnicity and interaction effects were tested. For this, two separate models were constructed: one to test for interaction between time and ethnicity (adjusted for age, sex, district of Amsterdam and educational level) and one to test for interaction between time and educational level (adjusted for age, sex, district of Amsterdam and ethnicity). If statistically significant effect modification was observed, trends in healthy EBRB were stratified according to educational level or ethnicity. Statistical significance levels were set at P<0·05.
Results
Population characteristics
Participants in the study were all second grade students with a mean age of 13·6 (sd 0·6) years (Table 1). Overall, 43·5 % of the adolescents were of Dutch descent and 56·6 % of Moroccan, Turkish or Surinamese descent. Just over 30 % of the adolescents were enrolled in the practical pathway of pre-vocational education (PP VMBO) and about one-third in pre-university education (VWO). Although sociodemographic factors were significantly differently distributed across the school years (P<0·05), the differences were relatively small.
Table 1 Sociodemographic characteristics of 14-year-old adolescents participating in the Youth Health Monitor between school years 2006–2007 and 2012–2013, Amsterdam, the Netherlands
Healthy energy balance-related behaviours per school year
Nearly 75 % of the adolescents consumed breakfast for more than five days per week (Table 2). More adolescents met the guidelines for daily vegetable consumption (49·0 % consumed vegetables daily) than for daily fruit consumption (40·6 % consumed fruit daily). On average 40·1 % of the adolescents were watching TV or were behind the computer for less than two hours per day and approximately 16 % were physically active for more than one hour per day.
Table 2 Percentages of 14-year-old adolescents participating in the Youth Health Monitor with healthy energy balance-related behaviours between school years 2006–2007 and 2012–2013, Amsterdam, the Netherlands
* No data were available from school year 2006–2007 to school year 2009–2010.
Time trends in healthy energy balance-related behaviours
There was a significant linear increase over time of positive screen-time behaviour (<2 h/d; OR=1·04; 95 % CI 1·03, 1·06) and a significant non-linear decrease over time of daily vegetable consumption (school year 2012–2013 v. 2006–2007: OR=0·90; CI 0·80, 1·00; Table 3). Regular breakfast consumption, daily fruit consumption and regular physical activity were stable in the total population during the measured time period.
Table 3 Seven-year time trends in healthy energy balance-related behaviours among 14-year-old adolescents participating in the Youth Health Monitor, Amsterdam, the Netherlands
*P <0·05.
† Adjusted for sex, age and district of Amsterdam.
‡ Non-linear trend.
Time trends in healthy energy balance-related behaviours according to educational level
Interaction terms for time and educational levels were statistically significant for daily fruit consumption (P=0·017) and positive screen-time behaviour (P=0·002) and not statistically significant for daily breakfast consumption (P=0·60), daily vegetable consumption (P=0·80) and regular physical activity (P=0·21). Daily consumption of fruit decreased significantly (P=0·001) for students who were enrolled in practical pre-vocational education (lowest educational level) between school years 2006–2007 and 2012–2013, but no statistically significant time trends in daily fruit consumption were found for other educational levels (P=0·29–0·49; Fig. 1). Positive screen-time behaviour increased significantly for adolescents enrolled in pre-vocational education (practical and theoretical; P<0·001) and general secondary education (P=0·003) over the seven years (Fig. 2), while no time trend was observed for adolescents enrolled in pre-university education (P=0·82). In each year, the highest percentage of adolescents who reported healthy EBRB was observed among students enrolled in pre-university education (P<0·001).
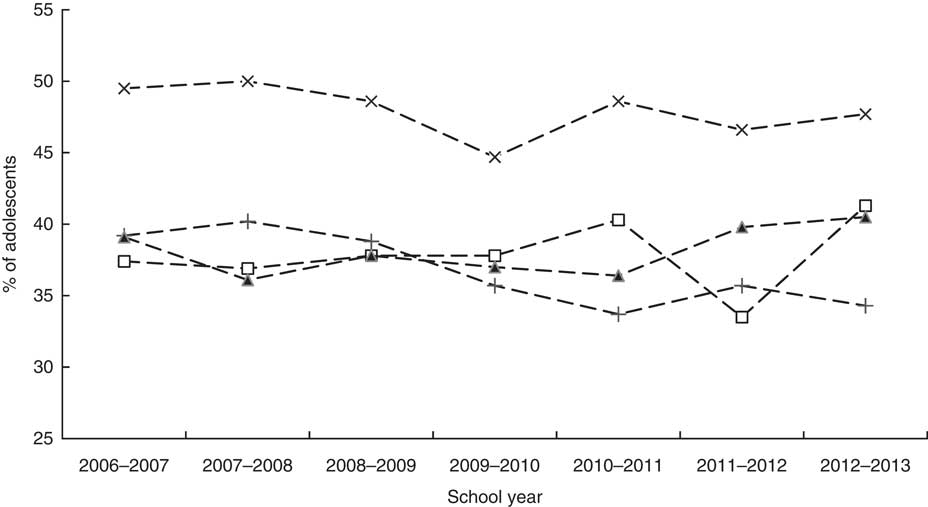
Fig. 1 Percentages of 14-year-old adolescents participating in the Youth Health Monitor meeting the guidelines for daily fruit consumption, stratified by educational level (+-+-+, practical pathway of pre-vocational education (PP VMBO); □-□-□, theoretical pathway of pre-vocational education (TP VMBO); ▲-▲-▲, senior general secondary education (HAVO); ×-×-×, pre-university education (VWO)), for school year 2006–2007 until school year 2012–2013, Amsterdam, the Netherlands. Odds ratios and 95 % confidence intervals adjusted for sex, age, district of Amsterdam and ethnicity, for school year 2012–2013 v. 2006–2007: PP VMBO (OR=0·96; 95 % CI 0·93, 0·98), TP VMBO (OR=1·01; 95 % CI 0·98, 1·04), HAVO (OR=1·02; 95 % CI 0·98, 1·06), VWO (OR=0·99; 95 % CI 0·96, 1·01)
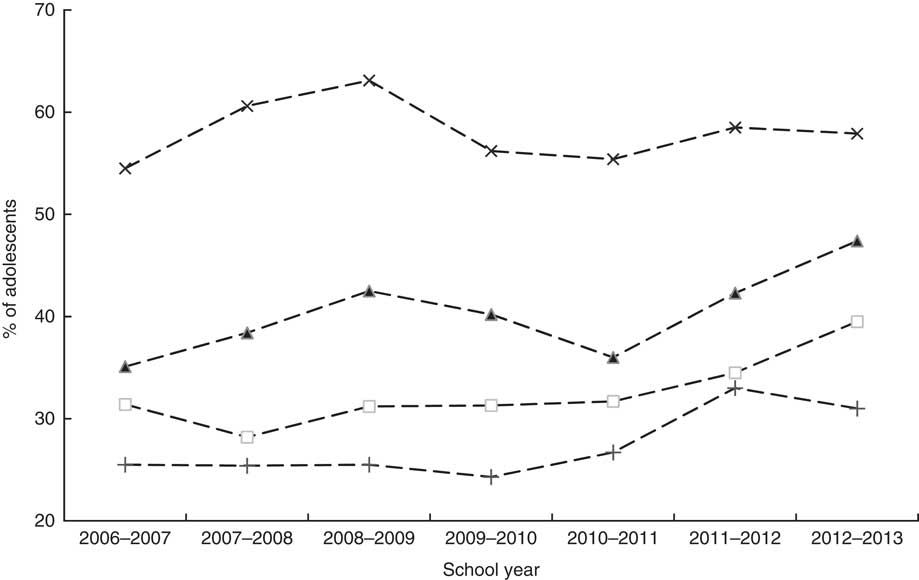
Fig. 2 Percentages of 14-year-old adolescents participating in the Youth Health Monitor meeting the advice for positive screen-time behaviour (<2 h/d), stratified by educational level (+-+-+, practical pathway of pre-vocational education (PP VMBO); □-□-□, theoretical pathway of pre-vocational education (TP VMBO); ▲-▲-▲, senior general secondary education (HAVO); ×-×-×, pre-university education (VWO)), for school year 2006–2007 until school year 2012–2013, Amsterdam, the Netherlands. Odds ratios and 95 % confidence intervals adjusted for sex, age, district of Amsterdam and ethnicity, for school year 2012–2013 v. 2006–2007: PP VMBO (OR=1·06; 95 % CI 1·03, 1·10), TP VMBO (OR=1·06; 95 % CI 1·03, 1·10), HAVO (OR=1·06; 95 % CI 1·02, 1·10), VWO (OR=1·00; 95 % CI 0·97, 1·02)
Time trends in healthy energy balance-related behaviours according to ethnicity
Interaction terms for time and ethnicity were statistically significant for daily fruit consumption (P=0·018), daily vegetable consumption (P<0·001) and positive screen-time behaviour (P<0·001). The interaction terms for time and ethnicity were not significant for daily breakfast consumption (P=0·069) and regular physical activity (P=0·45). Daily fruit consumption decreased significantly in adolescents of Surinamese origin (P=0·006) and adolescents of Turkish origin (P=0·015) over the seven years, but was stable in adolescents of Dutch origin (P=0·63) and adolescents of Moroccan origin (P=0·81; Fig. 3). Changes over time in daily vegetable consumption are presented in Fig. 4. Daily consumption of vegetables was significantly lower in school year 2012–2013 compared with school year 2006–2007 in adolescents of Turkish origin (P=0·005) and adolescents of Moroccan origin (P=0·006) but not in adolescents of Dutch origin (P=0·93) and adolescents of Surinamese origin (P=0·22). Positive screen-time behaviour increased significantly for adolescents of Surinamese origin (P<0·001), adolescents of Turkish origin (P<0·001) and adolescents of Moroccan origin (P=0·003), but was stable for adolescents of Dutch origin (P=0·61; Fig. 5). In each year, the highest percentage of adolescents who reported healthy EBRB was observed among adolescents of Dutch ethnic background (P<0·001).
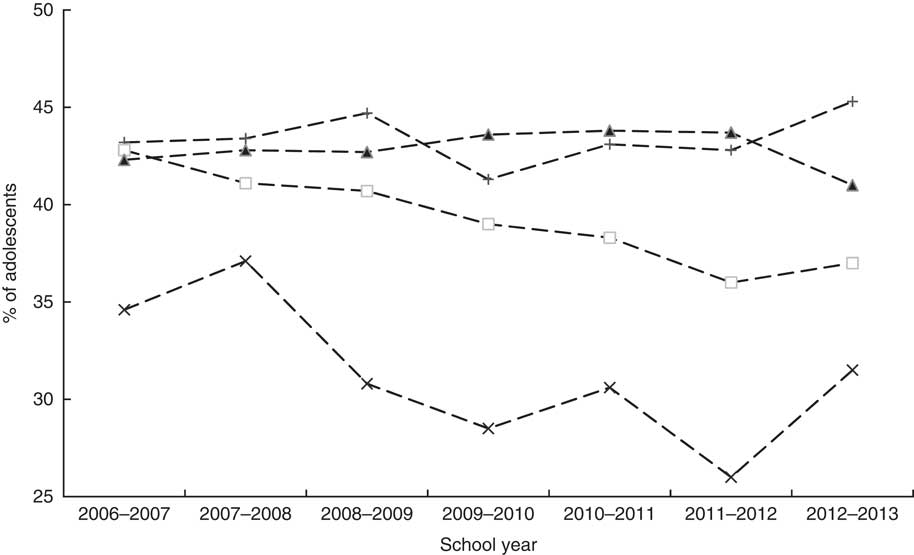
Fig. 3 Percentages of 14-year-old adolescents participating in the Youth Health Monitor meeting the guidelines for daily fruit consumption, stratified by ethnicity (+-+-+, Dutch; □-□-□, Turkish; ▲-▲-▲, Moroccan; ×-×-×, Surinamese), for school year 2006–2007 until school year 2012–2013, Amsterdam, the Netherlands. Odds ratios and 95 % confidence intervals adjusted for sex, age, district of Amsterdam and educational level, for school year 2012–2013 v. 2006–2007: Dutch (OR=1·01; 95 % CI 0·99, 1·03), Turkish (OR=0·95; 95 % CI 0·92, 0·99), Moroccan (OR=1·00; 95 % CI 0·97, 1·03), Surinamese (OR=0·95; 95 % CI 0·91, 0·99)
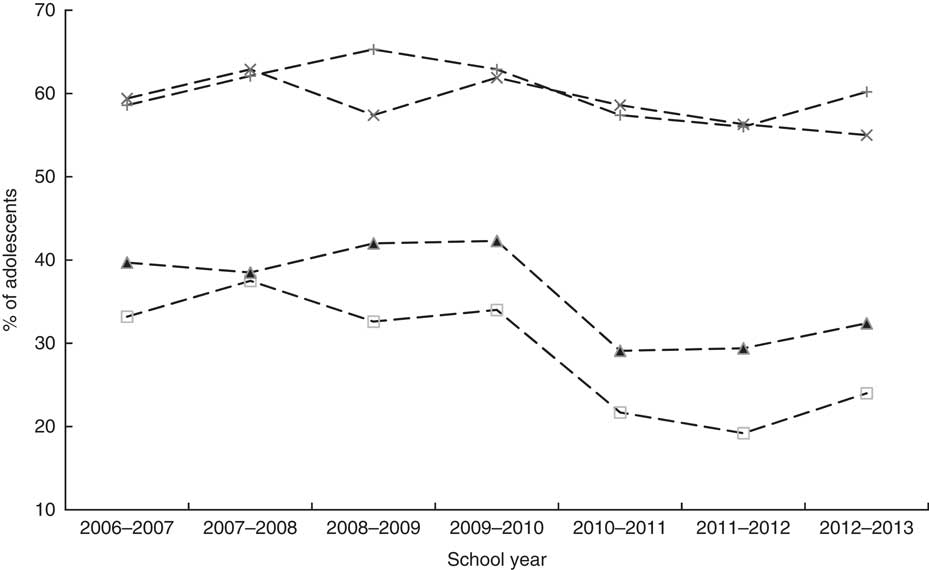
Fig. 4 Percentages of 14-year-old adolescents participating in the Youth Health Monitor meeting the guidelines for daily vegetable consumption, stratified by ethnicity (+-+-+, Dutch; □-□-□, Turkish; ▲-▲-▲, Moroccan; ×-×-×, Surinamese), for school year 2006–2007 until school year 2012–2013, Amsterdam, the Netherlands. Odds ratios and 95 % confidence intervals adjusted for sex, age, district of Amsterdam and educational level, for school year 2012–2013 v. 2006–2007: Dutch (OR=1·02; 95 % CI 0·86, 1·22), Turkish (OR=0·64; 95 % CI 0·47, 0·88), Moroccan (OR=0·73; 95 % CI 0·59, 0·91), Surinamese (OR=0·86; 95 % CI 0·65, 1·13)
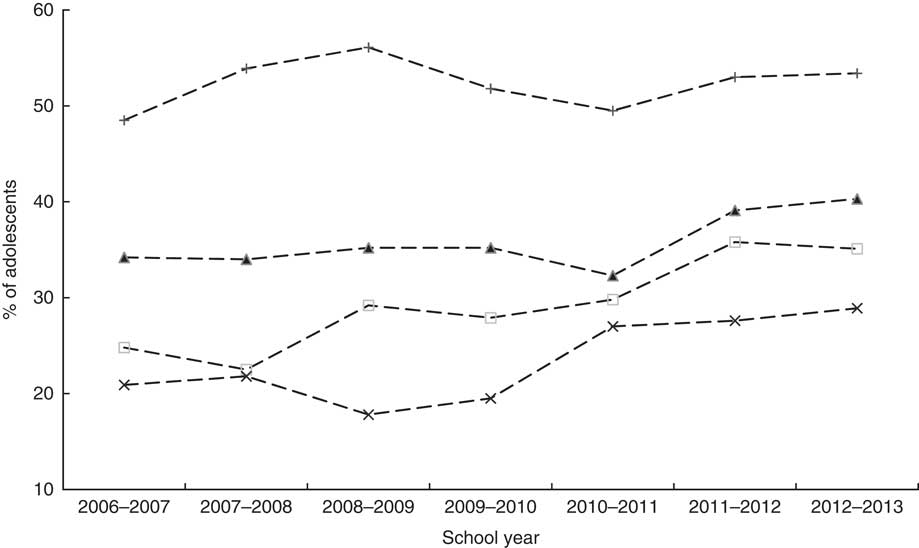
Fig. 5 Percentages of 14-year-old adolescents participating in the Youth Health Monitor meeting the advice for positive screen-time behaviour (<2 h/d), stratified by ethnicity (+-+-+, Dutch; □-□-□, Turkish; ▲-▲-▲, Moroccan; ×-×-×, Surinamese), for school year 2006–2007 until school year 2012–2013, Amsterdam, the Netherlands. Odds ratios and 95 % confidence intervals adjusted for sex, age, district of Amsterdam and educational level, for school year 2012–2013 v. 2006–2007: Dutch (OR=1·00; 95 % CI 0·98, 1·03), Turkish (OR=1·11; 95 % CI 1·07, 1·16), Moroccan (OR=1·05; 95 % CI 1·02, 1·08), Surinamese (OR=1·10; 95 % CI 1·05, 1·14)
Discussion
To our knowledge, the present study is the first large-scale study assessing time trends in healthy EBRB, including regular breakfast consumption, daily fruit and vegetable consumption, regular physical activity and positive screen-time behaviour, according to educational level and ethnic background in adolescents living in an urban area. The results show that, among 14-year-old adolescents, positive screen-time behaviour increased significantly over seven years while daily vegetable consumption decreased from school year 2006–2007 to 2012–2013. Time trends in positive screen-time behaviour were significantly different across educational levels and ethnic backgrounds. For all educational levels and ethnic backgrounds an increase in positive screen-time behaviour was found except for the highest educational level and adolescents of Dutch origin. A decrease in daily fruit consumption was solely found among adolescents in the lowest educational level and among Surinamese and Turkish adolescents. Time trends in daily vegetable consumption were significantly different across ethnicity. Turkish and Moroccan adolescents consumed significantly less vegetables in school year 2012–2013 compared with school year 2006–2007.
Screen-time behaviour
The increase in positive screen-time behaviour between school years 2006–2007 and 2012–2013 is supported by a recent Norwegian study that found the proportion of adolescents engaging in screen-time behaviour for more than 2 h/d decreased from 55 % to 45 % between 2001 and 2008( Reference Øverby, Klepp and Bere 29 ). In contrast, a German study found that screen-time behaviour was stable between 2002 and 2010. They found a decrease in watching TV, however this was compensated for by an increase in non-gaming computer use( Reference Bucksch, Inchley and Zdenek 30 ). Further analyses of the screen-time variables in the present study (data not shown) revealed a decrease in both TV time and computer time. We cannot exclude the possibility that the decrease in TV time found in the present study was compensated for by the use of a smart phone. The National Youth Monitor in the Netherlands observed an increased use of (mobile) Internet among adolescents in the past decade, but also a decline in watching TV( 31 ). However, the smart phone is only fourth among the most-used mobile Internet devices (below laptop/MacBook, personal computer and video games console)( Reference Rooij van and Schoenmakers 32 ) and it is thus unclear to what extent smart phone use has influenced the total computer time of adolescents in our study.
Despite the increase in positive screen-time behaviour, there is much room for improvement considering the size of the changes over the seven years. The percentage of (non-pre-university education and non-Dutch) adolescents who watched TV or played the computer for no longer than two hours per day on average increased by approximately 10 % in seven years and only 20–40 % of these adolescents met the advice for positive screen-time behaviour. For adolescents enrolled in pre-university education or of Dutch origin, this percentage was about 60 %.
Vegetable consumption
The decrease in vegetable consumption in school year 2012–2013 compared with school year 2006–2007 is of concern, especially because adolescents are among the lowest vegetable consumers in the Dutch population( Reference Van Rossum, Fransen and Verkaik-Kloosterman 33 ). The time trend for vegetable consumption was non-linear and the decline in vegetable consumption did not appear until school year 2010–2011. It might be possible that a modification of the question on vegetable consumption in the electronic questionnaire (partly) explains this decline. In the paper questionnaire, used from school year 2006–2007 to school year 2009–2010, the following question was used to assess vegetable consumption: ‘How many days per week do you eat vegetables? (e.g. tomato, broccoli, carrots, cabbage, mushrooms)’. The examples of different vegetables were not included in the electronic questionnaire, which may have caused an underestimation of the actual vegetable intake. Nevertheless, another study which used validated questionnaires, conducted among a large sample size of 11-year-old children in the Netherlands, also found a decrease in vegetable consumption between 2003 and 2009( Reference Fischer, Brug and Tak 34 ). In addition, a decrease in vegetable consumption was found in the adult population in the Netherlands( Reference Hulshof, Brussaard and Kruizinga 13 ).
The percentages of adolescents who met the guidelines for vegetable consumption were especially low for the adolescents of Turkish and Moroccan origin (respectively between 30 and 40 % in school year 2006–2007 and 20 and 30 % in 2012–2013). Even though these percentages were higher for adolescents of Dutch ethnic background and adolescents of Surinamese ethnic background (both between 55 and 65 %), stimulation of vegetable consumption remains important for all adolescents.
Educational and ethnic differences
In the current study, daily fruit consumption, regular breakfast consumption and regular physical activity were stable over time. Nevertheless, percentages of adolescents meeting guidelines for fruit consumption (40 %) and physical activity (16 %) were low, thus promotion of these EBRB remains an important topic for public health. This particularly holds for daily fruit consumption, which showed a significantly decreasing trend among adolescents with lower educational levels and adolescents of non-Dutch origin. In previous studies it was shown that lower socio-economic status associated with less favourable EBRB( Reference Horst, Oenema and Velde 35 , Reference Hanson and Chen 36 ). Indeed, in our study, the percentage of adolescents meeting the guidelines for healthy EBRB was the lowest for adolescents enrolled in pre-vocational education and the highest for adolescents enrolled in pre-university education. Trends in most EBRB (i.e. regular physical activity, daily vegetable consumption and regular breakfast consumption) were, however, similar across educational levels. Interestingly, an increase in positive screen-time behaviour (i.e. screen time <2 h/d) was found among all educational levels except pre-university level. However, the fact that pre-university students reported a two times higher prevalence of healthy EBRB than pre-vocational students still emphasizes the need to focus prevention programmes targeting unhealthy behaviour on the lower educated adolescents.
The decreasing overweight prevalence among adolescents of Dutch ethnic background, but not among adolescents of non-Dutch ethnic background( Reference De Wilde, Verkerk and Middelkoop 5 ), suggests that healthy EBRB could have increased among the adolescents of Dutch origin but not among the adolescents of Surinamese, Turkish or Moroccan origin. Indeed, trends in daily fruit and vegetable consumption were significantly different across ethnicities, but rather than an increase among students of Dutch ethnic background, we observed a decrease among the non-Dutch groups. In all ethnic groups, positive screen-time behaviour had increased over seven years’ time, although as mentioned before, we had no data on smart phone use.
Implications for health policy
The generally lower percentages of healthy EBRB among lower educated and adolescents of non-Dutch ethnic background confirm the need to target these groups specifically. Educational interventions can be effective in promoting dietary intake, physical activity and positive screen-time behaviour( Reference Van Cauwenberghe, Maes and Spittaels 37 – Reference Van Sluijs, McMinn and Griffin 40 ). Our results suggest that these interventions should be implemented especially in pre-vocational schools to reach the groups most at risk: on average 75 % of non-Dutch adolescents are enrolled in pre-vocational education. An example of an intervention that promotes healthy dietary intake in secondary schools in the Netherlands is the ‘Healthy School Canteen’, which focuses on changing school nutrition policy and increasing the healthy product choices in school canteens. It was shown that children make healthier choices when the availability of healthy products is increased( Reference Kocken, Eeuwijk and Van Kesteren 41 ).
Strengths and limitations
Some strengths and limitations should be considered while interpreting the results of the current study. A major strength is the high participation rate and the representativeness of the study sample. Each year, more than 90 % of the schools took part in the project and sociodemographic characteristics of the participants were representative for all Amsterdam 14-year-olds( 42 , 43 ). Our study was therefore able to give a good representation of EBRB in adolescents in Amsterdam and, as such, a good indication of EBRB in a European urban city. However, extrapolating the results of the study to non-urban areas should proceed with caution( Reference Joens‐Matre, Welk and Calabro 44 ). A potential limitation of the study is the use of self-reported questionnaires, which could lead to socially desirable answering. To minimize this source of bias all students were informed about the confidentiality of their answers. Another possible limitation of the questionnaires might be the transition from the paper questionnaire to the electronic questionnaire in school year 2010–2011. The questions used to assess vegetable consumption and screen-time behaviour changed slightly in the electronic questionnaire and a significant change in both behaviours was found after use of the electronic questionnaire. However, the decrease in vegetable consumption and increase in positive screen-time behaviour were consistent with other studies( Reference Hulshof, Brussaard and Kruizinga 13 , Reference Øverby, Klepp and Bere 29 , Reference Fischer, Brug and Tak 34 ), although it remains possible that the latter is attributable to the lack of smart phone assessment. More importantly, Van de Looij-Jansen et al. previously observed that computer-based administration yields no other results than paper questionnaires( Reference Van de Looij-Jansen and De Wilde 45 ). The questions on EBRB were not validated for different educational levels and ethnic groups; therefore we cannot exclude the possibility of underestimation, particularly in the group of lower educated adolescents of non-Dutch ethnic background. However, potential underestimation is not likely to depend on school year and is therefore not likely to have affected our time trend analyses.
Conclusion
To our knowledge, the present study is the first large-scale study to examine time trends in healthy EBRB according to educational level and ethnicity among adolescents living in an urban area. Unfortunately we were not able to relate trends in EBRB to trends in overweight in this population. Nevertheless, our study provides important insight into current trends among groups most at risk, which will help to further develop and target health-promotion activities aimed at adolescents in an urban city. We found an increase in positive screen-time behaviour, but more research into the use of mobile phones is required. Overall, the discouragement of too much screen time and the promotion of other healthy behaviours, in particular daily fruit and vegetable consumption, remain important, particularly among adolescents enrolled in pre-vocational education and of non-Dutch ethnic background.
Acknowledgements
Acknowledgements: The authors gratefully acknowledge the assistance of Child Health Care employees in implementing the Youth Health Monitor. They would like to thank all schools and students for their participation. Financial support: This research received no specific grant from any funding agency in the public, commercial or not-for-profit sectors. Conflict of interest: None. Authorship: F.J.M. performed the statistical analyses, interpreted the data and drafted the manuscript. M.v.E. conceptualized the study and supervised the statistical analyses. C.L.v.V. coordinated the data collection and provided statistical advice, as did H.A.H.W. All authors contributed to critical revisions of the manuscript and have approved the final version. Ethics of human subject participation: The Youth Health Monitor project is registered at the Dutch Data Protection Authority and uses a passive informed consent procedure.


