


The restaurant environment has been considered a likely contributing factor to rising obesity trends(Reference Currie, Vigna and Moretti1–Reference Lin and Guthrie3). In parallel with obesity rates, the share of food spending on food prepared away from home has increased significantly since the 1970s, including food purchased at fast-food and full-service restaurants(Reference Lin and Guthrie3). The consumption of food prepared away from home is associated with diets higher in energies, saturated fats, Na and sugar, and lower in fruits, vegetables, fibre and micronutrients(Reference Currie, Vigna and Moretti1–Reference Lachat, Nago and Verstraeten7). Fast-food and full-service restaurant consumption is associated with increased total daily energy intake. As a result, there is a need to identify and implement effective strategies to improve the nutrition environment of restaurants and dietary intake of restaurant diners.
Restaurant-based interventions to improve dietary choices have incorporated point-of-purchase nutrition information, increased healthy item availability and/or financial incentives with mixed results(Reference Policastro, Palm and Schwartz8,Reference Valdivia Espino, Guerrero and Rhoads9) , but few have investigated the impact of fundraising incentives aimed to improve food choices. In general, financial incentives have shown promise in promoting positive health behaviours. A review of randomised controlled trials revealed a positive effect of monetary incentives on food purchases, food consumption and weight loss(Reference Wall, Mhurchu and Blakely10), and recent studies continue to support effects of monetary incentives on fruit and vegetable consumption, physical activity and weight loss(Reference Harkins, Kullgren and Bellamy11–Reference Volpp, John and Troxel15). Fundraising incentives that indirectly benefit the participant may also influence personal health behaviour, specifically dietary behaviour.
One recent study explored the impact of fundraising incentives (charitable donation) and targeted energy messaging on beverage choices in a restaurant and determined that the donation had no effect(Reference Policastro, Palm and Schwartz8). However, the selected charity was predetermined by the research team with no participant input. Thus, participants may not have been motivated to donate to the chosen charity which may have reduced the fundraising incentive’s impact.
No known studies have investigated the impact of school fundraising incentives to promote healthful eating in the restaurant setting. Successful restaurant––school partnerships may simultaneously benefit (1) schools by raising money for school initiatives, (2) school families through improved health behaviours and outcomes and (3) restaurants with the potential to develop brand loyalty among consumers.
Many schools already participate in ‘Dine Out’ events where families earn donations for their school by dining at a restaurant. While existing programmes offer potential financial benefits for restaurants and schools, one concern is potential unintended negative consequences on diet quality and energy intake if participating families increase their frequency of dining out.
We designed an alternative model to ‘Dine Out’ events that incorporates fundraising incentives for purchasing healthier menu items aiming to retain the financial benefits of ‘Dine Out’ events while promoting healthy eating. This pilot programme collaborated with restaurants to promote healthier menu items and offer fundraising incentives benefiting participants’ school wellness programmes, which provide nutrition and physical activity programming to students and have been shown to increase fruit and vegetable consumption and time spent participating in physical activity among schoolchildren(16). We examined the programme’s feasibility, including acceptability among participants and implementation fidelity, as well as its initial efficacy in increasing the selection of healthier items when dining out.
Methods
Overview
A randomised pilot study was developed in collaboration with one school district and one fast-casual restaurant in Southern California targeting families with children attending elementary schools within the participating school district. Schools were randomised to one of the two fundraising intervention conditions intended to promote healthier ordering behaviours among families when dining out. Feasibility (recruitment/participation, implementation fidelity and intervention acceptability) was assessed using process evaluation and surveys completed by families. In addition, initial intervention efficacy was assessed in two ways. First, ordering of healthier items was compared between the two conditions among participating families. Ordering of healthier items among all restaurant customers was also compared during intervention periods v. two comparison periods when no intervention was in place. Institutional Review Board approval of all research methodology was obtained through IRB Company, Inc. (IRBCo).
Recruitment and participation
Restaurant
Consumption of foods from different types of restaurants (e.g. quick-service/fast food, as well as full-service/sit down) is linked to less healthy nutritional intake (energies, sugar, saturated fat, Na) among adults and children(Reference Lin and Guthrie3,Reference Powell and Nguyen17) , with evidence that families consume foods from quick-service/fast-casual restaurants more often than full-service restaurants(Reference Powell, Nguyen and Han18). In an effort to reach a broad range of families, we partnered with a local fast-casual Mexican-cuisine restaurant in San Diego County with a central location and convenient counter service and affordable menu. A research team member conducted a training session for on-site restaurant staff on research procedures prior to implementation. The restaurant owner received a $US200 incentive for their participation.
Schools
All twelve elementary schools within the school district were invited to participate in the study in the form of a fundraiser, at a local restaurant, benefiting their school wellness programme. The participating schools were then matched using the Mahalanobis method(Reference Song and Herman19) based on student population size, percentage of students eligible for free and reduced-price school lunches, and distance to the intervention restaurant. One school from each pair was randomly assigned to one of the two intervention groups.
Families
School families were recruited to visit the participating restaurant during the assigned intervention period via (1) email blasts including an electronic flyer sent to parents of children attending elementary schools in the participating school district and (2) paper flyers delivered to all twelve schools and distributed to students prior to each intervention condition. The flyers included an identifying sticker for each school. Parents/guardians without a flyer were able to retrieve one from the research table in the restaurant prior to ordering. Restaurant staff collected flyers from participating families and attached the corresponding receipt to the flyer.
After ordering, parents/guardians visiting the study restaurant during the intervention were recruited to participate in an optional survey on-site to collect data on programme acceptability and restaurant dining behaviours. Researchers positioned near point-of-purchase approached all families participating in the intervention and invited them to complete the survey. Eligibility criteria to participate in the survey included (1) being 18 years or older, (2) being a parent/guardian of a child who attended one of the participating elementary schools, (3) having ordered any item at the participating restaurant location during the intervention period, (4) able to read, write and speak English or Spanish and (5) agreeing to data collection procedures. The survey was administered in English or Spanish via paper or electronic tablet via QuickTapSurvey software (www.quicktapsurvey.com, TabbleDabble Inc.) and was designed to take <10 min. Survey participants received a $US10 gift card to the restaurant for completing the survey.
Intervention
Both the Fundraising Incentive (FI) and Fundraising-Healthy Eating Incentive (F-HEI) conditions consisted of a 4-d restaurant-based intervention organised as a school ‘Dine Out’ promotion incorporating fundraising incentives and nutrition information. Specifically, both conditions consisted of (1) a fundraising incentive for visiting the restaurant and ordering any item, (2) a poster promoting healthier menu options and (3) nutrition information displayed at point-of-purchase. Fundraising incentives were provided as a donation to the school wellness programme of the participant’s child and were calculated as a percentage of the family’s total bill. Incentive amounts were finalised using restaurant operator feedback. The incentive amounts and donation target (school wellness) were printed on the flyers distributed to families. Fifteen percentage of the total bill was donated to the corresponding school for all receipts collected with a flyer. In the F-HEI condition, an additional 10 % of the total bill was donated to the corresponding school for all receipts containing at least one of the sixteen promoted healthier menu items, which consisted of small plates (tacos) and main meals (bowls, tortas, burritos and salad) from the standard menu. This additional fundraising incentive was promoted on all study signage exhibited during F-HEI. During both conditions, a 3 × 2 foot poster was displayed between the restaurant entrance and cashiers and highlighted a selection of the healthier items with pictures and nutrient information. The nutrition information at point of purchase, located at each of the cash registers, also included healthier menu items and nutrition information without photos.
In order to determine healthier menu items, Healthy Dining nutrition criteria were used(20) and menus were analysed by a registered dietitian using Genesis R&D Food Formulation & Labeling Software (Genesis R&D Software 9.14.41 Database Structure version 9.8.2, ESHA Research, 2015).
Measures
Feasibility
Feasibility analyses included assessments of recruitment and participation, implementation fidelity and intervention acceptability.
To assess recruitment and implementation fidelity, process evaluation was carried out by the research team. Recruitment indicators included overall school and family participation, school population characteristics by intervention group and demographic characteristics of survey participants. Additional variables that could affect participation and outcomes were also monitored including weather, holidays and competing school and restaurant promotions (including restaurant menu specials).
Additional variables monitored by the research staff during recruitment and implementation included: number of flyers distributed and collected, number of emails distributed, intervention days of the week and times of day, restaurant staff training, nutrition promotion sign and poster placement, and customer traffic.
Intervention acceptability was measured via participants’ survey responses. The survey measured demographics, intervention acceptability, and behavioural data from parents/guardians who participated in the intervention.
Efficacy
Receipts
Two types of sales data were collected for analysis. First, sales receipts were collected from families who presented a flyer in the restaurant. The number of healthy items ordered and total number of items ordered by each participating dining party were recorded from receipts during each intervention, and the percentage of items ordered that were the promoted healthy items (i.e. relative ordering of healthy items) was calculated for each dining party.
Sales
In addition, parallel variables were calculated from aggregate sales data (i.e. across all patrons in the restaurant) during each of the two intervention periods, as well as two 4-d comparison periods in which no intervention was in place, one 2 weeks before the first intervention (FI) and one 3 weeks after the intervention periods ended. These no-intervention time periods are referred to herein as Comparison 1 and Comparison 2, respectively (Fig. 1).
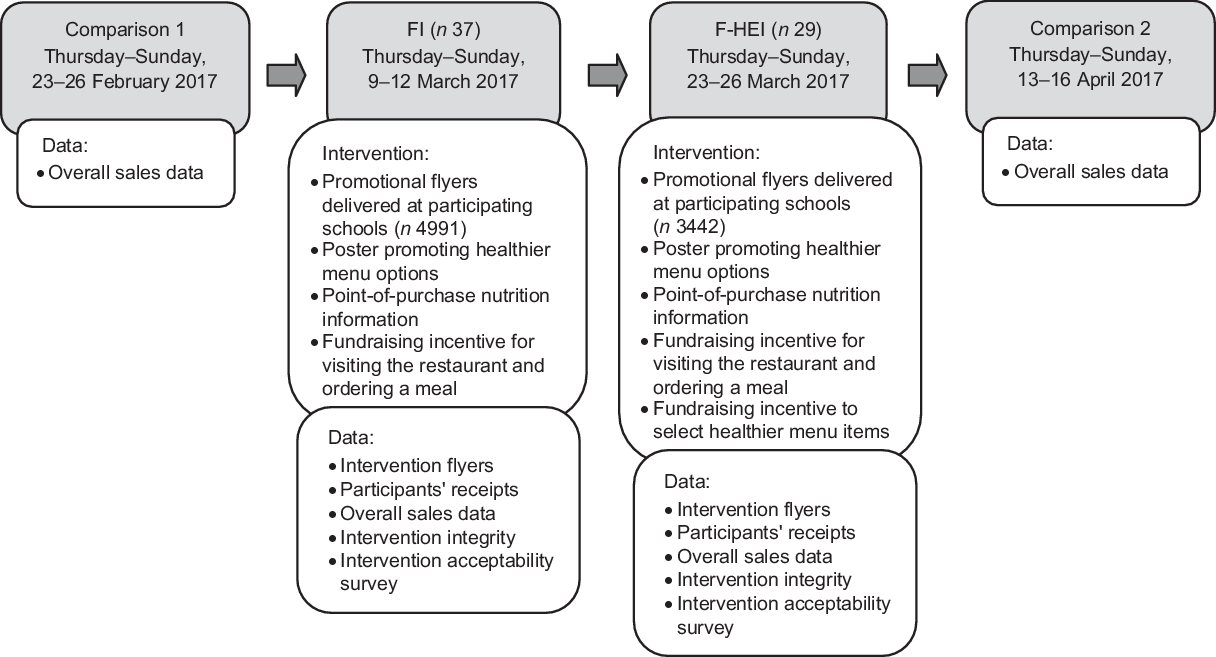
Fig. 1 Flow diagram of intervention and components of the restaurant-based fundraising and nutrition promotion on menu choices. FI indicates condition with Fundraising Incentive; F-HEI condition with Fundraising Healthy Eating Incentive. Process Evaluation data (placement of materials, weather, traffic, staff follow through, etc.) collected for implementation assessment
Data analysis
Feasibility
Descriptive statistics (frequencies for categorical variables and means and standard deviations for continuous variables) were utilised to summarise recruitment and participation information, implementation fidelity and intervention acceptability.
Efficacy
Primary efficacy analyses were to compare relative ordering of healthy items between the two intervention groups (using receipt data and repeated in aggregate sales data for comparison), as well as to compare relative ordering of healthy items among all restaurant patrons during each intervention v. comparison periods (in aggregate sales data). χ 2 tests were used for each of these comparisons. The total donation gained from the fundraiser was also measured.
Sample size calculation
In estimating the sample size needed to detect significant differences for efficacy analyses, we started with the effect size from a previous study examining changes in ordering of healthier menu items after healthy children’s menu changes(Reference Anzman-Frasca, Mueller and Sliwa21), adjusting our estimate of the anticipated effect due to differences in the number of healthier menu options available. To detect an increase from 3 to 23 % healthy items with α = 0·05 and power = 0·80, a sample of forty-four orders per intervention time point was required (n 88). This sample size was feasible to expect in the receipt data based on enrolment in the study schools, historical target restaurant sales data and estimated revenue from past Dine Out promotions.
Results
Feasibility
Recruitment and participation
All twelve schools from the school district agreed to participate in the research study. Characteristics of the school district population are found in Table 1. The six schools participating in FI received a total of 4991 flyers, based on student enrolment, and 49 (0·98 %) were collected at the restaurant during the intervention period. The remaining six schools received 3442 flyers and 32 (0·93 %) were collected during F-HEI.
Table 1 Characteristics of school groups after matching*

* Schools matched on enrolment, distance and free and reduced meal eligibility using Mahalanobis. After matching the two groups did not differ on any of these characteristics (P > 0·05) although the present study was not powered to detect this difference. District data are from 2015 to 2016 Enrolment Demographics.
† School district elementary school population.
‡ Distance from school to restaurant.
Participant receipts were collected from all orders submitted with a flyer. Eighty-one receipts were collected during the intervention periods, forty-nine during FI and thirty-two during F-HEI. Each receipt included an average of 4·4 total menu items ordered, with a range of 1–11 menu items. Three school staff submitted a flyer and ordered a menu item during F-HEI, which were included in the analysis. The school district raised $US303·55 through the fundraising incentives for both intervention conditions combined.
Sixty-six parent/guardians (representing 85 % of families who participated in the interventions) agreed to complete the survey (n 37 during FI, n 29 during F-HEI). Demographic characteristics of the survey participants (Table 2) were comparable with the overall target population of parents living in the same Southern CA county(22). Forty-five percentage of respondents identified as Hispanic or Latino, 42 % were White, 7·5 % were Asian and 5·5 % identified as other races. Two of the three schools with the lowest participation were the farthest from the restaurant (six miles), one of which also had a competing fundraiser during the intervention period. The third lowest participating school had the greatest percentage of students receiving free and reduced-price lunches (96 %).
Table 2 Demographic characteristics of behavioural survey respondents

FI, Fundraising Incentive; F-HEI, Fundraising-Healthy Eating Incentive.
* Individual n values vary due to missing data.
† Asian Indian, Chinese, Filipino, Japanese, Korean, Vietnamese or other Asian.
Implementation fidelity
The intervention conditions were implemented per protocol: each intervention occurred Thursday through Sunday with researchers collecting data during all shifts. Nutrition promotion materials were placed in designated areas, where they remained for the duration of the study. The restaurant staff collected flyers and receipts as they were trained to do by research staff. Although the restaurant promoted several other menu items separately from the study promotions, these promotions were ongoing for this restaurant and were consistent for both intervention conditions (e.g. Taco Tuesday ($US1·00 off any taco); Happy Hour Specials). Competing events on at least one day of intervention were reported among four schools during FI and two schools during F-HEI (Fun Run, Farmer’s Market). Weather was consistent across conditions and was typical for the region and time of year; temperatures were in the 60s with sunny and cloudy skies.
Intervention acceptability
Programme acceptability was demonstrated through survey responses with all respondents indicating that they were ‘somewhat’ (14·3 %) or ‘very’ (85·7 %) likely to participate in a similar fundraiser in the future. Half of all respondents indicated that they ordered a healthier menu item as advertised on the promotional materials. Among survey respondents who reported choosing a healthier menu item, all reported liking their meal and nearly 86·5 % indicated they were ‘very’ or ‘somewhat’ likely to order the menu item again.
Nearly all respondents (95·4 %) from both intervention conditions agreed or strongly agreed that the general (15 %) fundraising incentive motivated them to visit the restaurant, and 55·2 % of respondents from F-HEI agreed or strongly agreed that the additional incentive motivated them to order a healthier menu item. Yet among those who ordered a healthier menu item in F-HEI, only 9 % reported making their meal choice based on the fundraising incentive to order a healthier meal. A summary of survey questions and responses is found in Table 3.
Table 3 Behavioural survey results summary

FI, Fundraising Incentive; F-HEI, Fundraising-Healthy Eating Incentive.
* Collapsed list of Healthy Dining (HD) and Kids Live Well (KLW) menu items.
† Answer only applicable to F-HEI.
‡ Question only applicable to F-HEI.
Intervention efficacy
Comparing orders of healthier items between the two intervention conditions
Of the 141 items ordered by participants during FI, 15·6 % were healthier items, and of the ninety items ordered in F-HEI, 21·1 % were healthier items. Although in the expected direction, the difference in ordering of healthier items between the two conditions was not statistically significant (χ 2 = 1·14, P = 0·29). Results were similar in the aggregate sales data (Table 4).
Table 4 Relative orders of healthier menu items by study period

FI, Fundraising Incentive; F-HEI, Fundraising-Healthy Eating Incentive.
† Receipt data: Comparison of % healthier item orders between FI and F-HEI performed using more precise receipt data. All other rows show comparisons using aggregate sales data.
** P < 0·01.
Comparing orders of healthier items during intervention periods v. comparison periods
The percentage of healthier items ordered was significantly greater during both FI (χ 2 = 5·97, P = 0·01) and F-HEI (χ 2 = 8·84, P = 0·003) v. Comparison 2. Results were similar but did not reach statistical significance when comparing the interventions to Comparison 1.
Discussion
Results from this pilot study indicate initial promise of a collaborative healthy eating and school wellness fundraising programme between schools and restaurants and also highlight areas for future research.
The study was implemented with full cooperation from the school district with all schools agreeing to participate. Among the families who took the survey, all indicated they would participate again in a similar programme, most were motivated by the fundraising incentive to visit the restaurant (95 %) and more than half were motivated by the additional incentive to order a healthier menu item (55 %). Despite acceptability among this group, parents who did not participate in the intervention may not have approved of the programme, a factor that could be explored in future research. Demographic characteristics of survey participants were comparable to both state and country demographics with respect to gender, race, education and income(22) suggesting that the sample, while small, was representative of California and US school families. Given that San Diego area residents may be more health conscious than other parts of the United States(23), additional research is needed to inform generalisability beyond this area.
In terms of fidelity, all intervention procedures were followed, monitored, recorded and analysed as intended. Conducting nutrition research in the restaurant setting and collaborating with restaurant administration can be challenging due to differing priorities and goals. Establishing ‘buy-in’ from the restaurant was imperative in implementing research methodology and collecting reliable data. We hypothesise this success was due to (1) consistent communication (and training) between the research team and the participating restaurant, (2) mutual benefit to all parties involved and (3) starting small: implementing at one location over a relatively short timeline with the intent to scale up once roles, responsibilities and relationships were established.
Efficacy results provide initial promising evidence that fundraising incentives coupled with point-of-purchase promotions of healthier menu items may increase healthier items ordered in a collaborative school and restaurant-based intervention. Specifically, aggregate sales data provided some evidence that sales of healthier menu items were greater during intervention periods v. comparison periods. Given low rate of flyer turn-in, these results may reflect the influence of point-of-purchase promotions. There was no significant difference in healthier item orders between intervention periods, suggesting that the additional fundraising incentive was not an impactful strategy to increase healthier items ordered. However, healthier item promotional materials were displayed throughout both intervention periods potentially mitigating the effect of the healthier item fundraising incentive, and the sample size was limited in the analysis of participating school families’ receipts. While direct comparisons of FI and F-HEI did not reveal significant differences in the relative percentage of healthier items ordered, the significant difference in healthier orders during intervention v. comparison periods was most robust for F-HEI, with consistent evidence of increases in healthier items ordered regardless of the comparison period used. Because aggregate sales data included all customers rather than just those participating in the fundraising intervention, the conclusions made based on the sales data cannot be generalised to school families alone. These results could be considered a conservative assessment of the intervention, as patrons who are not from the target population are included in the sample and would have been exposed to the nutrition information component of the both conditions, but not the fundraising incentives.
We do not know whether the present results affected children’s eating behaviours specifically, given that incentives were targeted to adults and only standard menu items were promoted. In future research, it would be interesting to examine the effects of this type of intervention on different family members.
Healthy eating promotions in restaurants may raise the concern that the promotion may encourage families to dine out, being counter-productive to nutrition programming. In the current study, only 6 % of survey respondents reported that they dine out less than one time per month, suggesting that these promotions did not attract infrequent diners. Additionally, 44 % of respondents indicated that they eat away from home at least once per week, thus attracting a population who may benefit most from a restaurant-based healthy eating intervention.
Only 9 % of survey respondents reported selecting the healthier menu item because of the fundraising incentive; coupled with the comparison of FI v. F-HEI, these results suggest that the additional incentive to order a healthier menu item did not motivate the targeted behaviour change. Parents may have felt that the 15 % donation was sufficient and that the additional 10 % donation for ordering a healthier menu item was unnecessary. The majority of participants did agree that this initial incentive motivated them to visit the restaurant that day.
While the successful aspects of the present study highlight opportunities to continue research in this area on a larger scale in the future, limitations of the present study should be addressed prior to such expansion. As mentioned above, a primary limitation of the current study is that the intervention participation rates were lower than anticipated for both intervention periods generating fewer receipts than the calculated sample size targets. Flyers were distributed at the individual level and collected at the family/order level potentially underestimating true participation rates. Nevertheless, there is clearly room to improve participation rates in the future.
Because different restaurants vary in terms of their consumer base and the healthfulness of the core items sold, it would be important to test this approach in a wider variety of restaurants to shed light on generalisability and the extent to which school family participation rates are tied to restaurant choice.
Likewise, we do not know the extent to which this specific fundraising initiative was motivating to parents, which could be a factor contributing to low participation rates. While participants were aware that the funds were being raised for school wellness programmes in general, parents may want to know and/or choose specifics of the fundraising goals (target and amount). Future research can shed light on this by talking with parents about their motivation to support different types of school fundraisers.
Finally, incentive amounts were finalised with restaurant operators; however, further dose–response research may be completed to determine the optimum incentive amount required to motivate parents to select healthier menu items.
Improving recruitment in future studies can bolster benefits for participating schools. In this pilot, the total donation to school wellness programmes from FI and F-HEI was $US303·55 for all twelve participating schools, amounting to a minimal benefit for each school. Lower prices of meals at fast-casual restaurants result in a reduced donation amount as compared with table-service restaurants. While selecting higher price-points would increase per-order donations, volume of participants may be further reduced due to affordability of menu items.
Additionally, it was not possible to examine clustering of orders within schools within the sales data given that these data were aggregated (and included patrons who are not affiliated with the study schools). Future research should be designed to further investigate the promise of the present approach while being able to accommodate clustering in data analyses.
Creating public–private partnerships with the restaurant industry may be a useful strategy to expand healthier menu item availability and purchases and improve dietary habits of restaurant patrons. Overall, findings suggest that the use of the initial fundraising incentive plus healthy eating promotions (non-incentive-based strategies) to promote healthier items at point of purchase is promising avenues to pursue, although future research is needed to understand the extent to which refinements to the present study’s design (e.g. a wider variety of restaurants, different targeting of funds raised for schools, different incentive amounts) may bolster participation rates. Future studies could build on these techniques aiming to increase participation and the consumption of the healthier options beyond that observed in the present study.
Acknowledgements
Acknowledgements: The authors thank Anita Jones-Mueller, Nicole Ring, the participating school district and its elementary schools and our restaurant partner. Financial support: This study was funded by the National Cancer Institute of the National Institutes of Health under Award Number 5R44CA192374. The content is solely the responsibility of the authors and does not necessarily represent the official views of the National Institutes of Health. The funder had no role in the design, analysis or writing of this article. Conflicts of interest: The authors declare no conflicts of interest. Authorship: S.L.M. contributed to design, implementation, data analysis and writing. S.A.-F. contributed to design, data analysis and writing. K.B. contributed to design and implementation. M.B. contributed to design, implementation and analysis. S.C.F. contributed to design and writing. A.P. contributed to design, implementation and writing. Ethics of human subject participation: This study was conducted according to guidelines laid down by the Declaration of Helsinki and all procedures involving research study participants were approved by IRB Company, Inc. (IRB.co) in Buena Park, CA. A partial waiver of informed consent was used; participants were asked to read an information sheet prior to participation.


