


1 INTRODUCTION
An unavoidable problem in probing the high-redshift Universe is the rapid rise of luminosity distance with redshift. In luminosity distance, the epoch of reionisation (EoR) from t = 100 Myrs extends 80 Hubble radii. More powerful telescopes and instruments are needed for the EoR, such as (i) JWST: [powerful, but small field, with spectroscopy paramount], (ii) DECam: [1 µm and shorter, wide field (Flaugher et al. Reference Flaugher2012)], (iii) KDUST: [1 µm <λ< 3 µm, wide field (Yuan et al. Reference Yuan2013)], (iv) Subaru: [Hyper Suprime Cam (HSC—Miyazaki Reference Miyazaki2015)]. In this paper, we review survey successes and expectations for superluminous supernovae (SLSNe).
2 MASSIVE AND SUPERMASSIVE STARS
We observe very massive stars (> 100 M⊙) in the present universe and, as a result, we do know that they can form. But how do they actually end their lives? Will they die as core-collapse supernovae (SNe) energised by the spin down of magnetars, pair instability supernovae (PISNe) with explosion energies up to 100 times that of regular SNe, pulsational PISNe that can produce very bright events due to colliding shells, or via another mechanism? Asymmetry may play a critical role in evolution. Extreme events that trigger relativistic jets may become luminous enough such that their discovery can be made by relatively small telescopes. These extreme cases may output high energy radiation as in gamma-ray bursts (GRB).
Woosley & Heger (Reference Woosley and Heger2015) reviewed the theory of the evolution and death of stars heavier than 10 M⊙ on the main sequence. The more massive of these, absent serious mass loss, either make black holes when they die, or, for helium cores exceeding ~ 35 M⊙, encounter the pair instability. Outcomes, including the appearance of GRBs (Levan et al. Reference Levan2016), depend on the initial composition of the star, its rotation rate, and detailed physics. These stars can produce some of the brightest SNe, but also some of the faintest.
Yoshida et al. (Reference Yoshida2014) investigated very massive stars with main sequence mass larger than 100 M⊙ and metallicity 0.001 < Z < 0.004 which might explode as Type Ic SLSNe. Progenitors of 43 and 61 M⊙ WO stars with Z = 0.004 were evolved from initial 110 and 250 M⊙ stars. These stars were expected to explode as Type le SNe. Other progenitor spectral types were studied by Groh et al. (Reference Groh2013). Dessart et al. (Reference Dessart2012) point out that mixing challenges the ability to infer progenitor and explosion properties.
From the collapse of supermassive stars (SMSs), supermassive black holes observed at high redshift in QSOs could grow from direct collapse black holes (DCBHs) with mass ~ 105 M⊙. Ultra-luminous SNe (Matsumoto et al. 2016) of ~ 1045 − 46 erg s−1 would be detectable by future telescopes in the near infrared, such as Euclid, WFIRST, KDUST, and JWST for ~ 5 000 d to Z $\stackrel{<}{_{\sim }}$
20 and ~ 100 events per year.
$\stackrel{<}{_{\sim }}$
20 and ~ 100 events per year.
The unknowns in binary massive star evolution have recently received widespread attention with the detection of a massive binary inspiral (Abbott et al. 2016a). Understanding such events in the low-redshift Universe will enable us to better interpret high-redshift observations.
3 HIGH Z SNE
Does the collapse of pristine gas in the early Universe lead to the formation of very massive stars? Larson (Reference Larson1998), Heger & Woosley (Reference Heger and Woosley2002), O’Shea & Norman (Reference O’Shea and Norman2007, Reference O’Shea and Norman2008) have considered the possibility and the notion of a different initial mass function (IMF) from today’s. Wide-area, deep surveys are seeing a rare class of SLSNe, 10–100 times more luminous than typical SNe (Quimby et al. Reference Quimby2011; Gal-Yam Reference Gal-Yam2012). However, only $\stackrel{>}{_{\sim }}$
50 SLSNe have been detected at low Z (Nicholl et al. Reference Nicholl2015, Smith et al. Reference Smith2007; GYL 2009; Pastorello et al. Reference Pastorello2010; Gezari et al. Reference Gezari2009). One of these events with slow fade was thought to be powered by the radiative decay of 56Ni (Gal-Yam et al. Reference Gal-Yam2009). A single event has been identified as the first detection of a third type of SN with a pair-instability supernova (PISN). As discussed above, SLSNe might to occur with higher rate at earlier times, due to the presence of pristine gas and a top-heavy IMF, which favours the creation of massive stars. Overall, according to Tescari et al. (Reference Tescari2014) and Katsianis et al. (Reference Katsianis2015), an efficient feedback mechanism is needed to obtain the observed star-formation rate functions and stellar mass functions at high redshifts and SLSN maybe could play a major role.
$\stackrel{>}{_{\sim }}$
50 SLSNe have been detected at low Z (Nicholl et al. Reference Nicholl2015, Smith et al. Reference Smith2007; GYL 2009; Pastorello et al. Reference Pastorello2010; Gezari et al. Reference Gezari2009). One of these events with slow fade was thought to be powered by the radiative decay of 56Ni (Gal-Yam et al. Reference Gal-Yam2009). A single event has been identified as the first detection of a third type of SN with a pair-instability supernova (PISN). As discussed above, SLSNe might to occur with higher rate at earlier times, due to the presence of pristine gas and a top-heavy IMF, which favours the creation of massive stars. Overall, according to Tescari et al. (Reference Tescari2014) and Katsianis et al. (Reference Katsianis2015), an efficient feedback mechanism is needed to obtain the observed star-formation rate functions and stellar mass functions at high redshifts and SLSN maybe could play a major role.
Physical models of SLSNe include PISNe, magnetars, quark novae, radiatively shocked circumstellar matter, and jet-cocoon structures. The energy output may be as high as 1055 − 56 ergs, exceeding the main sequence radiated energy of 100 M⊙ stars at 1054 ergs. Models involving more than one of the concepts outlined below have been considered by Tolstov et al. (Reference Tolstov2017), Gal-Yam (Reference Gal-Yam2016), and Gilmer et al. (Reference Gilmer2016).
3.1. The PISN concept
PISNe have been theorised since the 1960s (Rakavy & Shaviv Reference Rakavy and Shaviv1967; Barkat, Rakavy, & Sack Reference Barkat, Rakavy and Sack1967) as the result of the deaths of stars with progenitor masses of 140–260 M⊙ (Heger & Woosley Reference Heger and Woosley2002; Kasen, Woosley, & Heger Reference Kasen, Woosley and Heger2011). Stars this massive generate conditions in their cores that enable efficient conversion of γ-ray photons into electron–positron pairs, followed by rapid conversion of pressure-supporting radiation into rest mass, violent contraction, and run-away thermonuclear explosion, obliterating the star (Kozyreva et al. Reference Kozyreva2017; Chatzopoulos et al. Reference Chatzopoulos2015).
A number of events are candidates for PISN, including SN2007bi (Gal-Yam et al. Reference Gal-Yam2009). For example, Lunnan et al. (Reference Lunnan2016) discuss a number of 07bi-like PISN candidates, and they have rise photometry, one of the key discriminants. The two high redshift SLSNe of Cooke et al. (Reference Cooke2012) are perhaps the most robust PISN candidates known, in particular, the redshift 2 event.
3.2. Magnetars, quark novae
Energy injection by a magnetar with a rapid rotation rate and magnetic field of 0.1–1 × 10¹⁴ G may supply excess luminosity. Chatzopoulos et al. (Reference Chatzopoulos2016) argue that this requires fine-tuning and extreme parameters for the magnetar, as well as the assumption of efficient conversion of magnetar energy into radiation.
Ouyed et al. (Reference Ouyed2016) show that a quark nova (the explosive transition of a neutron star to a quark star) occurring a few days following the SN explosion of an oxygen Wolf–Rayet star can account for SLSNe, including extreme energetics and a double-peaked light-curve. The expanding remnant is used to harness the kinetic energy (> 1052 ergs) of the ejecta.
3.3. Radiatively shocked circumstellar matter and jet-cocoon structures
Blinnikov (Reference Blinnikov2016) reviews calculations, not only of the magnetar model and PISNe, but also models explaining SLSN events with the minimum energy budget, involving multiple ejections of mass in presupernova stars. The radiative shocks produced in collisions of those shells may provide the required power. This class of the models he refers to as ‘interacting’ SNe.
Matsumoto et al. (Reference Matsumoto2016) consider supermassive black holes at high redshift growing from DCBHs with masses ~ 105 M⊙, resulting from the collapse of SMSs. If a relativistic jet is launched from a DCBH, then it can break out of the collapsing SMS and produce a GRB. Although most GRB jets may miss our line of sight, they show that the energy injected from the jet into a cocoon is huge ~ 1055 − 56 erg, so that the cocoon fireball is observed as an ultra-luminous supernova of ~ 1045 − 46 erg s−1.
4 OBSERVING HIGH-REDSHIFT SLSNE
Two SLSNe at Z ~ 2 have been observed: a slow evolving PISN event (Cooke et al. Reference Cooke2012) and another SLSN-I type event. Other surveys for high Z SLSNe include the ‘All-Sky Automated Survey for Supernovae’ (ASAS-SN; Brown & Warren-Son Holoien Reference Brown and Warren-Son Holoien2016), the Palomar Transient Factory (Perley et al. Reference Perley2016), Subaru HSC surveys (Tanaka et al. Reference Tanaka2016), and GAIA (Staley & Fender Reference Staley and Fender2016). The SUperluminous Supernova Host galaxIES (SUSHIES) survey (Schulze et al. 2016) aims to provide constraints on the progenitors of SLSNe by understanding the relationship to their host galaxies. Appendix A reports on the DECam Deep Fields programme. Mould et al. (Reference Mould2017) report the discovery of a Z ≈ 6 SLSN in the NSF field.
4.1. SLSN rates
The rate of core collapse SNe is proportional to the star-formation rate and affected by the IMF. Many studies have been made at Z < 0.3 (e.g., Bazin et al. 2009); few at higher Z. Most core collapse SNe are too faint, although luminous type IIn and SLSNe are an exception. SLSNe are extremely luminous in the UV (Brown Reference Brown2016, Yan et al. Reference Yan2016), whereas type Ia are not. Therefore, objects are expected to be detectable at high z. Cooke et al. (Reference Cooke2012) suggest that, at Z ~ 2–4, the SLSN rate is ~ 4 × 10⁻⁷ Mpc−3 yr−1. This is $\stackrel{<}{_{\sim }}$
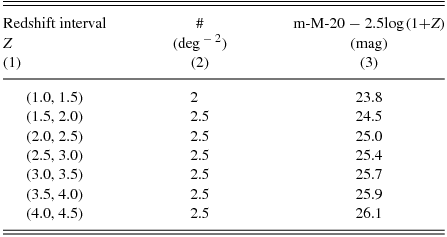
0.1% of the total core collapse SN rate at 0.9 < Z < 1.3 found by Dahlen et al. (Reference Dahlen2012). The Z dependence of the SLSN rate has been predicted by Tanaka et al. (Reference Tanaka2012). At this rate, the surface density of SLSNe is given in column (2) of Table 1. For DECam, these objects are quite faint by redshift 4 (see column 3), but not beyond reach.
$\stackrel{<}{_{\sim }}$
0.1% of the total core collapse SN rate at 0.9 < Z < 1.3 found by Dahlen et al. (Reference Dahlen2012). The Z dependence of the SLSN rate has been predicted by Tanaka et al. (Reference Tanaka2012). At this rate, the surface density of SLSNe is given in column (2) of Table 1. For DECam, these objects are quite faint by redshift 4 (see column 3), but not beyond reach.
Table 1. Expected number of SLSNe deg−2.
5 OTHER DECAM RESULTS
5.1. GW150914
We observed the Prime Field (Table 2) 107 d after LIGO’s first detection of a binary black hole inspiral (Abbott et al. 2016a). The error box for GW150914 includes the prime field. The brightest objects present after the event and not present in 2012, 2013 with colours that exclude flare stars have Z ≈ 17.5 i.e., M Z ≈ –20.5 at the distance of the event. However, the binary black hole merger model predicts no electromagnetic counterpart for the event (Abbott et al. Reference Abbott2016b). A brightening of at least 7.5 mag was generally seen for these objects, which were most likely SNe.
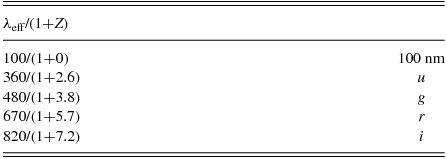
Table 2. Dropout bandpass vs. redshift.
5.2. Large scale structure
Our first two nights of the DECamERON project yielded data on the prime field. Candidate i band dropouts have $Z \stackrel{>}{_{\sim }}$
6 and their structure across the 3 deg2 field is far from uniform (Figure 1). Details are given by Mould (Reference Mould2013). The colour–magnitude diagram was shown by Mould (Reference Mould2015). Figure 1 is similar to that of Barone-Nugent et al. (Reference Barone-Nugent2014). Reionisation lights up the gas on comoving scales of a few Mpc and more (Geil et al. Reference Geil2016). This is accessible to the DECam Deep Field project.
$Z \stackrel{>}{_{\sim }}$
6 and their structure across the 3 deg2 field is far from uniform (Figure 1). Details are given by Mould (Reference Mould2013). The colour–magnitude diagram was shown by Mould (Reference Mould2015). Figure 1 is similar to that of Barone-Nugent et al. (Reference Barone-Nugent2014). Reionisation lights up the gas on comoving scales of a few Mpc and more (Geil et al. Reference Geil2016). This is accessible to the DECam Deep Field project.

Figure 1. Angular correlation function for the NSF field. The scale at redshift 6 is 5.8 kpc arcsec−1.
5.3. Detection of SLSNe
Two of us (CC and JC) are working with SUDSS (Scovacricchi et al. 2016), using Lyman Break Galaxy (LBG) colour cuts for Z = 3. For present purposes, we modified these for higher redshift. The NSF field (Table 2) was drawn from SUDSS to increase the cadence. For Z = 3.5–4.8, these cuts are g − r>r − i + 0.8; g − i> 0.3; –0.7 <r − i< 1.2; –0.4 <i − z< 0.2. These need further refinement. Figures A1–A3 (Appendix A) show our Z = 4 candidates. Mould et al. (Reference Mould2017) report the discovery of a Z ≈ 6 SLSN in the NSF field based upon bandpass redshifts in Table 3.
Table 3. DECamERON programme (exposure times in kilosec).
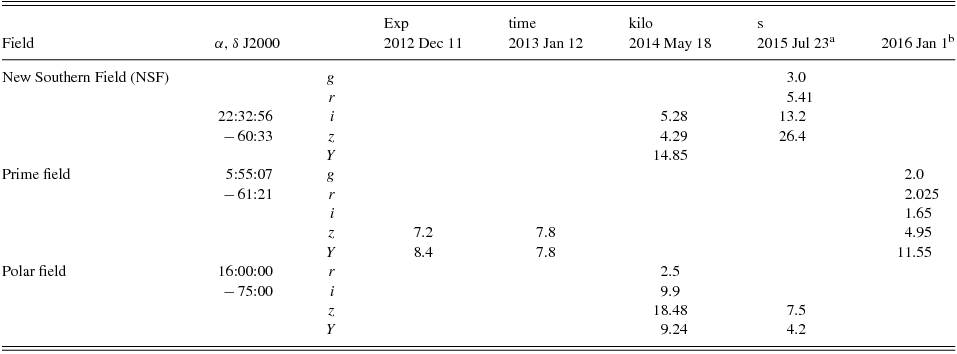
aalso 28/12
balso 8/8
6 HIGHER Z (TOWARDS THE DARK AGES)
There is absolutely no observational data on the stellar Universe at z ~ 20. Events at z > 20 need near infrared K-band observations. For this purpose, we can call on the low background and remarkable isoplanatism in Antarctica (Aristidi et al. 2013) to conduct wide field K-band time domain surveys. Spectroscopically, by the end of the decade, we shall have JWST to detect some of these SLSNe at redshifts all the way to Z ~ 20. While the explosion of first-generation stars is of fundamental importance, the rate of SLSNe at Z ~ 20 is highly uncertain and a low rate may limit the discovery space of JWST. The deep NIR survey to K = 29th mag proposed by WangFootnote 1 (Reference Wang2009) would be an excellent target feeder for JWST.
7 CONCLUSIONS
What we have seen in this brief review is a recent proliferation of SLSNe and a number of mechanisms that could be at work making them. The first 4 yrs of the DECamERON project suggest that DECam, like HSC, can penetrate the EoR. Large scale structure data are consistent with that of other programmes. There is every expectation that LBG and dropout selection criteria will allow EoR SLSNe to be found. Time dilation of high Z light curves allows economical observing. We plan to press on to investigate the fascinating scientific questions posed by the evolutionary end points of massive stars in the EoR. Among these are the possibility of using SLSNe for cosmology (Scovacricchi et al. Reference Scovacricchi2016). The best route at higher Z may be to search for ‘orphan’ SLSNe that have the correct colours and then use very deep (JWST) spectroscopy to confirm the redshift.
ACKNOWLEDGEMENTS
We are grateful to the DES team for building DECam and the NVO at NOAO for flattening and stacking our data. Parts of this research were conducted by the Australian Research Council Centre of Excellence for All-sky Astrophysics (CAASTRO), through project number CE110001020. In addition to DAOPHOT, we used IRAF, a product of NOAO, which is operated by AURA and supported by NSF. Thanks also to our colleagues Stuart Wyithe, Chris Lidman, Michele Trenti, Robert Barone Nugent, and Andrea Kunder.
The DECamERON project used data obtained with the Dark Energy Camera, which was constructed by the Dark Energy Survey (DES) collaboration. Funding for the DES Projects has been provided by the DOE and NSF (USA), MISE (Spain), STFC (UK), HEFCE (UK). NCSA (UIUC), KICP (U. Chicago), CCAPP (Ohio State), MIFPA (Texas A&M), CNPQ, FAPERJ, FINEP (Brazil), MINECO (Spain), DFG (Germany), and the collaborating institutions in the Dark Energy Survey, which are Argonne Lab, UC Santa Cruz, University of Cambridge, CIEMAT-Madrid, University of Chicago, University College London, DES-Brazil Consortium, University of Edinburgh, ETH Zurich, Fermilab, University of Illinois, ICE (IEEC-CSIC), IFAE Barcelona, Lawrence Berkeley Lab, LMU Munchen and the associated Excellence Cluster Universe, University of Michigan, NOAO, University of Nottingham, Ohio State University, University of Pennsylvania, University of Portsmouth, SLAC National Lab, Stanford University, University of Sussex, and Texas A&M University.
Appendix A
Dark Energy Camera on the Blanco 4-m telescope not only has the focal plane size, the 1970s 4 m-telescopes were built for, but also has good near infrared response. The goal of the DECamERON projectFootnote 2 is a deep wide field high redshift photometric survey to study large scale structure and rare events. It reaches M* galaxies at redshift 6 at a wavelength of 1 micron, studying large scale structure and finding rare events. The aim is not to compete with deeper narrow surveys like BORG (Trenti et al. 2010). To maximise time allocation flexibility, all three of these DECam deep fields are circumpolar. Stacking of data is carried out by the DECam community pipeline (Valdes et al. 2014). Here, we report candidates for SNe at Z = 4 in the prime field. The light curves shown on the right are Z band. Pipeline stacks are archived in nine tiles of approximately 50 arcmin on a side. These tiles form a 3 × 3 matrix on the sky with tiles 1, 5, 9 as the main diagonal.
The postage stamps are Y band images. Images of the same epoch are aligned in columns. In Figures A1–A3, we see SNe that are bright in the first epoch, leaving only the host galaxy in the most recent epoch.

Figure A1. Tile 2 Z = 4 candidates.

Figure A2. Tile 5 Z = 4 candidates.

Figure A3. Tile 8 Z = 4 candidates.


