


1. Introduction
During plant mitosis, the cytoskeleton is reorganised in plant-specific structures that allow the separation of the mother cell into two daughter cells by the centrifugal growth of a new wall. Whilst the role of the actin cytoskeleton is of prime importance for animal cell division, the green cells require mostly microtubules in the early step of the cell division. Indeed, the plant cells can divide in the absence of F-actin (Baluska et al., Reference Baluska, Jasik, Edelmann, Salajova and Volkmann2001; Nishimura et al., Reference Nishimura, Yokota, Wada, Shimmen and Okada2003) and division still occurs in the presence of mutations in genes encoding actin or various actin-associated proteins (Jürgens, Reference Jürgens2005). Before mitosis, the migration of the nucleus is not prevented by the cytochalasin D, a drug that disrupted the actin filaments (F-actin), suggesting that microtubules play an important role in this process (Katsuta et al., Reference Katsuta, Hashiguchi and Shibaoka1990). Yet, the actin cytoskeleton is found early during division with the formation of an actin ring at the cortex of the cell in preprophase, the actin preprophase band (PPB) which is considered to be wider than the microtubules PPB (Palevitz, Reference Palevitz1987).
The formation of actin PPB depends on microtubules because the application of microtubules-depolymerizing drugs prevents the formation of both the microtubules and F-actin components of the PPB (Palevitz, Reference Palevitz1987). However, actin PPB can also affect the microtubules PPB because actin depolymerisation results in drastic enlargement of the microtubules PPB and fluctuating division planes (Mineyuki & Palevitz, Reference Mineyuki and Palevitz1990). As the microtubules PPB narrows, the actin PPB narrows, and when the microtubules PPB reach their narrowest configuration, the fluorescence signals of F-actin start to disappear from the cell cortex region occupied by the microtubules PPB, giving rise to the actin-depleted zone (Cleary et al., Reference Cleary, Gunning, Wasteneys and Hepler1992; Liu & Palevitz, Reference Liu and Palevitz1992). In tobacco BY-2 cell culture cells, this actin-depleted zone is unambiguously visible and flanked by enrichments of F-actin whilst this depleted zone was not yet visualised in plant cells embedded in their tissues. Whether the actin-depleted zone coincides with the cortical division zone which acts as a landmark for the future cell division site is still unclear. Nevertheless, the actin-depleted zone is short-lived from metaphase through the anaphase/telophase transition (Clayton & Lloyd, Reference Clayton and Lloyd1985; Kakimoto & Shibaoka, Reference Kakimoto and Shibaoka1987).
Whilst cytokinesis is progressing, the phragmoplast that guides the delivery of vesicles to form the expanding cell plate is composed of both microtubules and actin filaments (Staehelin & Hepler, Reference Staehelin and Hepler1996). Live-cell imaging over time in BY2 cells revealed that F-actin was involved in endoplasmic reticulum accumulation in the phragmoplast at the late phase (Higaki et al., Reference Higaki, Kutsuna, Sano and Hasezawa2008). Tobacco BY-2 cells treated with F-actin-depolymerizing drugs show disorganised phragmoplasts and wrinkled cell plates (Higaki et al., Reference Higaki, Kutsuna, Sano and Hasezawa2008; Hoshino et al., Reference Hoshino, Yoneda, Kumagai and Hasezawa2003; Kojo et al., Reference Kojo, Higaki, Kutsuna, Yoshida, Yasuhara and Hasezawa2013; Sano et al., Reference Sano, Higaki, Oda, Hayashi and Hasezawa2005; Yoneda et al., Reference Yoneda, Akatsuka, Kumagai and Hasezawa2004), which uncover the role of the F-actin during plant cytokinesis.
Because F-actin and microtubules closely co-exist and play important roles in the phragmoplast (Smith, Reference Smith1999), cooperation or interaction between actin and microtubules cytoskeletons is assumed, and several proteins have been proposed to mediate the cooperation or interaction between actin and microtubules cytoskeletons (Buschmann et al., Reference Buschmann, Green, Sambade, Doonan and Lloyd2011; Igarashi et al., Reference Igarashi, Orii, Mori, Shimmen and Sonobe2000; Klotz & Nick, Reference Klotz and Nick2012; Maeda et al., Reference Maeda, Sasabe, Hanamata, Machida, Hasezawa and Higaki2020; Schwab et al., Reference Schwab, Mathur, Saedler, Schwarz, Frey, Scheidegger and Hülskamp2003). In particular, the moss myosin VIII, a motor protein that interacts with both actin and microtubules, localises to the division site and the phragmoplast, linking microtubules to the cortical division zone via actin cytoskeleton (Wu & Bezanilla, Reference Wu and Bezanilla2014). These findings, together with other reports in which drug treatments and localization studies were performed (Lloyd & Traas, Reference Lloyd and Traas1988; Molchan et al., Reference Molchan, Valster and Hepler2002; Takeuchi et al., Reference Takeuchi, Karahara, Kajimura, Takaoka, Murata, Misaki, Yonemura, Staehelin and Mineyuki2016), highlight that the actin cytoskeleton may interact with the microtubules bridging the cell cortex and the phragmoplast during cytokinesis.
Early work using immunolocalization and gold immunolabelling of the actin cytoskeleton revealed the presence of a meshwork of F-actin that concentrated at the cortex of the cell, on the side facing the spindle poles (Cho & Wick, Reference Cho and Wick1991; Mole-Bajer et al., Reference Mole-Bajer, Bajer and Inoue1988, Caillaud Reference Caillaud2022). Recently, super-resolved imaging of the F-actin was performed using a photo-activatable Lifeact, a 17-amino-acid peptide that stained F-actin structures in BY2 cells (Durst et al., Reference Durst, Hedde, Brochhausen, Nick, Nienhaus and Maisch2014). Using this approach, a gradient of the Lifeact–psRFP signal was observed that progressively led to a clear increase of signal intensity towards the cell poles, especially during the later mitotic phases (Durst et al., Reference Durst, Hedde, Brochhausen, Nick, Nienhaus and Maisch2014). However, the dynamic of such polarisation was not yet reported in dividing plant cells surrounded by its tissue.
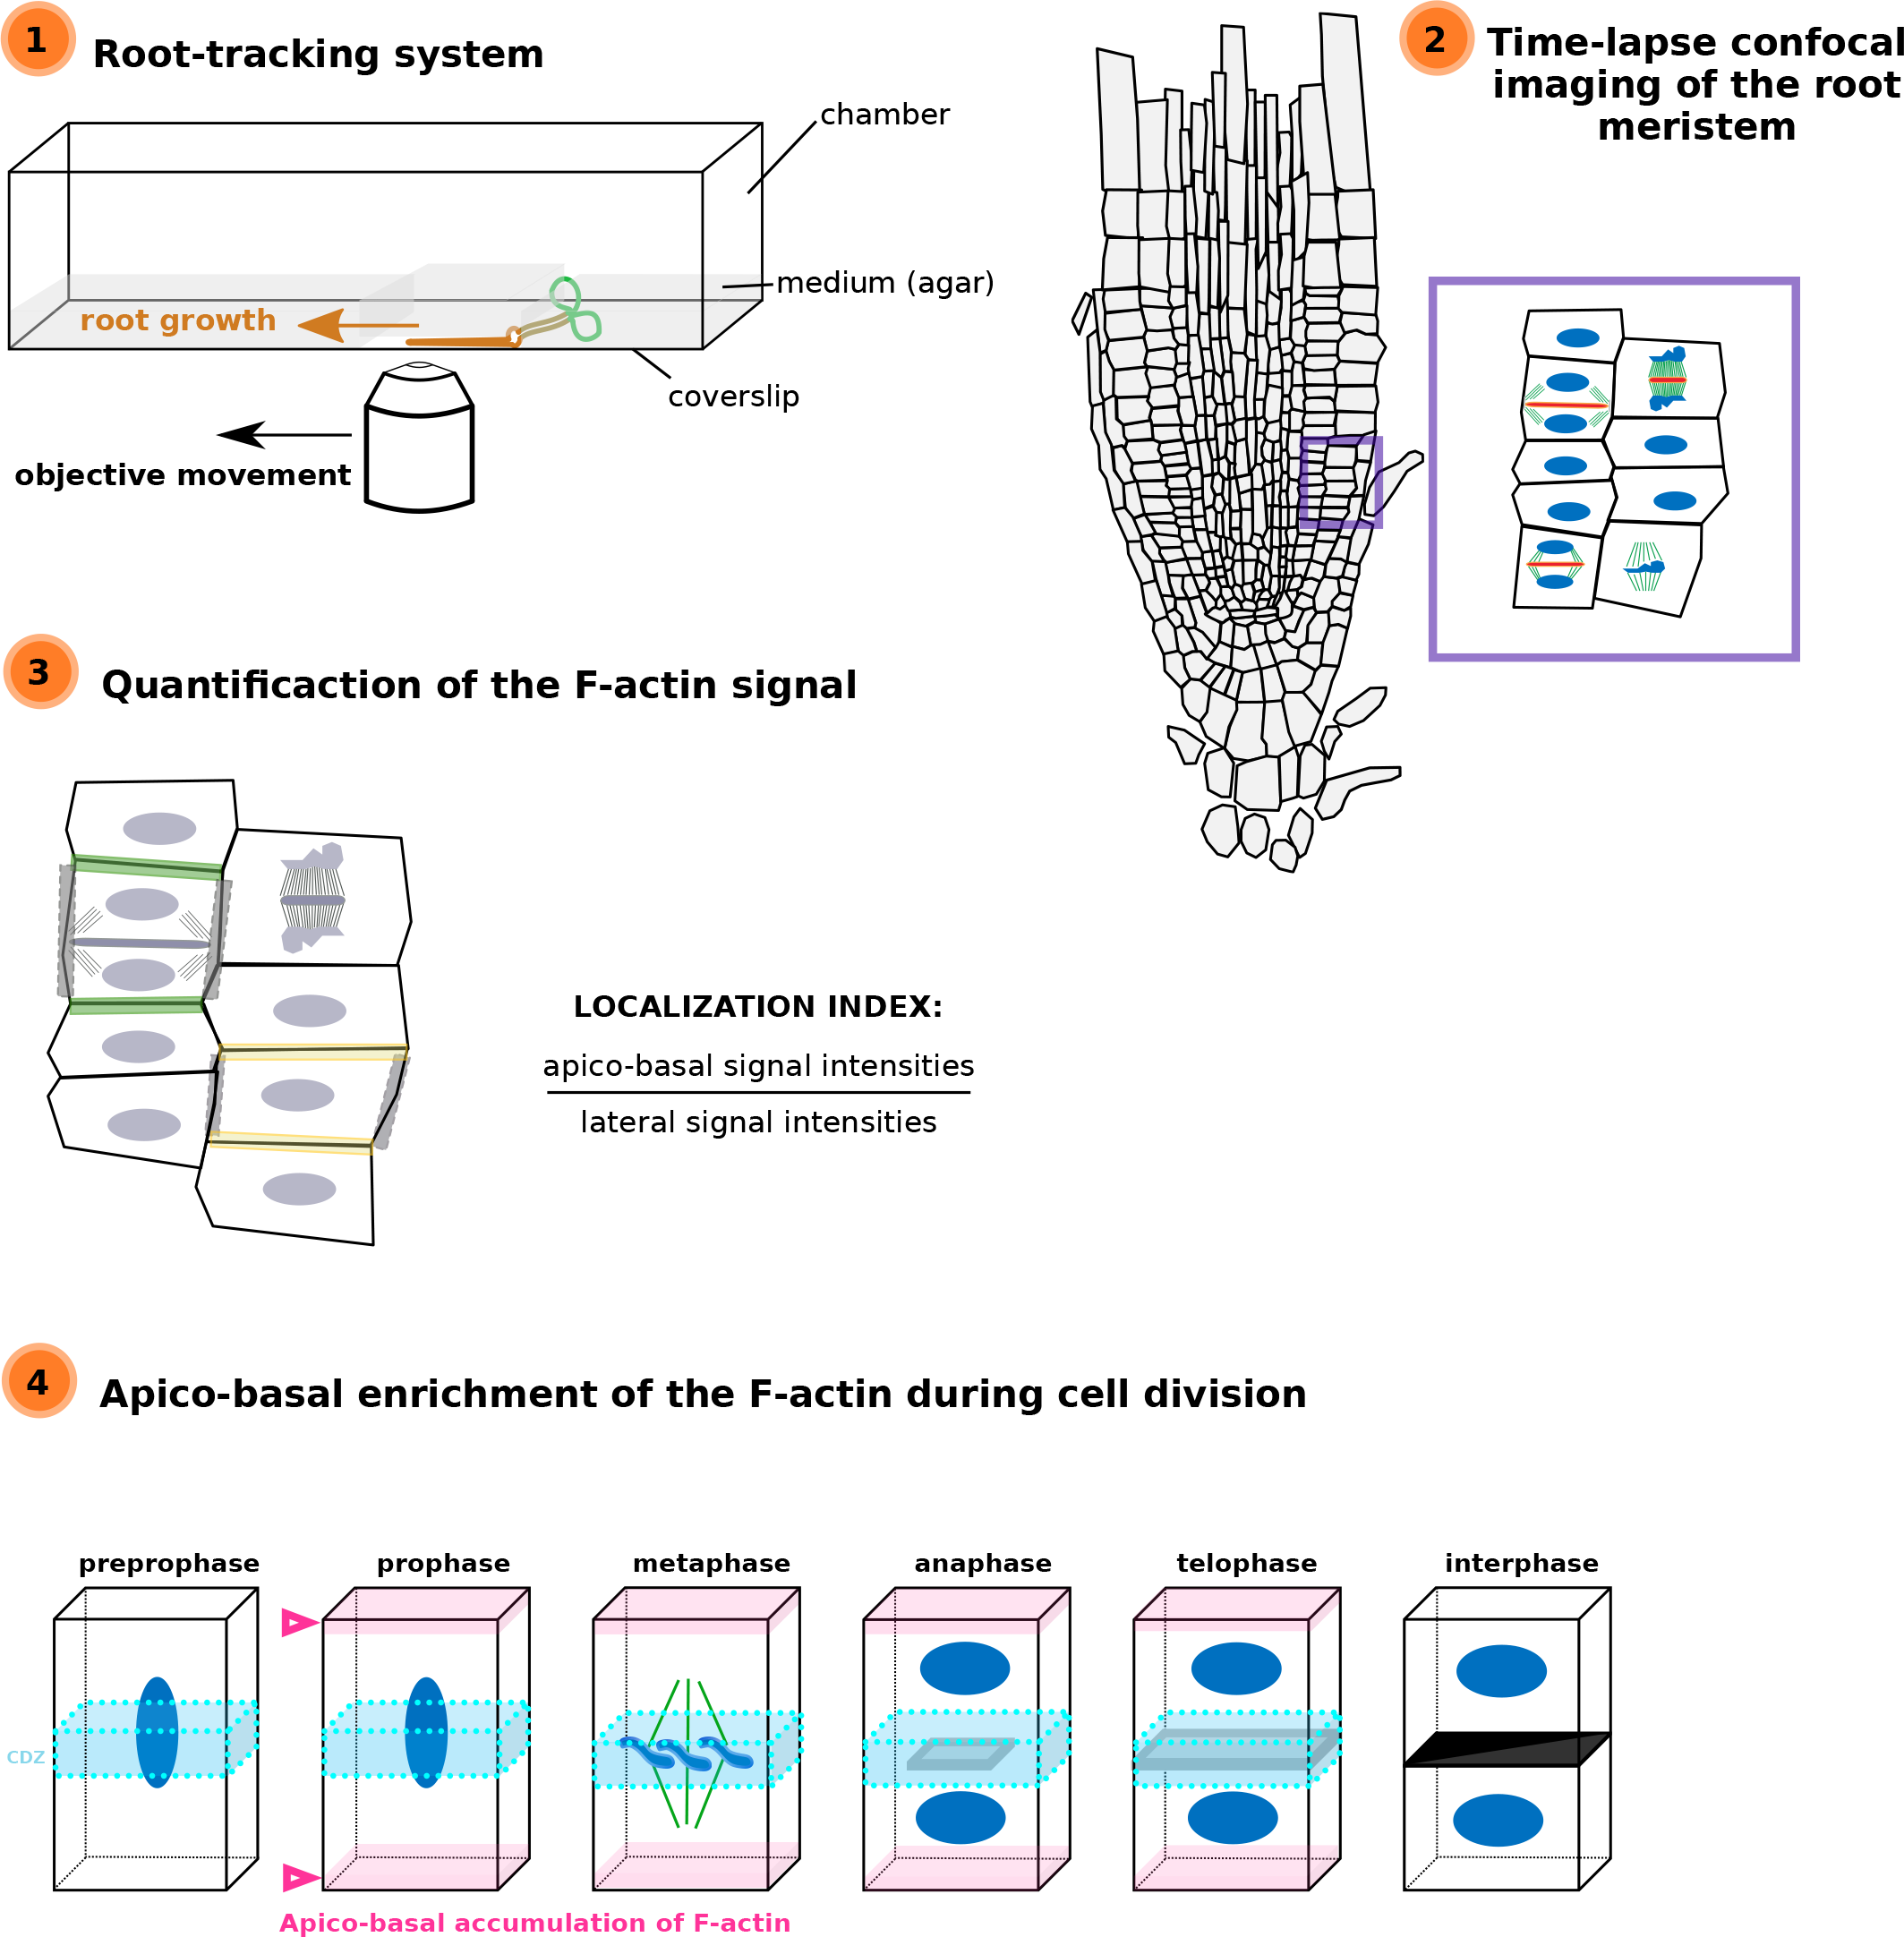
Here, we used our recently developed root tracking system to follow actin dynamics in dividing Arabidopsis meristematic root cells. By the visualisation of the fluorescent-tagged Lifeact together with cell division markers, we observed an apico-basal accumulation of the F-actin from the prophase/anaphase transition until the late stage of cytokinesis in Arabidopsis root meristematic cells. The role and the possible actors responsible for this actin enrichment are discussed.
2. Methods
2.1. Growth condition and plant materials
Arabidopsis Columbia-0 (Col-0) accession was used as a reference genomic background throughout this study. Arabidopsis seedlings in vitro on half Murashige and Skoog (½ MS) basal medium supplemented with 0.8% plant agar (pH 5.7) in continuous light conditions at 21°C. Plants were grown in soil under long-day conditions at 21°C and 70% humidity 16 hr daylight.
2.2. Cloning
The lifeact sequence was flanked with attB2R and attB3 sequences and recombined by BP gateway reaction into pDONR221. Final destination vectors (UBQ10prom/P5’, LifeAct/pDON221, 2xmTU2/pDONR-P3’) were obtained using three fragments LR recombination system (life technologies, www.lifetechnologies.com/) using pK7m34GW destination vector (Karimi et al., Reference Karimi, Depicker and Hilson2007).
2.3. Plant materials
The transgenic lines used in this study are described in the Table 1.
Table 1 Transgenic lines used in this study.

2.4. Spinning-disk microscopy imaging
Images of the time-lapse images were acquired with the following spinning disk confocal microscope set up: inverted Zeiss microscope (AxioObserver Z1, Carl Zeiss Group, http://www.zeiss.com/) equipped with a spinning disk module (CSU-W1-T3, Yokogawa, www.yokogawa.com) and a ProEM+ 1024B camera (Princeton Instrument, http://www.princetoninstruments.com; Figure 2 only) or Camera Prime 95B (www.photometrics.com) using a 63× Plan-Apochromat objective (numerical aperture 1.4, oil immersion). The mTURQUOISE2 was excited with a 445 nm laser (80 mW) and fluorescence emission was filtered by a 482/35 nm BrightLine single-band bandpass filter (Semrock, http://www.semrock.com/), GFP and mCITRINE were excited with a 488 nm laser (150 mW) and fluorescence emission was filtered by a 525/50 nm BrightLine! a single-band bandpass filter (Semrock), tdTom/RFP was excited with a 561 nm laser (80 mW) and fluorescence emission was filtered by a 609/54 nm BrightLine! a single-band bandpass filter (Semrock, http://www.semrock.com/). For quantitative imaging, pictures of epidermal root meristem cells were taken with detector settings optimised for low background and no pixel saturation. Care was taken to use similar confocal settings when comparing fluorescence intensity or for quantification. Root tracking experiments were performed as described in Doumane et al. (Reference Doumane, Lionnet, Bayle, Jaillais and Caillaud2017).
The fluorescence intensity was obtained using the Fiji tool. A line of 96 pixels was drawn through the cell and the intensity of grey was plotted using the Plot Profile tool. The values were transferred in Excel to obtain the graph.
2.5. Statistical analysis
For localization index analysis, one dividing cell and a non-dividing cell were taken for each root (17 roots). For every two cells, the signal intensity was measured for the Apico-basal membranes, the two laterals membranes, and in two elliptical regions of interest (ROIs) of the cytosol (Tables 2 and 3). Ratios were obtained by taking the average of the two measured intensities. Localization index comparisons were performed using a Kruskal–Wallis rank sum test analysis in R (v. 3.6.1; R Core Team, 2019), using R studio interface and the packages ggplot2 (Wickham, 2016). Graphs were obtained with R and R-studio software and customised with Inkscape (https://inkscape.org).
Table 2 Statistical analysis corresponding to Figure 3c.

Table 3 Statistical analysis corresponding to Figure 3d.

Note: Comparison of all the conditions together using Kruskal–Wallis is reported in the left part of the table, whilst pair comparison after Kruskal–Wallis analysis using post Dunn test, method ‘Bonferroni’, are presented in the right part of the table. *The start highlights results with statistical differences.
Table 4 Statistical analysis corresponding to Figure 3e.
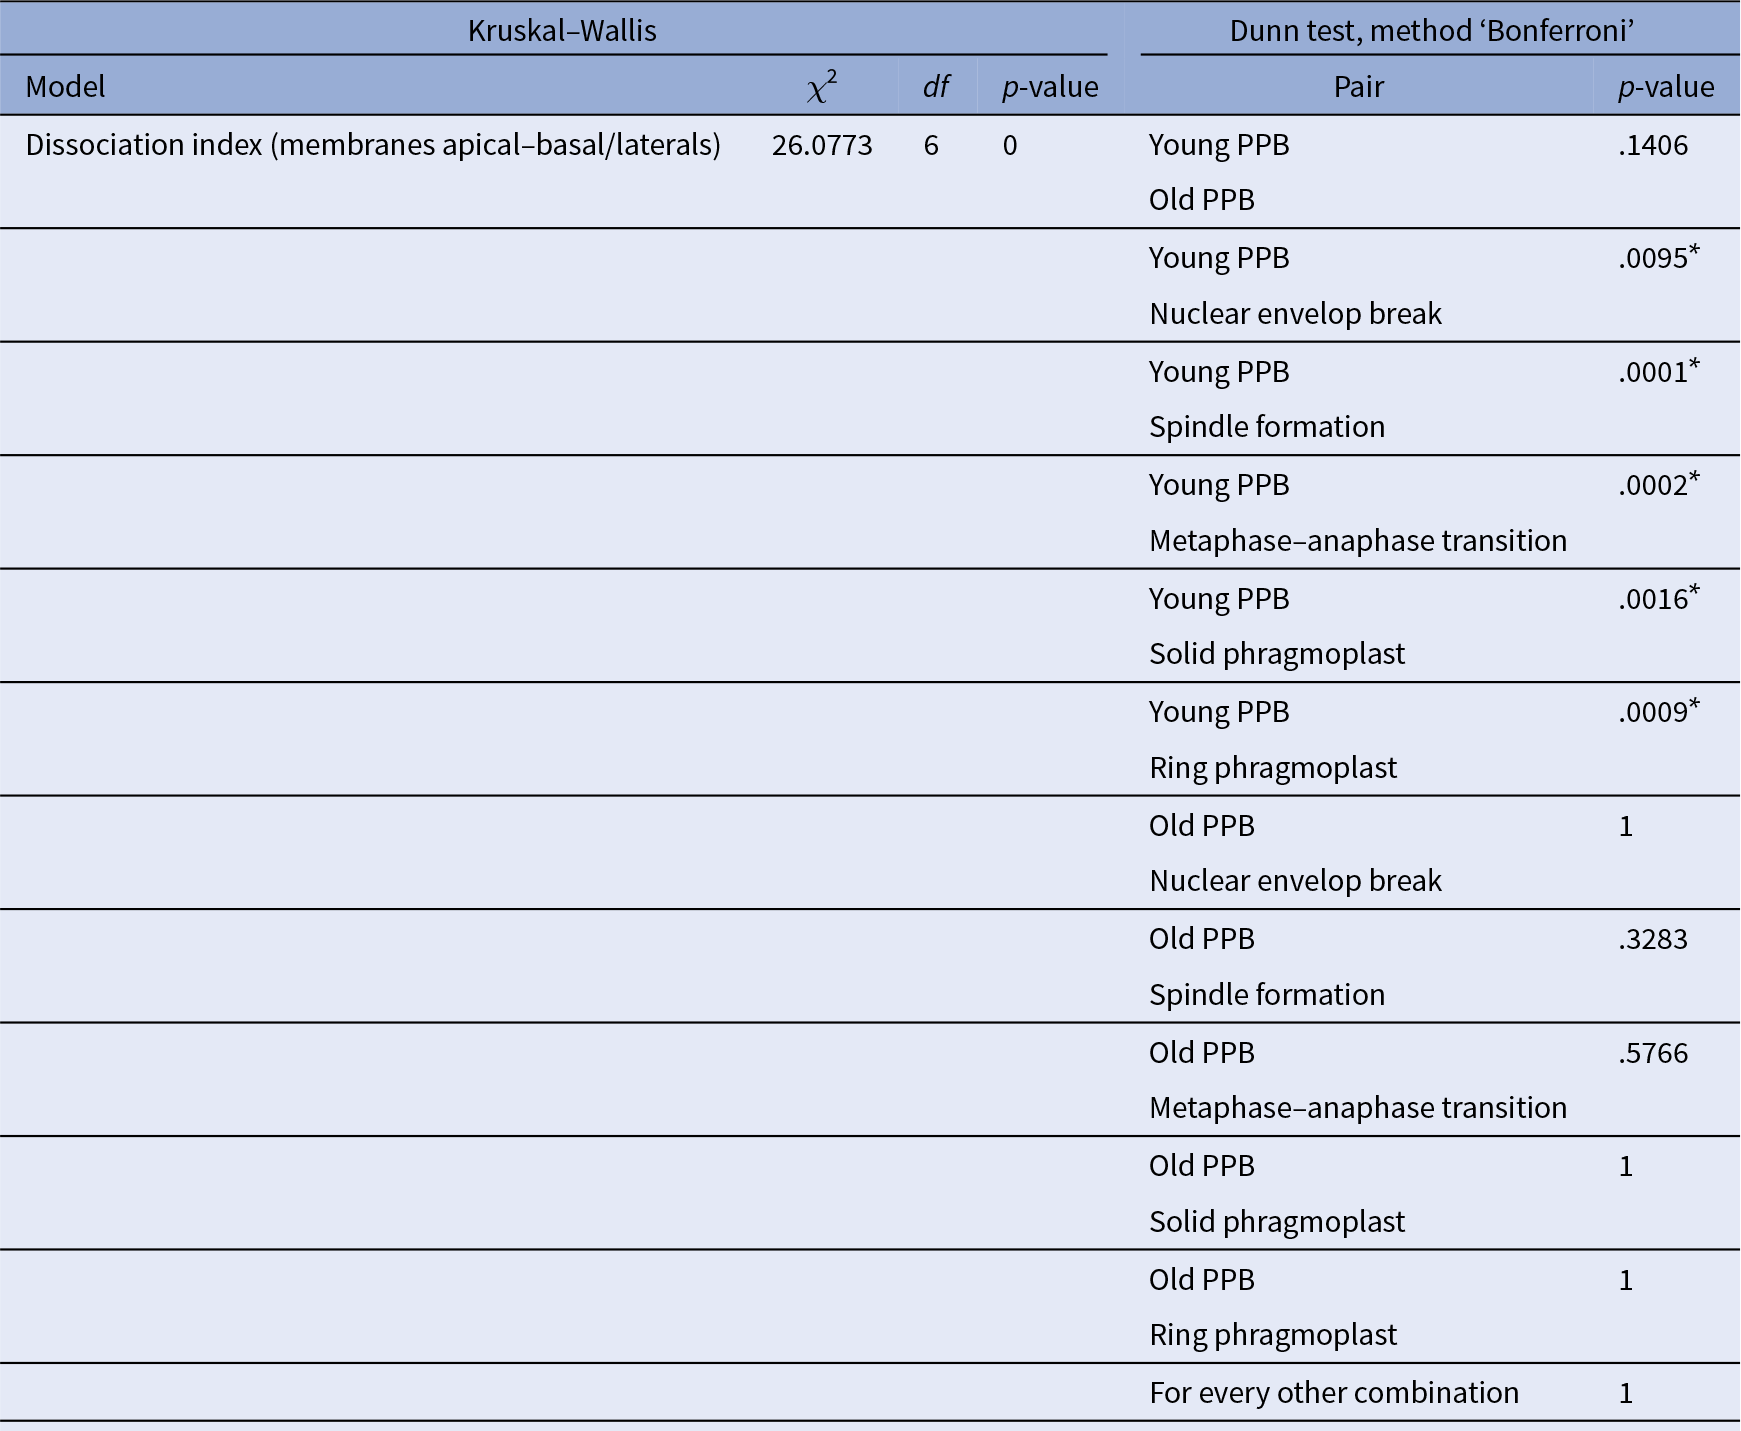
Note: Comparison of all the conditions together using Kruskal–Wallis is reported in the left part of the table, whilst pair comparison after Kruskal–Wallis analysis using post Dunn test, method ‘Bonferroni’, are presented in the right part of the table. *The start highlights results with statistical differences.
For F-actin accumulation analysis (Figure 3e), 2 hr time-lapse (2 min intervals between each acquisition) were made on 7 roots and 25 cells, at different dividing steps, were taken for the analysis. For each division figure, the image in which the dividing cell is at its maximum volume was extracted to perform a localization index (as previously described except that no non-dividing cells were taken). We consider PPB cells that do not enter in the division during the time-laps as ‘young PPBs’ and those who did as ‘old PPBs’. The ‘old PPBs’ localization index was performed between 6 and 2 min before nuclear envelope break. Statistical analyses were performed exactly as for Figure 3c,d (Table 4).
3. Results
In order to analyse in vivo the behaviours of the actin cytoskeleton in a dividing tissue, we collected a set of Lifeact fluorescent reporters (Table 1), tagged with YFPv (Doumane et al., Reference Doumane, Lebecq, Colin, Fangain, Stevens, Bareille, Hamant, Belkhadir, Munnik, Jaillais and Caillaud2021), tdTomato (Liao & Weijers, Reference Liao and Weijers2018). We generated a blue-tagged version of Lifeact with 2xmTURQUOISE2 (2xmTU2) under a Ub10 promoter (Ub10pro:Lifeact-2xmTU2). Using the recently developed root tracking system, we observed the behaviour of the actin cytoskeleton every 3 min in epidermal cells of Arabidopsis up to five root tips in one experiment, in three dimensions, using a spinning disk confocal microscope (Doumane et al., Reference Doumane, Lionnet, Bayle, Jaillais and Caillaud2017). We first analysed in time-lapse Arabidopsis meristematic root cells during division in plants expressing the actin marker Lifeact-YFPv (Figure 1). The z-projection of division tissues expressing the actin marker Lifeact-YFPv showed that during cytokinesis, the F-actin is clearly observed in the developing phragmoplast (Figure 1, empty arrows). Moreover, an apico-basal accumulation of Lifeact-YFPv during cytokinesis was visible in the dividing root tissues (Figure 1, white plain arrows), as it was previously reported (Voigt et al., Reference Voigt, Timmers, Samaj, Muller, Baluska and Menzel2005).

Figure 1. Representatives images of a z-projection of a time-lapse analysis in Arabidopsis root meristem, expressing Ub10:Lifeact-YFPv. White arrows, F-actin enrichment at the apico-basal part of the cells; empty arrows, F-actin in the phragmoplast; n, nucleus. Scale bar = 5 μm.
We confirmed the F-actin patterning during cell division obtained with the LifeAct-YFPv reporter with another well-characterised F-actin biosensor. We performed the same analysis with plants expressing the C-terminal half of the plant Fimbrin-like gene AtFim1 (aa 325–687) fused to the mGFP fluorescent protein (mGFP‐ABD2). Time-lapse analysis of the growing root Arabidopsis meristem expressing mGFP‐ABD2 displayed the same apico-basal accumulation of F-actin during cytokinesis (Figure 2).

Figure 2. Representatives images of a z-projection of a time-lapse analysis in Arabidopsis root meristem, expressing mGFP-ABD2. White arrows, F-actin enrichment at the apico-basal part of the cells; empty arrows, F-actin in the phragmoplast; n, nucleus. Scale bar = 5 μm.
We confirmed this result by projecting in the z-plane the cells and by changing the orientation to enable the observation of the apical–basal face of the dividing cell (Figure 3a). Using this approach, we confirmed that whilst the phragmoplast was extending, the Lifeact-2xmTU2 signal covered the entire apico-basal plane of the cell whilst no accumulation was observed in the lateral part of the cell (Figure 3b). During phragmoplast expansion, the signal at the apico-basal part of the cell stayed strong before the decrease in the fluorescence signal could be observed at the end of the cytokinesis (Figures 1–3).

Figure 3. (a) Representative images of a three-dimensional projection of a dividing cell in Arabidopsis root meristem expressing Ub10:LifeAct-2xmTU2. White arrows, F-actin enrichment at the apico-basal part of the cells; empty arrows, F-actin in the phragmoplast; n, nucleus. The yellow arrows marked the four rotated images obtained by the rotation in ImageJ of the initial z-projected image presented in the left panel. Scale bar = 10 μm. (b) Representative images of the distribution of LifeAct-2xmTU2 in dividing cell and non-dividing cells used for the quantification. Scale bar = 15 μm. (c) Quantification of the localization index of LifeAct-2xmTU2 between the apico-basal part of the cell and the lateral part of the cell of dividing versus non-dividing cells. (d) Quantification of the localization index of LifeAct-2xmTU2 between the apico-basal or the lateral part of the cell and the cytoplasm of dividing versus non-dividing cells. (e) Quantification of the localization index of LifeAct-YFPv between the apico-basal or the lateral part of the cells at key steps of the cell division, visualised thanks to the microtubule marker RFP-MBD. In the plots, the middle horizontal bars represent the median, whilst the bottom and top of each box represent the 25th and 75th percentiles, respectively. At most, the whiskers extend to 1.5 times the IQR and exclude data beyond that range. For the range of values under 1.5 times the IQR, the whiskers represent the range of maximum and minimum values.
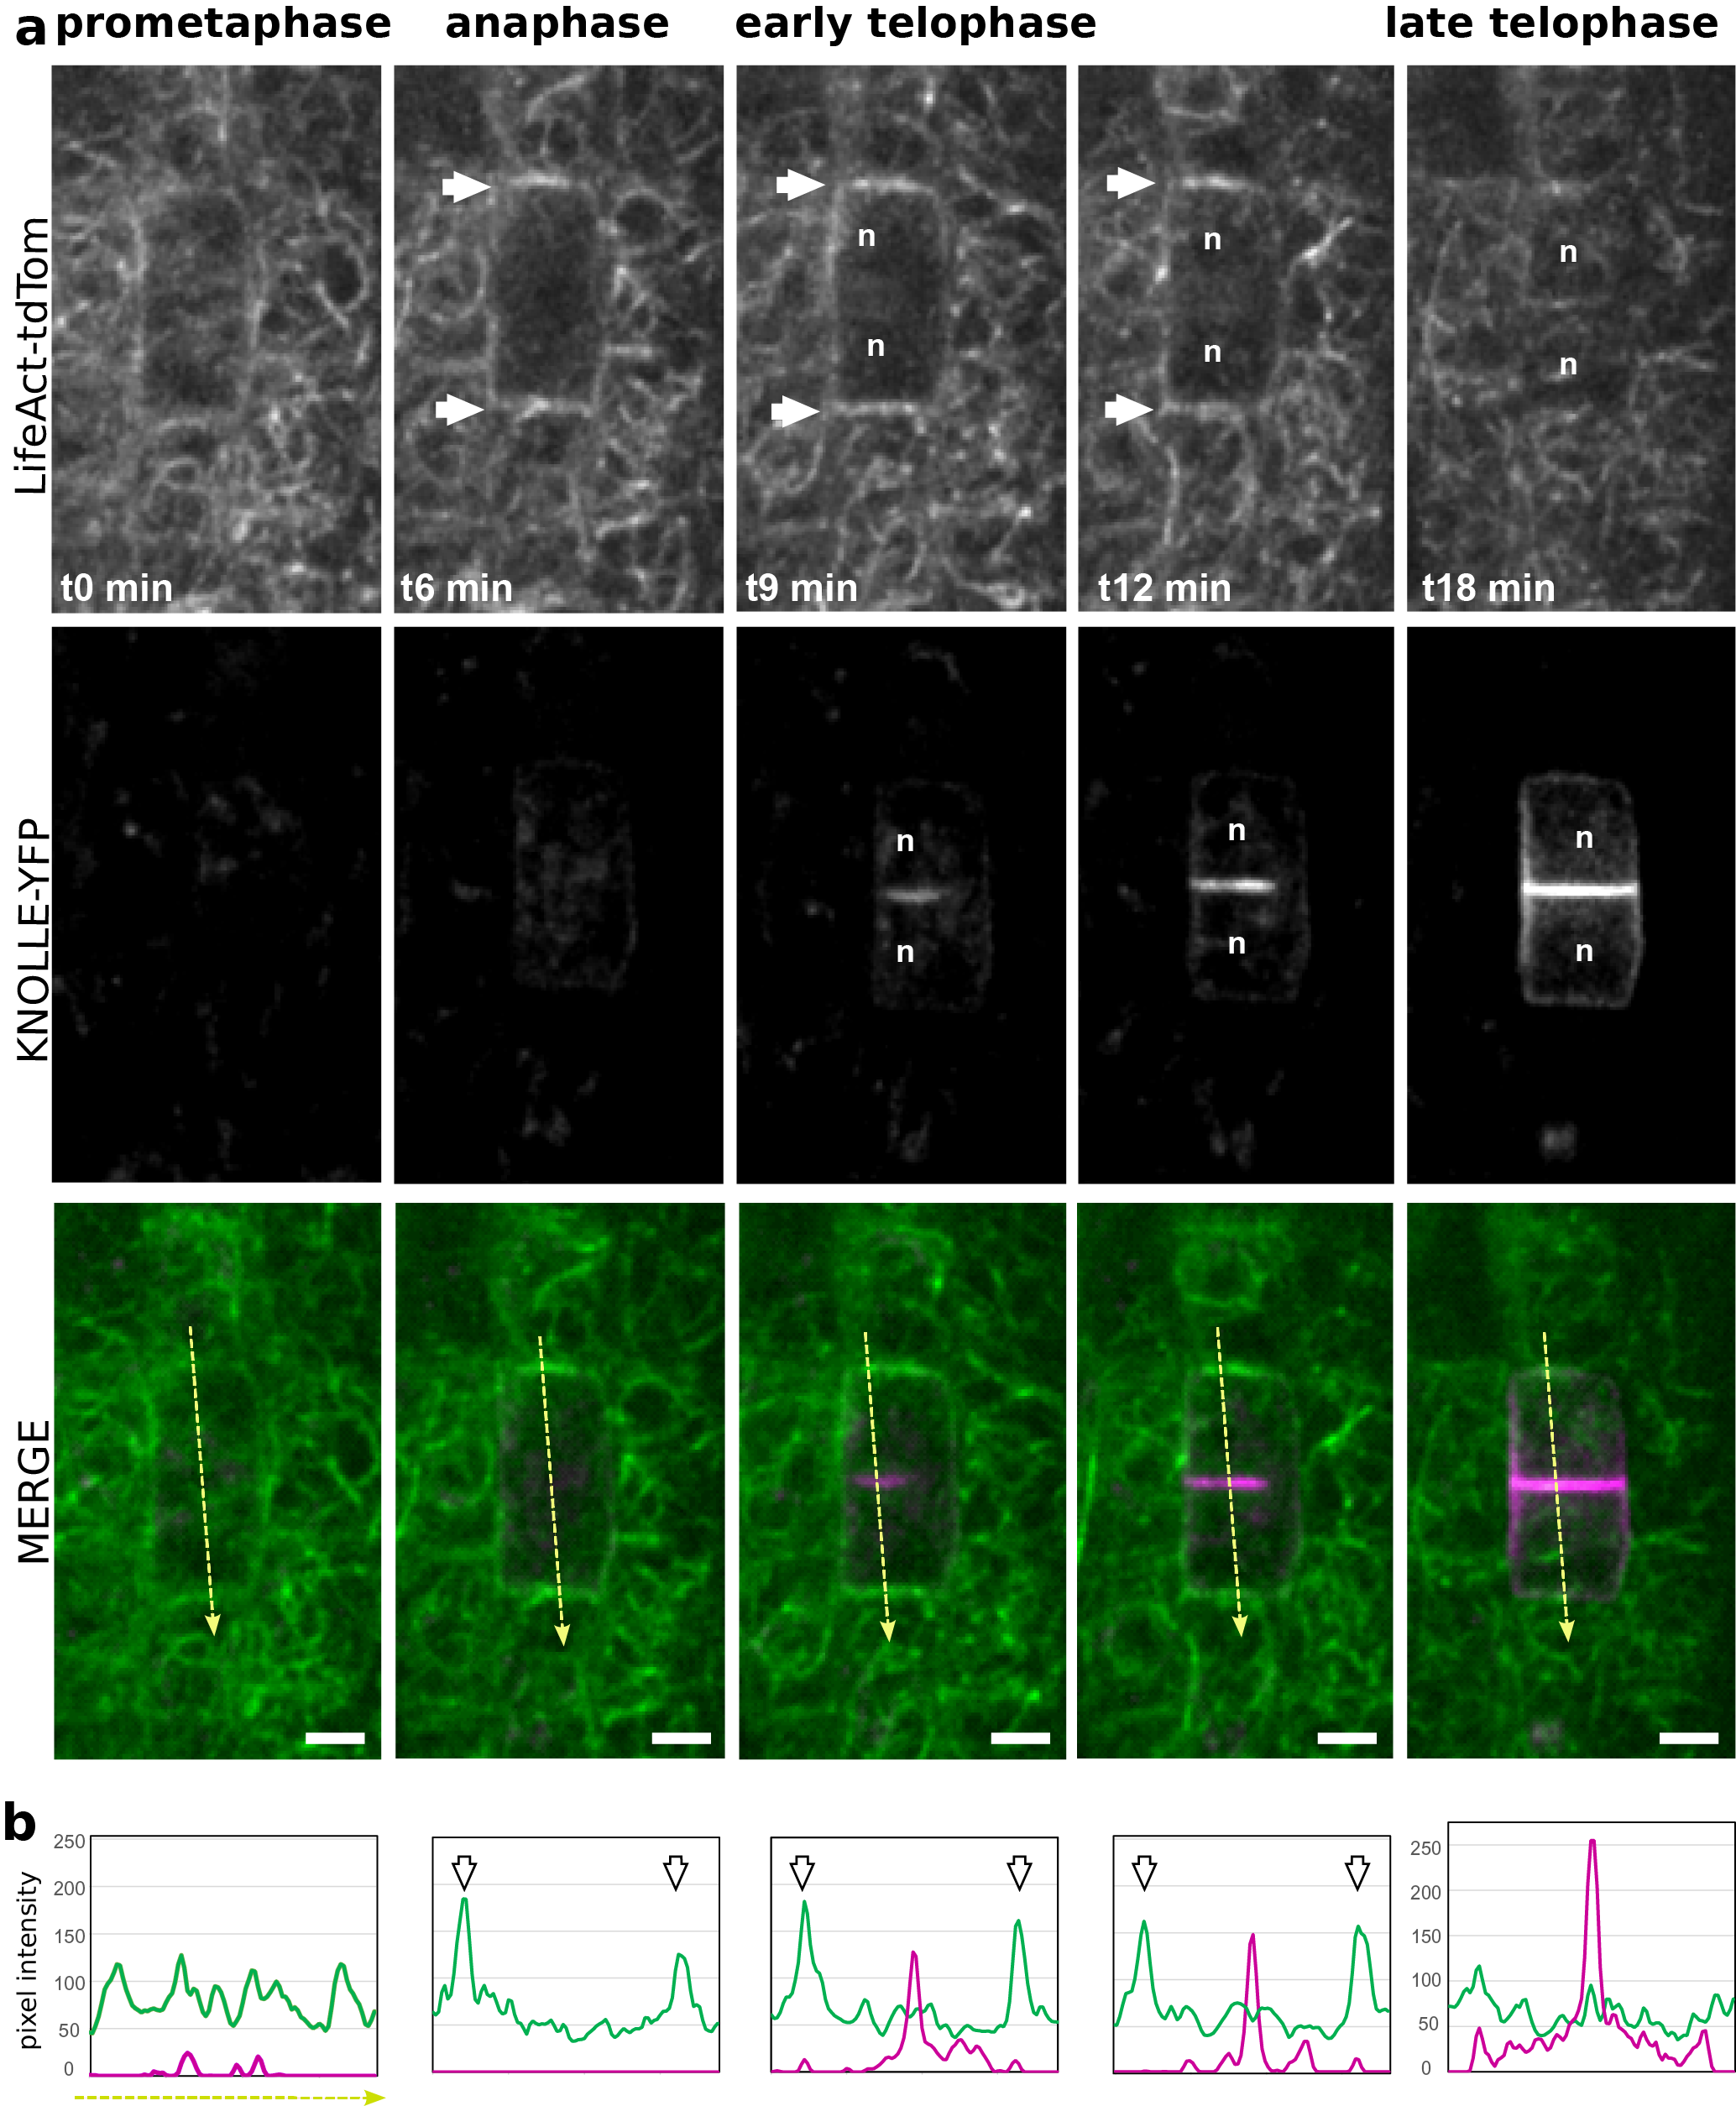
Figure 4. (a) Representatives images of a time-lapse analysis in Arabidopsis root meristem, expressing LifeAct-tdTom (green) together with KNOLLE-YFP (magenta). (b) Semi-quantitative measurement of the signal intensity for both LifeAct-tdTom (green) and KNOLLE-YFP (magenta) along the yellow line. White arrows, F-actin enrichment at the apico-basal part of the cells; orange arrows, accumulation of F-actin in the phragmoplast; n, nucleus. Scale bar = 5 μm.

Figure 5. Representatives images of a time-lapse analysis in Arabidopsis root meristem, expressing LifeAct-tdTom (green) together with GFP-PHGAP1 (magenta). Yellow and white arrows, F-actin enrichment at the apico-basal part of the cells; empty arrows, the position of the cortical division zone; n, nucleus. Scale bar = 5 μm.
We quantified the observed signal in the Arabidopsis line expressing LifeAct-2xmTU2 in dividing cell and non-dividing cells. To do so, we analysed using ImageJ the ratio of fluorescence intensity between the two apical and basal parts of the cell and the fluorescence intensity in the lateral parts of the cell (Figure 3b,c). We surveyed the ratio of fluorescence intensity between the apico-basal part of the cell and the cytoplasm from dividing cell and non-dividing cells (Figure 3b–d). Using this quantitative approach, we confirmed the enrichment of the F-actin signal at the apico-basal part of the dividing cells, whilst no specific distribution was observed in non-dividing cells (Figure 3b–d and Tables 2 and 3).
To address whether the ‘actin-depleted zone’ was quantifiable, we analysed the ratio of fluorescence intensity between the lateral part of the cell and the cytoplasm for dividing cell and non-dividing cells (Figure 3b–d). Whilst a slight decrease in the ratio was observed for the dividing cells compared to non-dividing cells, the presence of the adjacent non-dividing cells surrounding this region might mask a clear depletion. Indeed, whilst the actin-depleted zone is clearly observed in cell culture (Cleary et al., Reference Cleary, Gunning, Wasteneys and Hepler1992; Liu & Palevitz, Reference Liu and Palevitz1992), this depleted zone is difficult to image in dividing tissue (Voigt et al., Reference Voigt, Timmers, Samaj, Muller, Baluska and Menzel2005).
To uncover when the accumulation of the F-actin at the apico-basal part of the cell occurs, we analysed the signal collected from plant co-expressing Lifeact-YFPv and RFP-MBD at key steps of the cell division. Images extracted from time-lapse analysis or from single acquisitions were quantified for the Lifeact-YFPv signal at the apico-basal part of the cell and compared with the signal observed in the lateral parts of the cell, using the signal corresponding to the microtubules as reference for mitotic figures (Figure 3e, Table 4 and Supplemental Movie S1). We showed a gradual enrichment of the fluorescent signal corresponding to F-actin at the apico-basal part of the dividing cell during the spindle formation, where the difference in intensity was at its climax (Figure 3e and Table 4). Based on these quantifications, we conclude that the apico-basal accumulation of F-actin appears during prophase/metaphase transition and persists until the end of the cytokinesis in Arabidopsis root meristem.
Using plant co-expressing Lifeact-tdTom and the cell plate marker YFP-KNOLLE, we tracked dividing cells in the root meristem from early metaphase. An increase of the signal could be observed on the lateral parts of the cell, flanking the cortical division zone, but the signal in the surrounding cell was masking the signal from the dividing cells (Figure 4, white arrows). Therefore, it did not allow us to certify that this signal corresponds to the earlier described ‘actin twin peaks’ (Smertenko et al., Reference Smertenko, Deeks and Hussey2010). As soon as YFP-KNOLLE was found enriched in the developing cell plate, the lateral signal corresponding to Lifeact-tdTom disappeared and the rapid accumulation of Lifeact-tdTom signal at the apico-basal part of the cell was observed, as well as in the phragmoplast (Figure 4a,b). This accumulation of F-actin at the apico-basal part of the dividing cell was stable during cell plate expansion as YFP-KNOLLE signal expanded towards the cell periphery (Figure 4a,b). When the cell plate was fully attached to the mother cell leading to the formation of the crosswall, no more accumulation of the F-actin at the apico-basal parts of the cell could be observed using the Lifeact-tdTom reporter line (Figure 4a,b). At this stage, the cable of F-actin was found in the cytoplasm of newly formed daughter cells (Figure 4).
We confirmed these results using an Arabidopsis line co-expressing a cortical division zone marker together with the F-actin reporter (Figure 5 and supplemental movie 2). In transgenic lines expressing GFP–PHGAP1 under a Ub10 promoter, the fluorescent signal was reported to accumulate at the cortical division zone in metaphase/anaphase and remains throughout cytokinesis (Stockle et al., Reference Stockle, Herrmann, Lipka, Lauster, Gavidia, Zimmermann and Muller2016). Dual localization of GFP-PHGAP1 and Lifeact-tdTom showed that the accumulation at the apico-basal part of the dividing cells appeared before the signal corresponding to GFP-PHGAP1 could be noticed, suggesting that the F-actin polarisation appears before the recruitment of PHGAP1 at the CDZ (Figure 5).
Colocalization of F-actin using Lifeact-tdTom with mitotic microtubules decorated by RFP-MBD allowed used to visualise in detail the dynamics at the phragmoplast. During early anaphase, the colocalization of microtubules and F-actin was total whilst in late cytokinesis, colocalization analysis highlighted the differences in positioning of both cytoskeletons (Figure 6 and Supplemental Movie S1, S2). At the ring phragmoplast stage, the lifeact-tdTom preceded the RFP-MBD at the edge of the phragmoplast (Figure 6a,b and Supplemental Movie S1), confirming the role of F-actin in the phragmoplast guidance in the attachment phases of the cytokinesis.

Figure 6. (a) Representatives images of a time-lapse analysis in Arabidopsis root meristem, expressing LifeAct-YFPv (green) together with RFP-MBD (magenta). White arrows, F-actin enrichment; empty arrows, the phragmoplast; blue arrowhead, the position of the F-actin in the phragmoplast; n, nucleus. Scale bar = 10 μm. (b) Semi-quantitative analysis of the fluorescence intensity corresponding to LifeAct-YFPv (green) and RFP-MBD (magenta) in a rectangular ROI (h22xw106 pixels) represented in yellow on the merged image in (a). The grey area corresponds to the external part of the dividing cell and the blue arrowhead corresponds to the position of the F-actin in the phragmoplast.
4. Discussion
An extraordinary new view of the dynamic spatiotemporal regulation of key components of the cell division orientation is emerging from advances in live-cell imaging in Arabidopsis root meristem (Drevensek et al., Reference Drevensek, Goussot, Duroc, Christodoulidou, Steyaert, Schaefer, Duvernois, Grandjean, Vantard, Bouchez and Pastuglia2012; Lipka et al., Reference Lipka, Gadeyne, Stockle, Zimmermann, De Jaeger, Ehrhardt, Kirik, Van Damme and Muller2014; Muller et al., Reference Muller, Han and Smith2006; Schaefer et al., Reference Schaefer, Belcram, Uyttewaal, Duroc, Goussot, Legland, Laruelle, de Tauzia-Moreau, Pastuglia and Bouchez2017; Stockle et al., Reference Stockle, Herrmann, Lipka, Lauster, Gavidia, Zimmermann and Muller2016; Walker et al., Reference Walker, Muller, Moss, Ehrhardt and Smith2007; Xu et al., Reference Xu, Zhao, Rodrigo-Peiris, Brkljacic, He, Muller and Meier2008). However, when it comes to studying subcellular dynamics during plant cell division manual adjustment is required since the area under study will rapidly grow out of the field of view. This makes it necessary to obtain an automated system to release the biology researcher from spending up to a day in front of the microscope performing adjustments every 10 min. In the present study, we took advantage of a confocal chasing system to track the meristematic zone of the root based on point-to-point correspondences and motion estimation (Doumane et al., Reference Doumane, Lionnet, Bayle, Jaillais and Caillaud2017). Using this approach, we can track over a long period (10 hr) mitosis in the meristem of multiple Arabidopsis roots by spinning disk confocal microscopy. This method allowed us to rapidly collect biological replicates on the behaviour of the actin cytoskeleton during plant cell division and to quantify it. We showed that, in addition to its localization in the phragmoplast, F-actin polarised at the apico-basal parts of the cell from the prophase/metaphase transition and decreased at the end of the cytokinesis to eventually form actin cables in the cytoplasm of the two newly formed daughter cells. How this polar F-actin transient accumulation is achieved remains unclear.
In animal cytokinesis, the local increase in the level of the anionic lipid phosphatidylinositol-4,5-bisphosphate (PtdIns(4,5)P2) modifies F-actin amounts at the cell equator and controls cytokinesis abscission (Dambournet et al., Reference Dambournet, Machicoane, Chesneau, Sachse, Rocancourt, El Marjou, Formstecher, Salomon, Goud and Echard2011). Using our root tracking system, we observed that PtdIns(4,5)P2 has specific subcellular localization during plant cell division (Simon et al., Reference Simon, Platre, Marques-Bueno, Armengot, Stanislas, Bayle, Caillaud and Jaillais2016) suggesting a link between the proper spatial production of phosphoinositides and successful completion of cytokinesis. Moreover, the depletion of the PtdIns(4,5)P2 from the plasma membrane using the iDePP system highlighted the importance of the PtdIns(4,5)P2 pool for proper F-actin dynamics (Doumane et al., Reference Doumane, Lebecq, Colin, Fangain, Stevens, Bareille, Hamant, Belkhadir, Munnik, Jaillais and Caillaud2021). Actin nucleators such as ARP2/3 were shown to interact strongly with the plasma membrane in Arabidopsis (Kotchoni et al., Reference Kotchoni, Zakharova, Mallery, Le, El-Assal Sel and Szymanski2009), and both ACTIN DEPOLYMERIZATION FACTOR (ADF)/cofilin and profilin bind to PtdIns(4,5)P2 (Gungabissoon et al., Reference Gungabissoon, Jiang, Drøbak, Maciver and Hussey1998). In Zea mays, PROFILIN1 (ZmPRO1) inhibits hydrolysis of PtdIns(4,5)P2 at the membrane by the membrane-associated enzyme Phospholipase C (Staiger et al., Reference Staiger, Goodbody, Hussey, Valenta, Drobak and Lloyd1993). It was reported that PROFILIN from Phaseolus vulgaris could bind directly to the phosphoinositide enzyme PtdIns-3Kinase, which suggests that PROFILIN might participate in membrane trafficking, and acts as a linker between the endocytic pathway and the F-actin dynamics (Aparicio-Fabre et al., Reference Aparicio-Fabre, Guillen, Estrada, Olivares-Grajales, Gurrola and Sanchez2006).
In Arabidopsis, enzymes that locally produce PtdIns(4,5)P2 named PIP5K1 and PIP5K2 were reported to be most active among the ubiquitously expressed PtdIns4P 5-kinases (Ischebeck et al., Reference Ischebeck, Stenzel and Heilmann2008) and therefore are likely making a major contribution to cellular PtdIns(4,5)P2 formation (Tejos et al., Reference Tejos, Sauer, Vanneste, Palacios-Gomez, Li, Heilmann, van Wijk, Vermeer, Heilmann, Munnik and Friml2014). During embryogenesis, double mutations in pip5k1/pip5k2 bent to defects characterised by the formation of a vague apical-to-basal boundary (Tejos et al., Reference Tejos, Sauer, Vanneste, Palacios-Gomez, Li, Heilmann, van Wijk, Vermeer, Heilmann, Munnik and Friml2014) which eventually lead to sterile plants (Tejos et al., Reference Tejos, Sauer, Vanneste, Palacios-Gomez, Li, Heilmann, van Wijk, Vermeer, Heilmann, Munnik and Friml2014). Both YFP-PIP5K1 and YFP-PIP5K2 seem to be enriched in the apico-basal membrane in dividing cells (Ischebeck et al., Reference Ischebeck, Werner, Krishnamoorthy, Lerche, Meijon, Stenzel, Lofke, Wiessner, Im, Perera, Iven, Feussner, Busch, Boss, Teichmann, Hause, Persson and Heilmann2013) as observed for the F-actin in the present study. Based on this observation, it is appealing to emphasise that the composition in phosphoinositides could mediate the F-actin polymerisation at the apico-basal part of the cell, allowing the polarisation of the cell during its division. However, their dynamic localization during cell division needs yet to be addressed in detail, to disentangle if those kinases locally increase PtdIns(4,5)P2 production. It is even more intriguing since, in a previous report, we did not observe obvious polarity for the PtdIns(4,5)P2 biosensor 2xPHPLC-mCitrine using localization index analysis (Simon et al., Reference Simon, Platre, Marques-Bueno, Armengot, Stanislas, Bayle, Caillaud and Jaillais2016). However, because in this previous study (a) we did not distinguish between dividing cell and non-dividing cell, (b) the quantification was made on the transition zone between the meristem and the elongation zone of the root and (c) the actin-F polarisation in the dividing cell is observed in the meristematic part of the root, we cannot conclude about a possible relationship between F-actin and PtdIns(4,5)P2, and further investigation should be performed to address this point.
Why do cells in their tissues need this F-actin accumulation at their apico-basal parts? It is striking to observe, when it comes to cell division orientation, that in mutants impaired in the cortical dividing zone (CDZ) definition and/or microtubules PPB organisation, the defects rely on titled cell plates, yet the attachment is still happening in the lateral membranes of the root meristematic cells (Kumari et al., Reference Kumari, Dahiya, Livanos, Zergiebel, Kölling, Poeschl, Stamm, Hermann, Abel and Müller2021; Muller et al., Reference Muller, Han and Smith2006; Schaefer et al., Reference Schaefer, Belcram, Uyttewaal, Duroc, Goussot, Legland, Laruelle, de Tauzia-Moreau, Pastuglia and Bouchez2017; Stockle et al., Reference Stockle, Herrmann, Lipka, Lauster, Gavidia, Zimmermann and Muller2016). In another word, in microtubule defective mutants impaired in PPB or CDZ formation, we do not observe the attachment of the cell plate in the apico-basal membranes. Challenging the F-actin accumulation at the apico-basal part of the cell might be the key to understanding how the cell polarity is maintained after microtubules cytoskeleton perturbation during cell division in plant tissues.
Acknowledgements
We are grateful to the SiCE group (RDP, Lyon, France) in particular Y. Jaillais, V. Bayle and C. Miège for comments and discussions. We thank Y. Boutté (LBM, Bordeaux, France) for sharing the KNOLLE-YFP marker, Sabine Mueller (University of Tübingen, Germany) for sharing the GFP-PHGAP1 and RFP-MBD reporter and Dolf Weijers (Wageningen University, Netherlands) for sharing the LifeAct-tdTom. We thank P. Bolland and A. Lacroix from our plant facility. We acknowledge the contribution of SFR Biosciences (UMS3444/CNRS, US8/Inserm, ENS de Lyon, UCBL) facilities: C. Lionet, E. Chatre and J. Brocard at the LBI-PLATIM-MICROSCOPY for assistance with imaging.
Financial support
This work was supported by the French National Research Agency INTERPLAY (ANR-16-CE13-0021, M.-C.C. and A.F.), PLANTSCAPE (ANR-20-CE13-0026, M.-C.C.) and two SEED FUND ENS LYON-2016&2021 (M.-C.C.). AL was funded by Ph.D. fellowships from the French Ministry of Research and Higher Education.
Conflict of interest
The authors declare none.
Authorship contributions
A.L. performed the experiments, analysed the data (including statistics) and wrote the article. A.F. performed the cloning and the experiment. A.B. performed the experiment and the quantification. M.-C.C. performed the experiments, analysed the data, supervised the work and wrote the article.
Data availability statement
The Arabidopsis lines generated in this study are available from the corresponding author on reasonable request.
Supplementary Materials
To view supplementary material for this article, please visit http://org/10.1017/qpb.2022.1.


 Open access
Comments
Dear Editor,
Please find attached a manuscript entitled “Dynamic Apical-Basal Enrichment of the F-Actin during Cytokinesis in Arabidopsis Cells Embedded in their Tissues” by Alexis Lebecq, Aurélie Fangain, Alice Boussaroque and Marie-Cécile Caillaud, that we would like to submit to Quantitative Plant Biology.
https://www.biorxiv.org/content/10.1101/2021.07.07.451432v1
Cell division contributes to the proliferation of the cell in the tissues as well as the generation of specialized cells, both necessary to form a functional organism. The mechanisms of cell division need to be tightly regulated, as malfunctions in their control can lead to tumor formation or developmental defects. This is particularly true in land plants, where cells cannot relocate and therefore cytokinesis is key for morphogenesis. While F-actin and microtubules closely co-exist during this process, studies in planta mainly focused on the involvement of microtubule. In this manuscript, we used our recently developed root tracking system to image and to quantify the F-actin dynamic during cytokinesis. In addition to the F-actin accumulation’s in the phragmoplasts, we discovered a dynamic apical-basal enrichment of the F-actin during cytokinesis in root cells embedded in their tissues.
We believe that this study describing the dynamics of F-actin in regards to other key components of the cytokinesis such as microtubules, cell plate markers and cortical division zone marker will provide the ground for further studies on the involvement of the F-actin in polarity, important for the orientation of cell division in plant. Moreover, we quantified the dynamic behaviors of the actin-cytoskeleton during cytokinesis at an unpreceded time and space: The results generated from this study have the potential to be textbook knowledge. For all the reasons highlighted above, we think that this work is perfectly fitted for the readership of Quantitative Plant Biology.
My collaborators and I very much look forward to hearing back from you. We have attached a list of possible referees below.
Sincerely and with best wishes,
Dr Marie-Cécile Caillaud