


Introduction
Certified organic farming is a suite of regulated practices that can support social, economic, and ecological sustainability, including increased biodiversity and ecosystem services, such as induced herbivore resistance (Phelan, Reference Phelan, Bohlen and House2009; Reganold and Wachter, Reference Reganold and Wachter2016). Induced resistance is a state of elevated plant defense triggered by prior or simultaneous infection, infestation, or by naturally occurring soil microbes (Phelan, Reference Phelan, Bohlen and House2009; Karban, Reference Karban2011; Alyokhin and Gross, Reference Alyokhin, Gross, Giordanengo, Vincent and Alyokhin2013). Multiple studies show organic farms conserve soil microorganisms that promote plant defenses and reduce insect herbivores (Phelan, Mason and Stinner, Reference Phelan, Mason and Stinner1995; Mäder et al., Reference Mäder, Fliessbach, Dubois, Gunst, Fried and Niggli2002; Phelan, Reference Phelan, Bohlen and House2009; Mohanram and Kumar, Reference Mohanram and Kumar2019; Blundell et al., Reference Blundell, Schmidt, Igwe, Cheung, Vannette, Gaudin and Casteel2020; Khatri and Sharma, Reference Khatri and Sharma2021). Conservation tillage, mulches, cover crops, and organic soil amendments are known to promote pest-suppressive soil microorganisms in organic farms (Alyokhin, Nault and Brown, Reference Alyokhin, Nault and Brown2020), yet organic farmers are not homogenous in the practices they use (e.g., farmers use a spectrum of practices under the same certification) (Darnhofer et al., Reference Darnhofer, Lindenthal, Bartel-Kratochvil and Zollitsch2010; Bloom et al., Reference Bloom, Constancio, Hauri and Szendrei2022). Variation in practices among farmers is further linked with farmer beliefs (Guerin and Guerin, Reference Guerin and Guerin1994). Therefore, we posit that understanding beliefs is key to determining why farmers vary in the practices they use and how changes in beliefs can shape beneficial outcomes for the pest-suppressive microbiome across organic farms.
According to the theory of planned behavior, farming practice adoption is mediated by beliefs through the benefits farmers assume to be true about the practice and their ecological outcomes (Ajzen, Reference Ajzen1991; Guerin and Guerin, Reference Guerin and Guerin1994). Therefore, beliefs constrain or enable the adoption of practices within farms. Organic farmers hold a spectrum of beliefs (Sullivan et al., Reference Sullivan, Mccann, De Young and Erickson1996; Jabbour et al., Reference Jabbour, Gallandt, Zwickle, Wilson and Doohan2014), and variation in beliefs across farmers could be one reason for observed heterogeneity in sustainable farming practice use (Shreck, Getz and Feenstra, Reference Shreck, Getz and Feenstra2006). For example, organic farmers vary in their beliefs on environmental responsibility which mediates their use of conservation practices (e.g., no-tillage) (Taylor, Dobbs and Smolik, Reference Taylor, Dobbs and Smolik1992; Sullivan et al., Reference Sullivan, Mccann, De Young and Erickson1996; Comer et al., Reference Comer, Ekanem, Muhammad, Singh and Tegegne1999). In turn, variation in beliefs can limit the environmental advantages of organic over conventional farming (Orpet et al., Reference Orpet, Jones, Beers, Reganold, Goldberger and Crowder2020). Farmer demographics and farm characteristics, such as farmer age and farm size, also regulate practice adoption (Prokopy et al., Reference Prokopy, Floress, Klotthor-Weinkauf and Baumgart-Getz2008). While data on demographics and farm characteristics are routinely collected, beliefs are often ignored by researchers, policymakers, certifiers, extension agents, and education programs, partially because they are difficult to observe (Rose, Keating and Morris, Reference Rose, Keating and Morris2018). Ignoring beliefs, or treating them as homogenous and static, may limit insights into constraints on adoption of farming practices, because farmer demographics and farm characteristics only partially explain practice heterogeneity (Prokopy et al., Reference Prokopy, Floress, Klotthor-Weinkauf and Baumgart-Getz2008). Moreover, no research to our knowledge has assessed how beliefs, farm characteristics, and farmer demographics influence the adoption of practices known to support the pest-suppressive microbiome.
Socio-ecological models pose an opportunity to study the adoption and ecological benefits of sustainable farming practices (Gaba and Bretagnolle, Reference Gaba and Bretagnolle2019). Socio-ecological approaches recognize that human beliefs result in actions that drive ecosystem processes (Ostrom, Reference Ostrom2009). However, socio-ecological models that include farmer beliefs as determinants of farming practice adoption remain underdeveloped, particularly within the study of insect pest management (but see Musser et al., Reference Musser, Wetzstein, Reece, Varca, Edwards and Douce1986; Escalada and Heong, Reference Escalada and Heong2004; Hashemi and Damalas, Reference Hashemi and Damalas2010). Moreover, none have addressed if organic farmers beliefs of the pest-suppressive soil microbiome are associated with practice adoption, and how these beliefs relate to motivations and future farm management. Socio-ecological models can also be used to enhance herbivore resilience by evaluating variation in farming practice adoption at broad geographic scales moving beyond the individual farmer (Kuo and Peters, Reference Kuo and Peters2017). However, this will require the identification of practices that can be adopted across populations of farmers with heterogeneous beliefs. Collectively, we suggest understanding the link between variation in practice adoption and farmer beliefs will aid in efforts to promote practices proven to support pest-suppressive soil microbes across organic farms.
We used a survey instrument to evaluate variation in beliefs and farming practice adoption within a population of 280 organic farmers in New York State, USA. We hypothesized that adoption of microbiome-supportive practices by organic farmers is driven by variation in their microbiome beliefs. We also evaluate the relative importance of demographic variables and farm characteristics, compared to difficult-to-observe farmer beliefs, for adoption of practices that mediate the pest-suppressive soil microbiome. While ≈96% of farmers agreed that farming practices promote the pest-suppressive microbiome, our study suggests there is considerable variation in microbiome beliefs. Out of 85 participants, <50% of farmers believed on-farm management and external factors, such as climate change, were important for enhancing the pest-suppressive microbiome. In comparison to their counterparts, these farmers used fewer practices linked to reductions in ecosystem services and were more motivated to embrace novel approaches that promote the pest-suppressive microbiome. Our research can serve as a model for survey-based socio-ecological approaches, where researchers seek to study the adoption of sustainable farming practices and resulting biodiversity ecosystem function relationships.
Methods
Study system
There are ≈17,000 certified organic farms in the United States, with ≈10% located in NY, USA (USDA NASS, 2022). Organic farms comprise ≈331,438 acres of cropland in NY, with organic vegetable sales totaling ≈28 million USD annually (USDA NASS, 2022). Greater than 63% of organic producers in NY have been involved in certified organic production for more than 10 years, and have sales valued greater than 50,000 USD annually. Within the next 5 years, most farmers (75%) intend to either increase or maintain their current level of organic production (USDA NASS, 2022). Greater than 30% of NY organic farmers report using practices known to mediate the soil microbiome including use of organic mulch and compost (≈34%), animal manures (≈70%), green manures (≈42%), cover crops (≈30%), and no-tillage or minimum tillage (≈32%) (USDA NASS, 2022). Less is known of organic farmer demographics. For example, greater than 68% of farmer producers in NY are 45 years old and over, but similar demographics for organic vegetable farmers in NY are unavailable (USDA NASS, 2017).
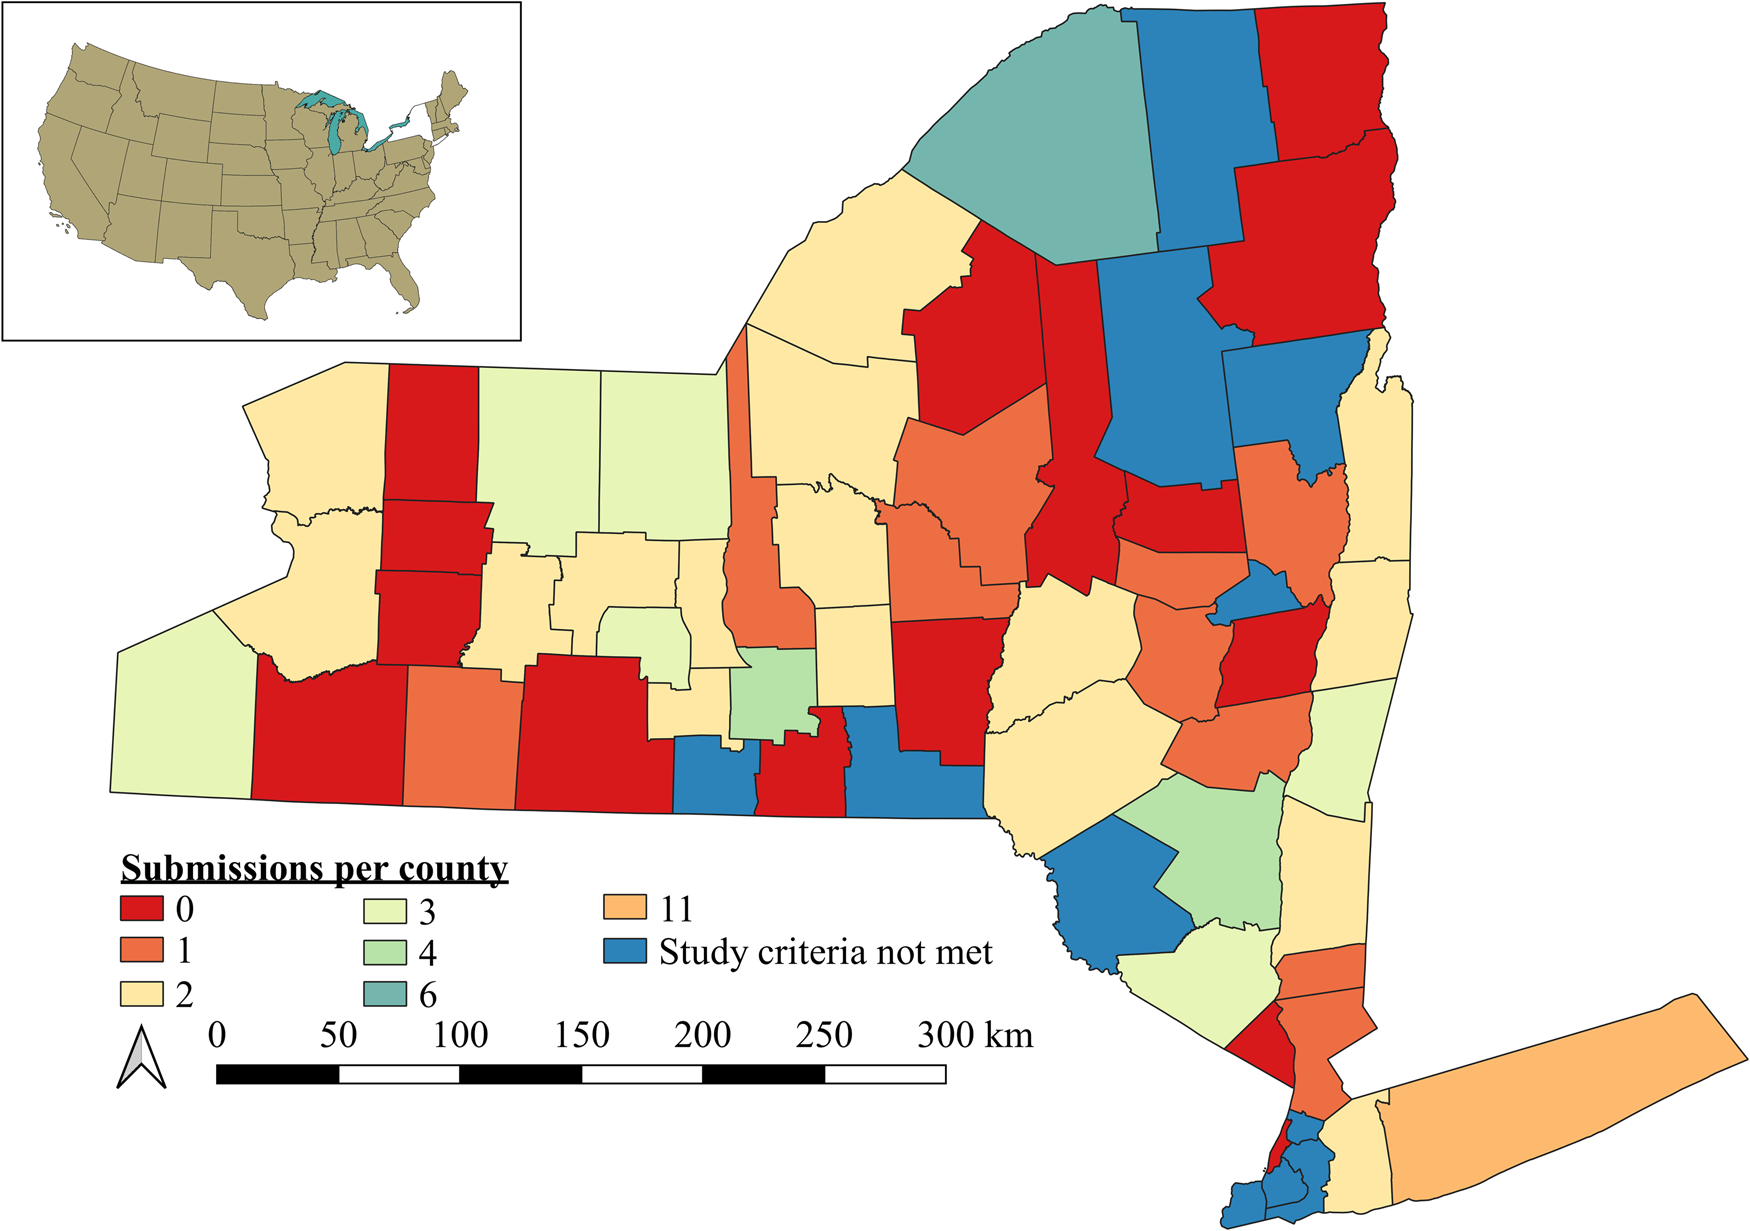
Prior studies indicate that production of organic vegetables under field conditions promote naturally occurring pest-suppressive microbes compared to conventional counterparts (see Blundell et al., Reference Blundell, Schmidt, Igwe, Cheung, Vannette, Gaudin and Casteel2020 among others). Therefore, our selection criteria for inclusion in the study population was certified organic small fruit and vegetable farms in NY (Fig. 1). Population selection started by gathering production data for NY organic farmers from the USDA Integrity Database (USDA AMS, 2021) (n = 1511). The population was reduced using the ‘Crops Scope’ classification in the integrity database to select NY certified organic farms producing vegetables (1511 NY organic farms – 1172 farms not producing vegetables = 338 farms). The reduced integrity database (n = 338) was visually inspected via the ‘Certified Products under Crops Scope’ classification to further evaluate crops produced. We also cross-referenced the reduced database (n = 338) via web searches (see Supplemental Information). Via visual inspection and cross-referencing, 56 farms were removed from our database because they only grew: (1) row crops; (2) vegetables indoors; (3) microgreens in greenhouses; (4) berries; or (5) seedlings as transplants. Further validation was conducted by Cornell Extension agents who reviewed our database, removing two farms because they did not produce vegetables (282 organic vegetable farms meeting our selection criteria – 2 removed by extension agents = 280 farms in study population). Via our multiple mailings approach (see below) one farmer was excluded from the population because they declined to participate by telephone (280 farms in study population – 1 unwilling farmer = 279 farms in study).
Spatial scale of study region (NY, USA) and distribution of responses for 85 participants that submitted completed questionnaires. Colors indicate the number of participants per county. Counties in blue did not have farms that met our selection criteria for participants (e.g., certified organic, small fruit and vegetable farming).
Survey development
Our survey instrument evaluated participant belief in soil microbes that enhance pest suppression, agreement with statements regarding approaches to promote the pest-suppressive soil microbiome (e.g., production practices vs inoculants), motivating factors to adopt new practices (e.g., visible reductions in pest populations on their farms), intent to use practices identified by our study to support these microbes, and increased knowledge as a factor for study participation (Table S1 Q1, Q2). We also evaluated the: (1) production practices adopted by the participant (specifically the practices used within the field(s) of the farm [e.g., crops grown, cover crops used, livestock integrated]); (2) demographics of the participant (e.g., age, education) and farm characteristics (e.g., farm area, time in organic production); and (3) importance each participant placed on production practices, soil properties, demographics and farm characteristics, off-farm factors (e.g., conventional pesticides applied in bordering lands), and climate factors (e.g., extreme weather events) for regulating the pest-suppressive soil microbiome on their farm (Table S2 Q1–Q8). Emphasis was placed on documenting the use of practices identified in the literature to influence the soil microbiome (e.g., French et al., Reference French, Kaplan, Iyer-Pascuzzi, Nakatsu and Enders2021), while narrowing those practices to only those used by organic vegetable farms in NY. Our survey instrument was paired with a sampling kit, where the participant submitted a soil sample for microbiome sequencing, plant defense, and pest suppression bioassays. Soil samples were submitted for each field where farming practices (e.g., crops grown) were recorded (participants could sample two fields total) (Table S3 Q1–10). The results of research using soil samples are reported elsewhere. The survey instrument verified participants met our selection criteria and were responsible for making production decisions within the farm. Participants were given an informed consent form indicating their rights, participants could decline to participate, and the survey secured institutional review board (IRB) approval at Cornell University (IRB #2107010457). The survey instrument underwent pretesting to promote efficacy (see Supplemental Information).
Multiple mailings approach
The survey was deployed using a multiple mailings approach (Dillman, Christian and Smith, Reference Dillman, Christian and Smith2008). All farmers in our initial target population (n = 280) were mailed a recruitment letter describing the study on September 3, 2021. One farmer declined to participate via telephone after receiving our recruitment letter. Thus, 279 farmers were sent a survey instrument, return postcard for indicating if they did not meet the study selection criteria or were uninterested, and soil sampling kit on September 29, 2021 (26 days post recruitment). Non-respondents were sent a preliminary reminder to participate on October 25, 2021 (26 days post survey instrument) and final reminder to participate on November 15, 2021 (21 days post preliminary reminder). On November 17, 2021, we evaluated the survey response rate, which we determined was below our participation goal (our goal was to sample at least 30% of the population described above [n ≈ 84 participants]). Therefore, to further encourage participation, we conducted a telephone solicitation on November 19, 2021. The telephone solicitation targeted a subset of farmers (n = 55) from geographic regions (n = 21 counties), where we had yet to receive completed survey instruments. Solicitations were conducted by the primary investigator, and farmers were queried to determine if they: (1) had received the recruitment letter and/or survey; (2) had any questions about the survey; (3) planned to participate; and (4) were not going to participate and why (e.g., not interested; not certified organic). The telephone solicitation was approved by the Cornell IRB and participation in solicitations was voluntary. Participants were asked to return the survey instrument (and soil sample[s]) by a postage paid envelope no later than December 15, 2021 (study period = 77 days). However, we continued to accept submissions under limited circumstances (if the survey instrument was completed and soil sample taken before the survey end date) until January 10, 2022.
Knowledge standardization and statistical tests of farmer beliefs in pest-suppressive soil microbes
Prior to the assessment of beliefs, farmer participants were furnished with information on the pest-suppressive microbiome to standardize their knowledge of the study system (Fig. S1). This information included a visual conceptual diagram of microbiome-mediated pest suppression and text detailing the diagram (Fig. S1). All analyses were conducted in R (R Core Team, 2021). Our statistical tests began by using one-sample two-sided Wilcoxon rank-sum tests (mu = 3; where ‘mu’ is the ‘neither agree nor disagree’ response) to assess if farmers believed soil microbes enhance pest suppression by boosting plant defenses (Table S1 Q1). We also used one-sample two-sided Wilcoxon rank-sum tests (mu = 3; where ‘mu’ is the ‘neutral’ response) to assess increased knowledge as a reason for participation and if the participant intended to use practices discovered by the project to support soil microbes on their farm (Table S1 Q2). Finally, we used an unpaired two-sample Wilcoxon rank-sum test to make comparisons between farmer beliefs regarding the most effective way to promote soil microbes that enhance pest suppression (farming practices vs inoculants) (Table S1 Q1).
Parsing variation in farmer beliefs of factors regulating the pest-suppressive soil microbiome
To examine the heterogeneity of organic farmer pest-suppressive microbiome beliefs and identify groupings (clusters) of farmers, we used principal component analysis and a permutation approach to affinity propagation (function = apcluster; package = apcluster) (Fig. 2a) (Frey and Dueck, Reference Frey and Dueck2007; Dueck, Reference Dueck2009; Bodenhofer, Kothmeier and Hochreiter, Reference Bodenhofer, Kothmeier and Hochreiter2011). Using principal component analyses, seven of the 20 statements on microbiome-enhancing beliefs were removed due to not meeting the loading value retention thresholds (above 0.6 were retained) (Table S2 Q1). Then we used a varimax rotated principal component analysis to reduce the 13 remaining survey statements on microbiome-enhancing beliefs into three axes so we could interpret each axis as a linear combination of the statements (Jolliffe, Reference Jolliffe2002). The first rotated component was associated with factors external to the farm (changes in weather patterns, extreme weather events, use of conventional pesticides on bordering land, and the amount of natural area in bordering lands) (Fig. 2b; RC1; cumulative proportion = 0.35). On-farm management factors and farm characteristics (soil organic matter, reduced tillage, composting, crop diversity, and time in organic management) were associated with the third rotated component (RC3; cumulative proportion = 0.69) (Fig. 2b). Note, due to varimax rotation, successive components no longer capture as much variance as possible (Jolliffe, Reference Jolliffe2002). Thus, the final axis (RC2) explained the least variation and interpretation was less clear. This axis was excluded from further analysis; however, we attributed RC2 to farmer beliefs of inputs and practices that directly impact the microbiome (soil pesticides, microbial inoculants, pre-planting practices, and fertilizers).
Relationships between (a) optimized solution (blue point) for affinity propagation across similarity matrix quantile value iterations and (b) the collapsed dimensions of the varimax rotated principal component analysis. The red point in ‘a’ is the unstable 10-cluster solution generated by the median quantile value (0.5). Point colors in ‘b’ represent the 7 stable clusters, with square points indicating exemplars for each cluster. Each point in ‘b’ represents a farmer participant. Cluster colors are as follows: 1 = black; 2 = red; 3 = green; 4 = blue; 5 = teal; 6 = pink; 7 = yellow.
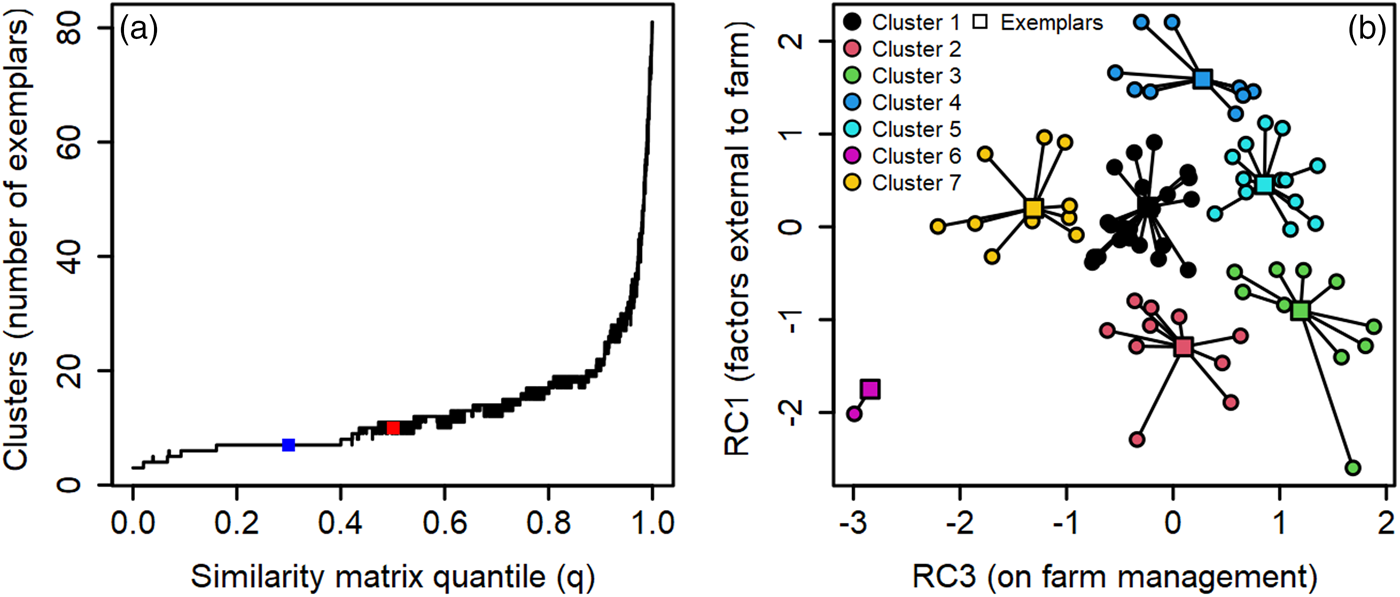
Following Haberman and Bennett (Reference Haberman and Bennett2019), we then used the component scores from the first two rotated components (RC1 and RC3) found from measures of microbiome beliefs as the two-dimensional input for affinity propagation (Frey and Dueck, Reference Frey and Dueck2007) (Fig. 2a, Table S2 Q1). We use this approach rather than other clustering analyses (e.g., k-means) because exemplars (farmers who represent the group) for each cluster of beliefs are identified with affinity propagation (Frey and Dueck, Reference Frey and Dueck2007). Exemplars are chosen among observed data and not computed as hypothetical cluster sample averages (Bodenhofer, Kothmeier and Hochreiter, Reference Bodenhofer, Kothmeier and Hochreiter2011). This is beneficial for socio-ecological research, because samples (e.g., soil) from exemplar sites can be used in bioassays to examine the influence of beliefs (as measured by survey instruments) on the ecology of farms (e.g., microbiome richness), which is impossible with other clustering approaches and physically untenable when using samples from all participants. The affinity propagated clusters were then used to evaluate variation in farming practice adoption and farmer motivations (see below). Further details on the principal component analysis, affinity propagation, and model metrics for the varimax rotated principal component analysis are given in the Supplemental Information (see also Table S4).
The influence of farmer beliefs on motivations and practice adoption
We hypothesized that adoption of microbiome-supportive practices by organic farmers is associated with variation in their microbiome beliefs. To address our hypotheses, we assessed correlations between farmer microbiome beliefs (clusters) and 16 farming practices linked with microbiome conservation using simple linear regression. The farming practices assessed by these models were associated with water management, crop diversification, cover cropping, organic soil amendments, tillage, mulching, pre-planting practices, and pesticide use (Table S3 Q1–Q11). As suggested by Kanaan et al. (Reference Kanaan, Frenk, Raviv, Medina and Minz2018) and French et al. (Reference French, Kaplan, Iyer-Pascuzzi, Nakatsu and Enders2021), increased crop diversity, cover cropping, organic soil amendments, biological mulches, and pre-planting practices are linked with microbiome conservation, whereas pesticides, tillage, and broadcast irrigation cause microbiome declines. However, correlations between farming practices and the microbiome are contested (French et al., Reference French, Kaplan, Iyer-Pascuzzi, Nakatsu and Enders2021).
Previously, Bloom et al. (Reference Bloom, Bauer, Kaminski, Kaplan and Szendrei2021) found that demographics and farming system characteristics regulated practice adoption, but beliefs were linked with participation in future conservation programs on farms. Thus, we constructed simple linear models to examine if motivation to adopt a new practice that supports pest-suppressive soil microbes would depend on farmer beliefs (Table S3 Q11). We also examined each motivation with one-sample one-sided Wilcoxon rank-sum tests (mu = 3; where ‘mu’ is the ‘Somewhat motivating’ response) to determine which motivation statements were very or extremely motivating when deciding to adopt a new practice that supports the microbiome (Table S3 Q11). We then conducted a pairwise Wilcoxon rank-sum test to determine which statements were statistically equal if the statement was already very or extremely motivating.
Demographics and farm characteristics as proxies for beliefs
We also evaluated if farmer demographics and farm characteristics can be used as proxies for beliefs, because some of these variables (e.g., certified acres in production) segregated by belief cluster (Tables S5 and S6). Conceptually, our socio-ecological analysis assumes that adoption of farming practices, and farm ecology, is mediated by farmer beliefs (Rose, Keating and Morris, Reference Rose, Keating and Morris2018). However, via an information theoretic approach to model selection (Burnham and Anderson, Reference Burnham and Anderson2002; Grueber et al., Reference Grueber, Nakagawa, Laws and Jamieson2011), we allow for adoption to be mediated by farming system characteristics and demographics, which also influence practice adoption and farm ecology (Prokopy et al., Reference Prokopy, Floress, Klotthor-Weinkauf and Baumgart-Getz2008). Moreover, because farmer beliefs can cluster geographically (Heumann et al., Reference Heumann, Liesch, Bogen, Meier and Graziano2020) we examined the spatial autocorrelations for clusters using Moran's I at three distance bands representing the scale at which belief clusters may emerge (0–80, 80–320, 320–630 km) (function = moran.mc; package = spdep) (Bivand, Pebesma and Gomez-Rubio, Reference Bivand, Pebesma and Gomez-Rubio2013). Additional details on the linear regressions and information theoretic approach are in the Supplemental Information.
Results
Our survey instrument was sent to 279 organic farmers in NY, USA (Fig. 1). We received 85 completed surveys, generating a 30.5% response rate (85 respondents/279 farmers in population). A further 19 farmers (6.8% of the population) indicated that they were uninterested or unable to meet the study selection criteria. These responses were recorded via a return postcard included with the survey. Moreover, three farmers telephoned the primary investigator or their extension agent (but did not return the postcard) to indicate that they did not meet the study selection criteria. Seven farm mailing addresses in our cleaned integrity data base yielded recruitment letters, survey instruments, or reminder postcards that were returned undeliverable. Thus, we achieved a 40.8% response rate when including mail returned undeliverable, and farmers unable or uninterested in participating (85 completed surveys + 19 postcards + 3 calls + 7 undeliverable = 114 responses out of 279 potential respondents).
Representativeness of participant demographics and farm characteristics
Survey respondents on average were 54 years old, with 25 and 85 years old as the youngest and oldest participant, respectively (median age = 58 years) (Table 1). Most farmers were first generation (57 farmers), and the farming system was, on average, the main source of income for all respondents (Table 1). The median value indicated most farmer respondents attained their bachelor's degree (67.1% of participants had a bachelor or graduate degree). However, this education was generally not in programs yielding degrees in agricultural or related fields (Table 1). Farm size (certified and non-certified acres) ranged from 1 to 2800 acres (mean = 177.4; median = 64 acres), with certified acres in production during the study ranging from 0.12 to 500 acres (mean = 23.4; median = 4.5 acres) (Table 1). The amount of time in organic production ranged from 2 to 50 years (mean = 16.05; median = 12.5 years), and most farmers indicated they would continue to maintain organic certification on this land for at least the next 5 years (Table 1). Statistics generated by the USDA Census of Agriculture indicated farmers that participated in our survey were slightly biased toward producers using long-term organic production (farms with >10 years in organic production: our survey [58.3%]; USDA Census [42.0%]) (USDA NASS, 2022). However, some metrics were more closely aligned, such as intent to maintain or increase organic production in the next 5 years (our survey [71.1%]; USDA Census [75.0%]) (USDA NASS, 2022). We also found a tendency for farmers to indicate they would add an additional certification (e.g., regenerative organic certification) during the next 5 years, and 42.4% indicated they would continue to be the primary operator for the next 10 years (Table 1). However, when assessed across categories in the survey instrument, within the next 10 years, 57.6% of farmers indicated they were unsure what would happen to the operation, or the operation would undergo a transition (e.g., the farm would be converted to non-farm use) (Table 1). While our results indicate the demographics of our participants were similar to USDA generated statistics (see above) caution must be used when generalizing our results, because the USDA does not include demographic information specific to NY vegetable organic farmers (USDA NASS, 2022). Therefore, the demographics of our target population remain unknown.
Qualitative assessment of farmer demographics and farm characteristics for survey conducted on organic farms in New York, USA from 2021 to 2022
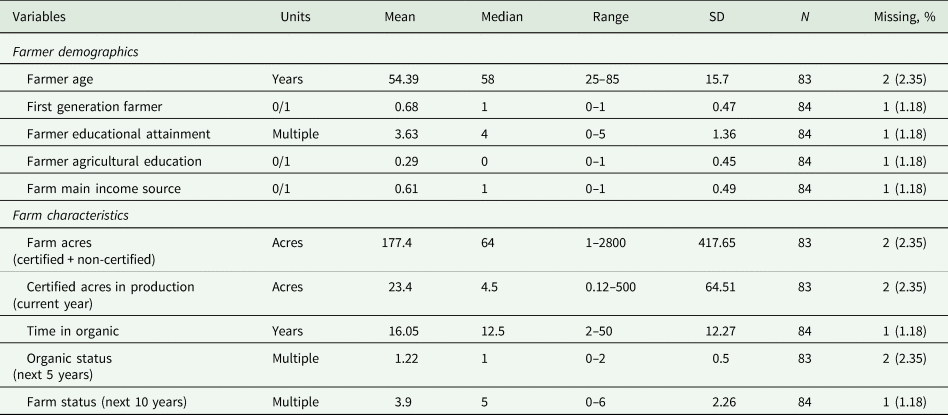
Multiple choices were coded numerically as: farmer educational attainment (0 = less than 12 years; 1 = high school diploma; 2 = some college, no degree; 3 = associate's degree; 4 = bachelor's degree; 5 = graduate degree); organic status (0 = drop organic certification; 1 = continue with organic certification; 2 = continue with organic certification and add a further certification; and farm status (0 = farm will be sold; 1 = I'm not sure; 2 = the farm will be converted for non-farm use; 3 = the farm will be donated to a farmland preservation program or other land trust; 4 = someone else (not related) will be the primary farm operator; 5 = a relative will be the primary operator; 6 = i will continue to be the primary farm operator).
Farmers believe soil microbiomes mediate pest suppression
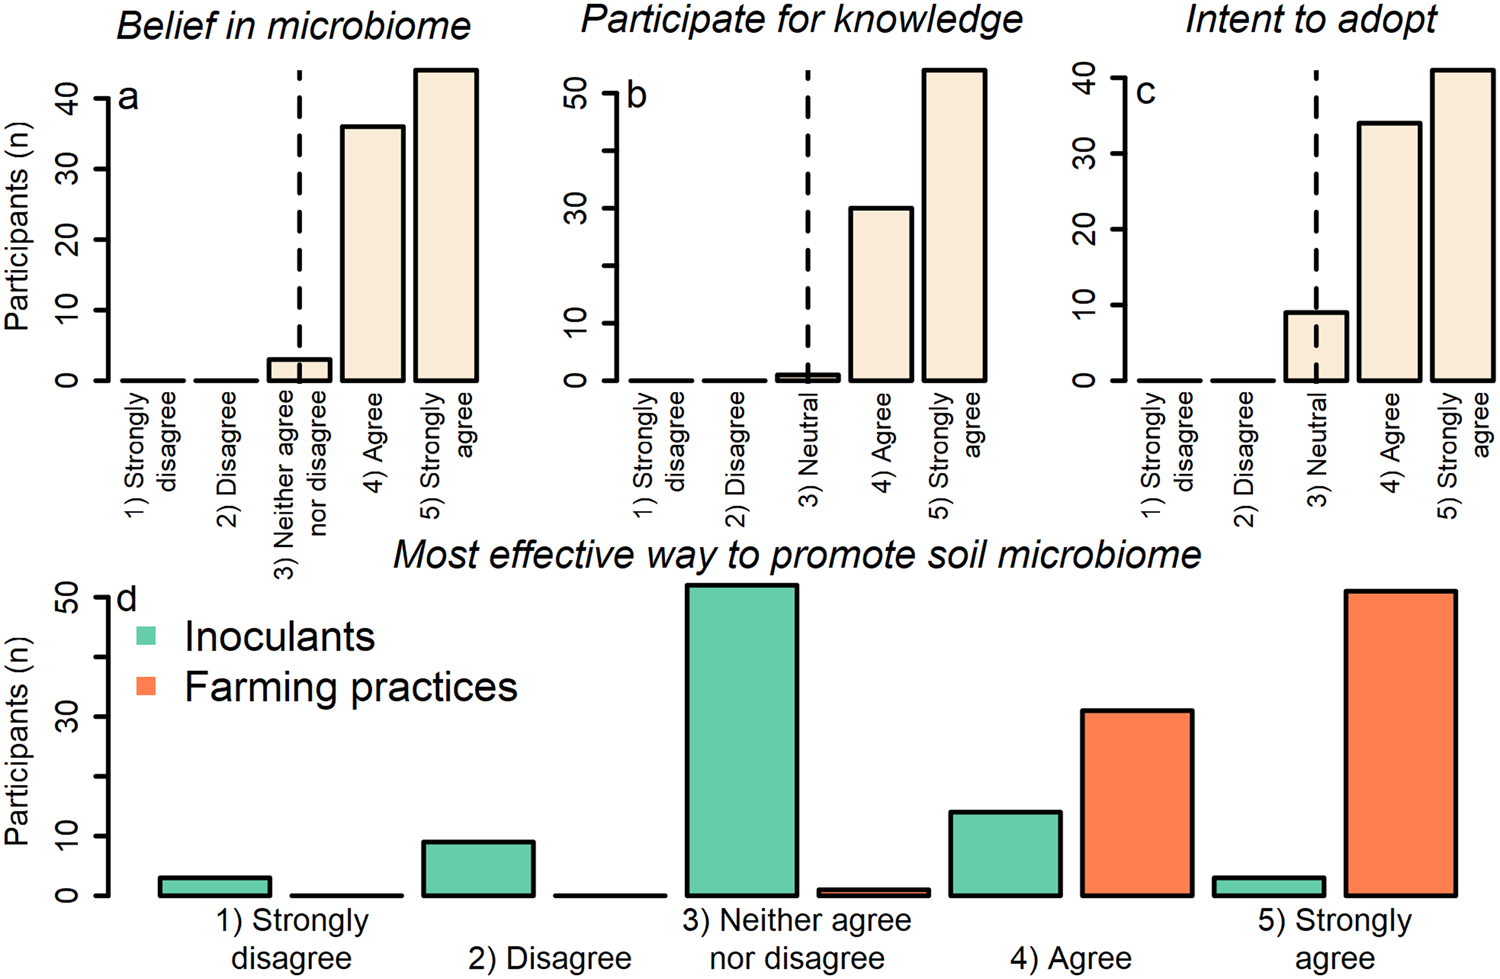
Farmer participants believed that soil microbes enhance pest suppression via plant defenses on their farm (one-sample Wilcoxon signed-rank test with continuity correction; v = 3240; P value = 1.014 × 10⁻¹⁵; alternative hypothesis = true location is not equal to 3 [on a 5-point Likert scale where 3 = neither agree nor disagree]) (mean = 4.49; median = 5.00; SD = 0.57) (Fig. 3a; Table S1 Q1). Participants agreed with statements indicating they: (1) participated in the project because they wanted to know more about the soil microbes on their farm (one-sample Wilcoxon signed-rank test with continuity correction; v = 3570; P value <2.2 × 10⁻¹⁶; alternative hypothesis = true location is not equal to 3 [on a 5-point Likert scale where 3 = neutral]) (mean = 4.62; median = 5.00; SD = 0.51); and (2) intended to use the practices discovered by the project to support soil microbes on their farm (one-sample Wilcoxon signed-rank test with continuity correction; v = 2850; P value = 7.836 × 10⁻¹⁵; alternative hypothesis = true location is not equal to 3 [on a 5-point Likert scale where 3 = neutral]) (mean = 4.38; median = 4.00; SD = 0.67) (Fig. 3b, c; Table S1 Q2). Overall, participants also agreed that farming practices, rather than inoculants, were the most effective way to promote soil microbes that enhance pest suppression, indicating the importance of beliefs for mediating farming practice adoption (two-sample Wilcoxon signed-rank test with continuity correction; v = 6293.5; P value <2.2 × 10⁻¹⁶) (practices [mean = 4.60; median = 5.00; SD = 0.52]; inoculants [mean = 3.06; median = 3.00; SD = 0.76]) (Fig. 3d; Table S1 Q1).
Response of participants to statements ranking: (a) beliefs in the pest-suppressive microbiome on their farm; (b) knowledge acquisition as reason for participation; (c) intent to use practices discovered by project; and (d) the most effective way to promote soil microbes that enhance pest suppression. Values of the x-axis in ‘a’ and ‘d’ are ordinal factor levels of 1 = strongly disagree; 2 = disagree; 3 = neither agree nor disagree; 4 = agree; 5 = strongly agree. Values of the x-axis in ‘b’ and ‘c’ are ordinal factor levels of 1 = strongly disagree; 2 = disagree; 3 = neutral; 4 = agree; 5 = strongly agree. Vertical lines in panels ‘a–c’ indicate value used as ‘mu’ in the one-sample two-sided Wilcoxon rank-sum tests.
Farmers believe on-farm management and external factors promote the microbiome
To cluster farmers by their beliefs, we used principal component analysis with varimax rotation and affinity propagation (Fig. 2a, b). We determined seven clusters (each representing a group of farmer beliefs) were the most stable solution (approximately 22.5% of solutions were formed of seven clusters, see Fig. 2a). Stable clustering solutions are indicated by long straight segments where variation in the quantile (q) parameter yielded the same number of belief clusters (Fig. 2a). The number of farmers per cluster given by the optimal clustering solution (see square dark blue point; Fig. 2a) ranged from 2 to 23 participants (mean = 11.85; median = 11) (Fig. 2b; Tables S5 and S6). The median quantile value (q = 0.5) yielded a highly unstable solution of ten clusters and was excluded from further analysis (see red square point; Fig. 2a). There were seven exemplars representing the beliefs of each cluster (see square points; Fig. 2b). Distance from the exemplar in the two-dimensional principal component coordinate plane indicated within cluster variation in farmer beliefs (see lines connecting circular and square points; Fig. 2b). Two clusters of farmers were located on the positive portion (see dark blue and teal points; 24 farmers; ≈29%) and three clusters were located on the negative portion (see pink, red, and green points; 24 farmers; ≈29%) of the first rotated component (RC1) (Fig. 2b). These farmers indicated a greater (positive values) or lesser (negative values) belief in the importance of factors external to the farm for influencing pest-suppressive soil microbiomes. The final two clusters were located near zero for RC1 (see yellow and black points; 34 farmers; ≈41%) and represented farmers that believed external factors were not at all, slightly, or somewhat important for influencing pest-suppressive soil microbes on their farm (Fig. 2b). On the third rotated component (RC3), three clusters of farmers indicated on-farm practices and characteristics were very important for supporting pest-suppressive microbiomes (see dark blue, teal, and green points; 35 farmers; ≈42%) (Fig. 2b). Two clusters of farmers (see pink and yellow points; 15 farmers; ≈18%) were in the negative portion and two clusters were located near zero (see black and red points; 34 farmers; ≈41%) for RC3 (Fig. 2b). These farmers indicated on-farm practices and characteristics were not at all, slightly, or somewhat important for supporting pest-suppressive microbiomes on their farms. One group of farmers clustered in the center for both RC1 and RC3 (see black points; 23 farmers total; ≈28%). These farmers indicated all factors were somewhat important for influencing the soil microbiome on their farm (Fig. 2b). Taken together, while our results indicate most farmers agree that farming practices promote the pest-suppressive microbiome (≈96%; Fig. 3a), there is less of a consensus on the importance of on-farm and external factors for supporting these microbiomes (Fig. 2b). However, approximately 42% of farmers did believe on-farm and external factors were important for promoting pest-suppressive microbiomes (35 farmers; Fig. 2b).
Belief profiles, demographics, and farm characteristics for each cluster are given in Table 2. Qualitatively, demographics and farm characteristics varied across the clusters and the rotated components, with each cluster representing unique combinations of these metrics (Tables S5 and S6). However, due to our sample size (n = 85) profiles and numerical summaries of the demographics and farm characteristics of our clusters should be treated with caution because some variables (e.g., farmer educational attainment) overlap across clusters (Tables 2, S5, and S6). Moreover, the sixth cluster (see pink points; Fig. 2b) was excluded from statistical analysis (see below) because of low membership (n = 2 farmers). We did not detect spatial autocorrelation among clusters using Moran's I (Fig. S2).
Qualitative description of cluster belief profiles, demographics, farm characteristics, and production practices
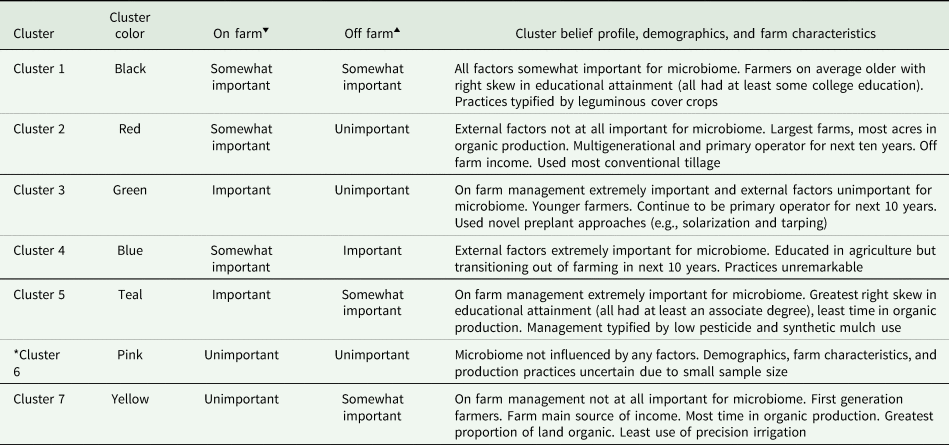
Profiles are unique characteristics of a cluster relative to all others. Numerical summaries of demographic and farm characteristics are in Tables S5 and S6.
*Demographics and farm characteristics unreliable due to low cluster membership (n = 2).
‘▾’ Believed importance of on farm factors for pest-suppressive soil microbiome for cluster.
‘▴’ Believed importance of off farm factors for pest-suppressive soil microbiome for cluster.
Belief that on-farm factors mediate soil microbes is associated with practice adoption
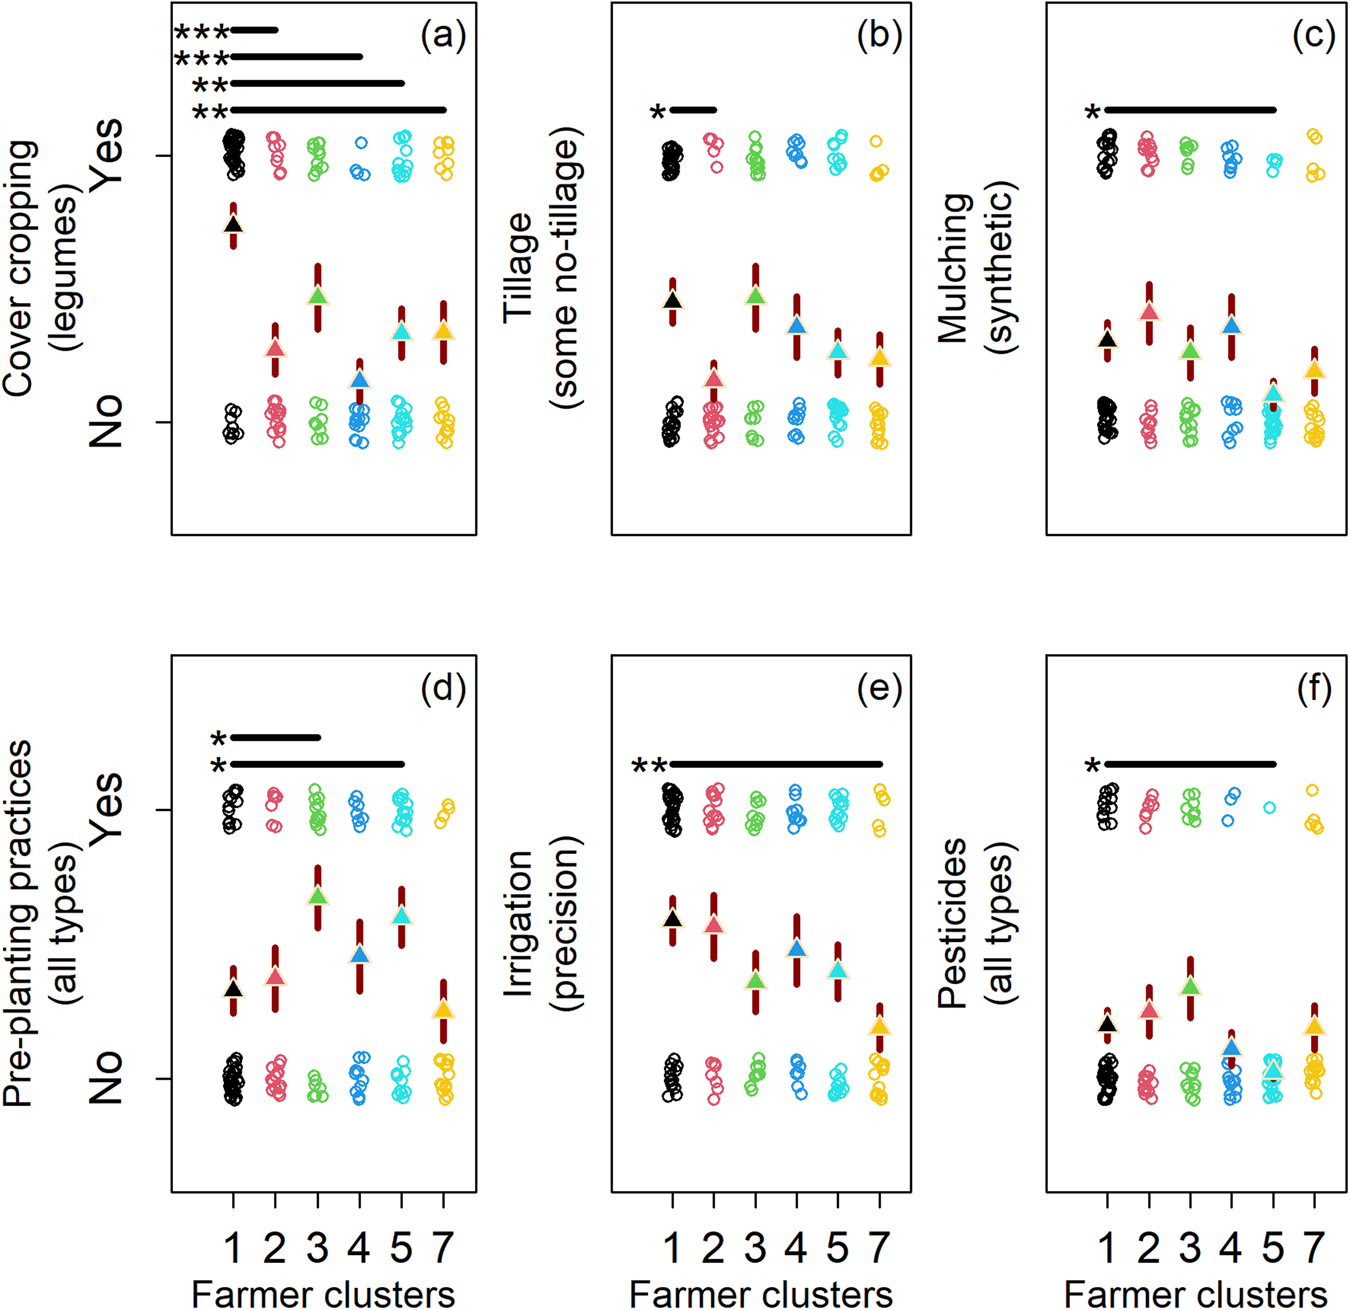
There was considerable overlap in practice adoption across farmer clusters with different microbiome beliefs (Fig. 4). Most farmers did not use conservation tillage practices (≈43%; Fig. 4b) (median = 0; SD = 0.50), synthetic mulches (≈36%; Fig. 4c) (median = 0; SD = 0.48), pre-planting practices (≈39%; Fig. 4d) (median = 0; SD = 0.49), or pesticides (≈26%; Fig. 4f) (median = 0; SD = 0.44) (adoption coding: no = 0; yes = 1). However, some belief clusters were correlated with the adoption of unique production practices (Fig. 4b–f; Table 2). Participants who believed on-farm management and farm characteristics are important for microbiome-mediated pest suppression (Fig. 2b; see teal and green points; most positive on RC3), were less likely to use pesticides and synthetic mulch (Fig. 4c, f; see teal points), and more likely to use pre-planting practices (e.g., solarization; Fig. 4d; see teal and green points), which may serve to promote beneficial microbiome biodiversity. Whereas, participants that believed on-farm management and farm characteristics are not important for the microbiome (Fig. 2b; see yellow points; most negative on RC3) were less likely to use precision irrigation (Fig. 4e). Similarly, farmers that believed external factors are not important for the microbiome (Fig. 2b; see red points; most negative on RC1), used tillage more commonly, a practice known to disrupt the microbiome (Fig. 4b). Taken together these results confirm our hypothesis by suggesting farmers who believe on-farm factors mediate pest-suppressive soil microbes adopt more microbiome-supportive practices than peer participants. Statistics supporting beliefs models are found in Tables S7–S12 (Fig. 4).
Changes in seven farming practices (a–f) by farmer clusters (1–5 and 7). Farmer clusters were found through affinity propagation (see Fig. 2). Cluster six was excluded from statistical analysis because of low membership. Farming practices (a–f) shifted across clusters, with each cluster defining a farmer's beliefs of the factors (on and off farm) mediating the pest-suppressive microbiome. Circles are response data from our farmer questionnaire. Triangles are logistic model predictions in the response scale. Red lines behind triangles are standard errors from model predictions. All models used the cluster at the origin of the rotated components (RCs 1 and 3) as the intercept (see cluster 1).
Microbiome-supportive practice adoption correlates with small farms and less time in organic
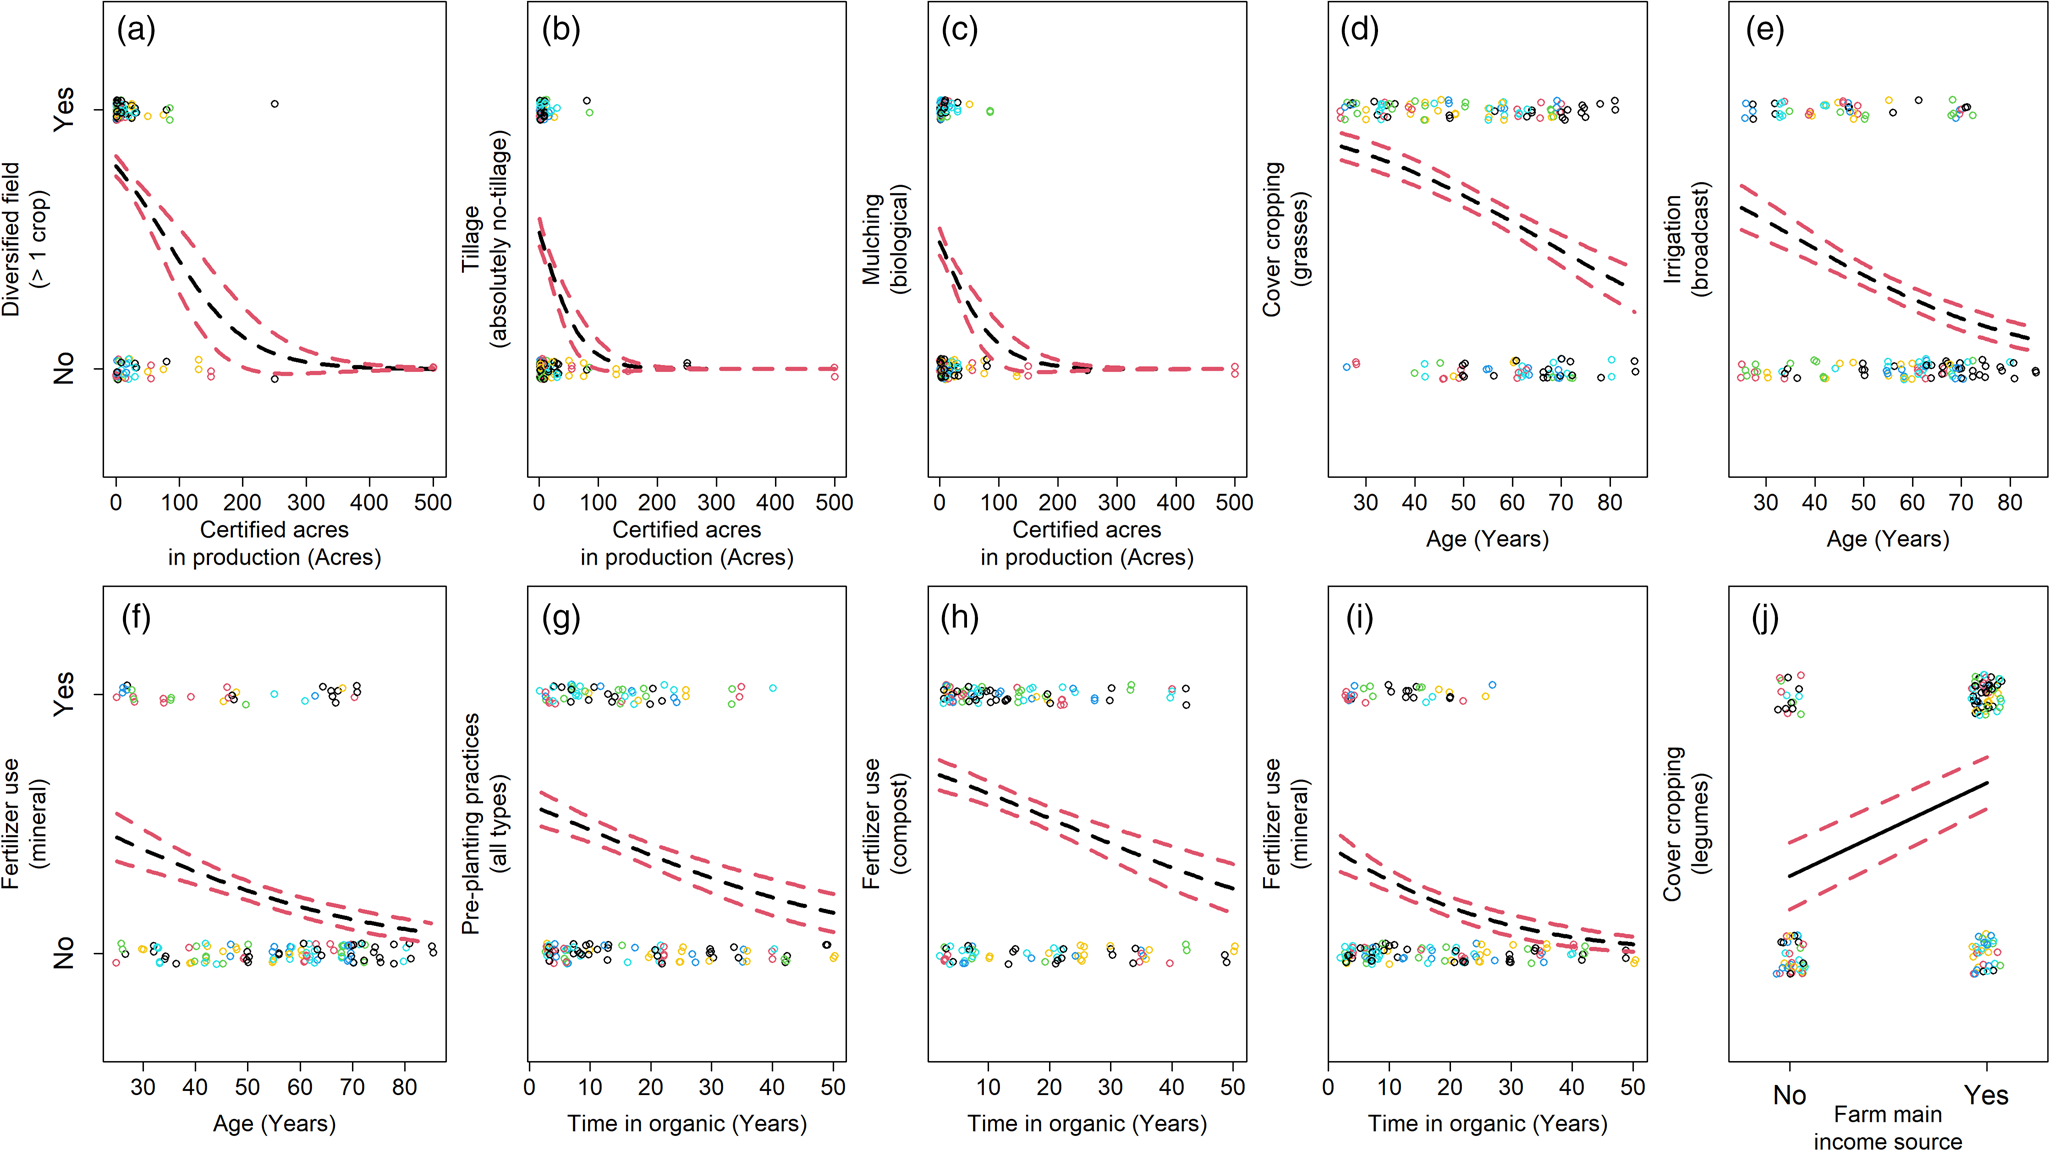
Some farm characteristics and farmer demographics were associated with unique changes in practice adoption (Fig. 5; Tables S7–S12). Increased acreage in organic production was associated with decreased crop diversity, more tillage, and fewer biological mulches (Fig. 5a–c). These results suggest microbiome-promoting practices are not adopted as frequently on larger farms. Long-term organic production correlated with decreased use of pre-planting practices, compost, and mineral fertilizers (Fig. 5g–i). This suggests farms with less time in organic management more frequently adopt practices which are known to promote the microbiome. Older organic farmers were associated with decreased use of mineral fertilizers, grass cover crops, and broadcast irrigation (Fig. 5d–f) and farming as the main source of income was associated with the use of legumes in cover cropping (Fig. 5j). Adoption of cover cropping and the use of pre-planting practices were associated with both farmer beliefs and demographics (Figs 4a, d and 5g, j), suggesting some demographics can serve as proxies for beliefs. Further details on model complementarity are found in the Supplemental Information.
Change in nine farming practices (a–j) by farming system characteristics and farmer demographics. Circles are response data from our farmer questionnaire, with circle colors associated with each farmer cluster (see Fig. 2). Black lines are logistic model predictions in the response scale. Red dashed lines are standard errors from model predictions.
Reduced pests, increased yields, and environmental benefits motivated farmers
One hundred percent of participants (n = 85) reported that observable reductions in insect pest damage was very or extremely motivating when adopting a new practice that supports pest-suppressive soil microbes on their farms (Fig. 6a; Table S3 Q11). Participants found increased marketable yields and benefits to the environment (e.g., species conservation), similarly motivating (Fig. 6b, c; Table S3 Q11; Table S13). While not as motivating as observable reductions in insect pest damage, ease of integration with existing practices, reduced labor costs of controlling pests, conference workshops (e.g., a local or regional organic farming conference), and recommendations made by extension persons, were all greater than somewhat motivating for farmers when deciding to adopt a new practice to support the pest-suppressive microbiome (Fig. 6d–g; Table S3 Q11). Conversations with a neighbor, a microbe-friendly farming labeling scheme, recommendation by a commercial advisor, and a request made by a customer were all skewed toward somewhat, slightly, or not at all motivating (Fig. 6h–k; Table S3 Q11).
Response for 11 statements (a–k) assessing motivations for adopting new practices to support the pest-suppressive microbiome. Summed response (l) for motivations by participant across farmer clusters (1–5 and 7). Vertical lines and statistics (‘v’ and ‘p’) in panels ‘a–k’ indicate value used as ‘mu’ in the one-sample one-sided Wilcoxon rank-sum tests and test results, respectively. In ‘l’ triangles are linear model predictions in the response scale and red lines behind triangles are standard errors from model predictions. For ‘a–k’ NS indicates P values >0.05. For ‘l’ * and *** indicate P values <0.05 and <0.001, respectively.
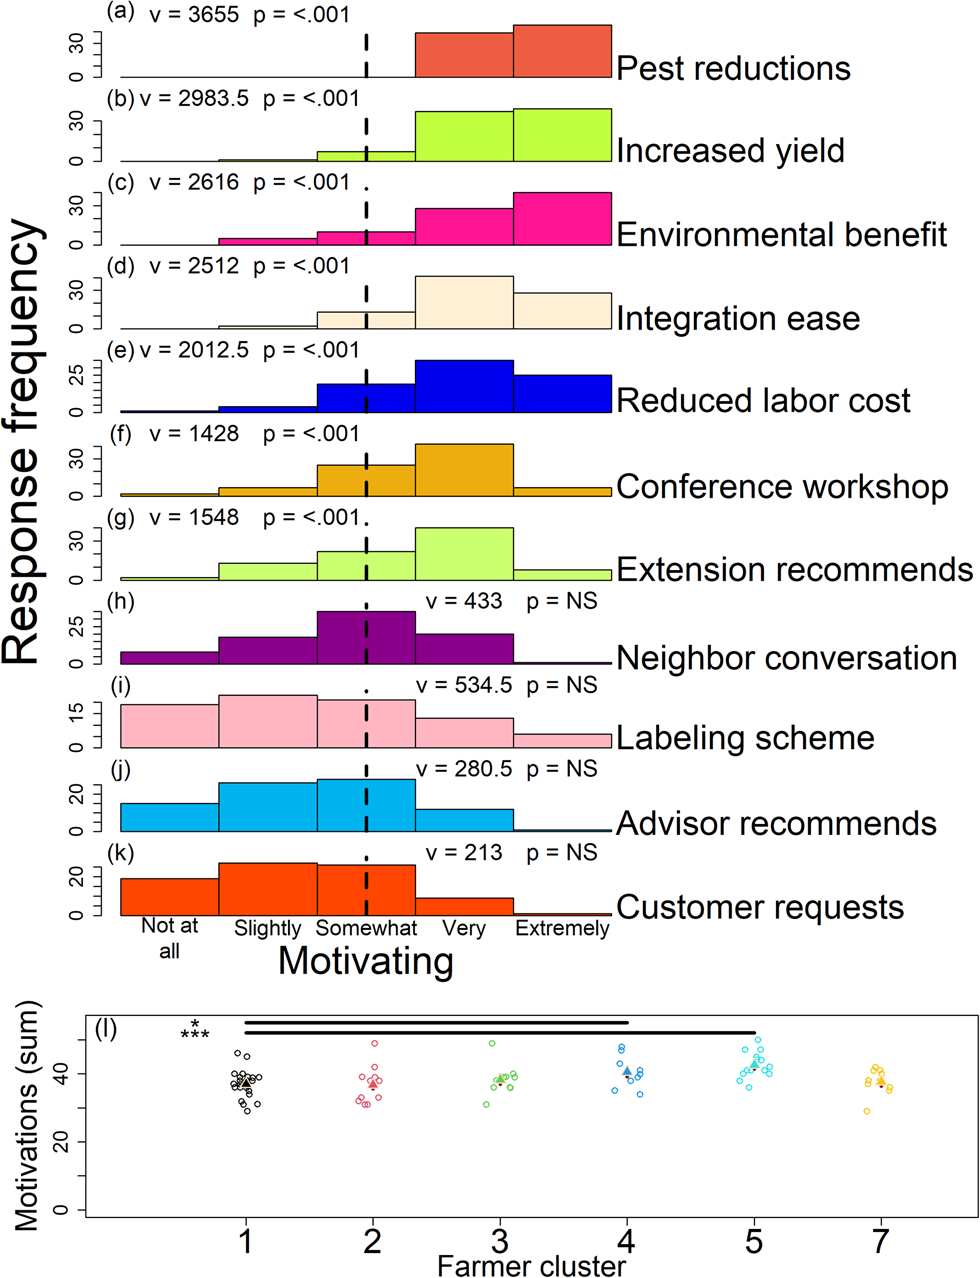
Farmer microbiome beliefs were correlated with the sum of their motivation scores (Fig. 6l; Table S3 Q11; Table S14). Here, the Likert scale scores were summed across the 11 motivation statements by farmer (Fig. 6a–k; Table S3 Q11). Farmers that believed on-farm and external factors mediate their soil microbiome (Fig. 2b; see dark blue and teal points; most positive clusters in RC1 and RC3) were more motivated to adopt practices that support the pest-suppressive soil microbiome when compared to the other farmer groups (Fig. 6l; Table S3 Q11; Table S14). Our information theoretic approach indicated motivations mediating the adoption of pest-suppressive microbiome practices were not correlated with demographics and farm characteristics (Fig. 6l; Table S14).
Discussion
Organic farms vary in production practices, mediating gradients of biodiversity and ecosystem services (Buck, Getz and Guthman, Reference Buck, Getz and Guthman1997). Production practices are linked to environmental, social, and economic beliefs held by farmers (Jabbour et al., Reference Jabbour, Gallandt, Zwickle, Wilson and Doohan2014). We hypothesized that adoption of microbiome-supportive practices by organic farmers is driven by variation in their microbiome beliefs. Our results indicate most farmers believe that soil microbiomes increase plant defenses and suppress pest populations (≈96% of farmers). However, our cluster analysis indicated farmer beliefs varied significantly. Participants that believed on-farm practices and characteristics were most important for cultivating pest-suppressive microbiomes (≈42% of farmers) adopted more unique practices that may promote microbe conservation. These farmers were also more motivated to adopt new practices to support the microbiome than their peers. Microbiome-supportive practices increased on farms that were smaller, served as the primary income source, had less time in organic management, and were operated by younger participants. Time in organic management and income source also served as proxies for beliefs in assessing current farming practices. However, only beliefs correlated with motivations to adopt future microbiome-supportive practices, and these motivations were linked with economic, social, and environmental variables.
Across study participants we show organic farmers believe in and are willing to adopt new practices that support beneficial soil microbes. We are also the first to document consistencies between organic farmer microbiome beliefs and the scientific literature. Surveys of farmer pathogen beliefs are well established (Vergne et al., Reference Vergne, Guinat, Petkova, Gogin, Kolbasov, Blome, Molia, Ferreira, Wieland, Nathues and Pfeiffer2014; Kisomi et al., Reference Kisomi, Wong, Tay, Bulgiba and Nizam2019; Mbinda et al., Reference Mbinda, Kavoo, Maina, Odeph, Mweu, Nzilani and Ngugi2021; Rehman et al., Reference Rehman, Shehzad, Andriyani, Effendi, Abadeen, Khan and Bilal2023) as are assessments of beliefs in antimicrobial resistance (Ozturk et al., Reference Ozturk, Celik, Sahin, Acik and Cetinkaya2019; Gemeda et al., Reference Gemeda, Amenu, Magnusson, Dohoo, Hallenbery, Alemayehu, Desta and Wieland2020). However, these studies focus on assessing farmer knowledge of disease-causing microorganisms they may routinely encounter (Rehman et al., Reference Rehman, Shehzad, Andriyani, Effendi, Abadeen, Khan and Bilal2023) rather than communities of beneficial microorganisms. Organic farmers in our study also believed farming practices, rather than inoculants, support the pest-suppressive microbiome. Few microbiome inoculants have empirical benefits, indicating participant beliefs were consistent with prior research (Schonbeck, Jerkins and Lowell, Reference Schonbeck, Jerkins and Lowell2019). Organic agriculture historically promoted microbiome research, such as studies by Sir Albert Howard, Rudolf Steiner, and Eve Balfour (Balfour, Reference Balfour1949; Koepf, Pettersson and Schaumann, Reference Koepf, Pettersson and Schaumann1990; Howard, Reference Howard2006). It remains unclear whether our participants’ inoculant beliefs are derived from historical literature, although ≈70% use books as information sources. Conversely, a minority of respondents in our study (≈29%) indicated factors already known to mediate the soil microbiome (e.g., crop diversification) were not important for mediating the microbiome within their farm (French et al., Reference French, Kaplan, Iyer-Pascuzzi, Nakatsu and Enders2021). Here we highlight the importance of assessing the consistency of farmer beliefs and scientific evidence which can be used to address farmer misconceptions and promote sustainable agriculture (Jabbour et al., Reference Jabbour, Zwickle, Gallandt, McPhee, Wilson and Doohan2013). Future research could study the origins of farmer microbiome beliefs to identify the ecological knowledge that is most helpful for promoting microbiome conservation (Warbrick, Heke and Breed, Reference Warbrick, Heke and Breed2023). When inconsistencies occur between scientific evidence and beliefs, we refer practitioners to learning theory which suggests engaging initial beliefs to promote the adoption of new concepts and information (NRC, 2000). Finally, we found farmers participated in our study to gain microbiome knowledge. Bloom and Crowder, (Reference Bloom and Crowder2020) also found volunteers engaged in conservation research for educational reasons, suggesting the generality of knowledge acquisition as a motivation. The importance of knowledge acquisition additionally suggests the need for research that actively engages participants to encourage the adoption of practices that will support the pest-suppressive microbiome.
Our findings further suggest that organic farmers vary in their beliefs of which practices are most important for cultivating pest-suppressive microbiomes. Comparisons of organic and conventional farmer beliefs are well established (Taylor, Dobbs and Smolik, Reference Taylor, Dobbs and Smolik1992; Sullivan et al., Reference Sullivan, Mccann, De Young and Erickson1996; Comer et al., Reference Comer, Ekanem, Muhammad, Singh and Tegegne1999), as are studies that evaluate beliefs as determinants of organic farming adoption (see Han, Arbuckle and Grudens-Schuck, Reference Han, Arbuckle and Grudens-Schuck2021 among others). These studies expose the differences in perceptions between farmers, allowing researchers and policymakers to address farmer beliefs and promote the adoption of sustainable agriculture. To date, however, little emphasis has been placed on understanding variation in beliefs across organic farmers. Shreck, Getz and Feenstra (Reference Shreck, Getz and Feenstra2006) and Brigance et al. (Reference Brigance, Mas, Sanchez and Handal2018) documented variation in beliefs across populations of organic farmers in New Mexico and California, who differed in their perceptions of organic agriculture as socially and economically sustainable. We suggest this variation in beliefs extends to the factors mediating the microbiome and organic farmers likely exist along multiple undocumented belief spectrums. Beliefs, however, are often ignored when developing farmland conservation programs (Rose, Keating and Morris, Reference Rose, Keating and Morris2018). Consequently, policymakers and researchers attuned to variation in organic farmer beliefs could design policies and outreach programs that take beliefs into consideration, optimizing the adoption of practices that support the microbiome and biological control.
Beyond exploring belief heterogeneity, our research is providing the foundation for socio-ecological models which position beliefs as an indirect cause of ecosystem service provisioning (Rose, Keating and Morris, Reference Rose, Keating and Morris2018). The application of socio-ecological models to organic agriculture is limited with few studies exploring how farmer beliefs, demographics, and farm characteristics lead to pest management outcomes (Jabbour et al., Reference Jabbour, Gallandt, Zwickle, Wilson and Doohan2014). In one approach, Comer et al. (Reference Comer, Ekanem, Muhammad, Singh and Tegegne1999) built an empirical model which suggested beliefs and education mediated the adoption of sustainable agriculture. Building on the literature, our findings also suggest socio-ecological models can leverage demographics (e.g., income source) and farming system characteristics as proxies for farmer beliefs. Thus, because beliefs are largely unobservable, demographics and farming system characteristics collected by the USDA (e.g., time in organic management) could be used to predict the overall adoption of production practices that mediate the soil microbiome. Our research also showed measurements of beliefs, rather than demographics and farming system characteristics were indicative of motivations to adopt future practices to support the microbiome. Similarly, Casagrande et al. (Reference Casagrande, Peigné, Payet, Mäder, Sans, Blanco-Moreno, Antichi, Bàrberi, Beeckman, Bigongiali, Cooper, Dierauer, Gascoyne, Grosse, Heß, Kranzler, Luik, Peetsmann, Surböck, Willekens and David2016) found beliefs were the most important determinant of motivations to adopt soil conservation practices. We suggest examining beliefs is key for understanding farmer motivations, and thus critical when determining how best to promote the adoption of novel innovations for conserving the pest-suppressive microbiome in farming systems.
Our analysis of specific social, ecological, and economic motivations can further guide research and extension efforts. In terms of motivating adoption, future ecological research should focus on proving links between soil microbiome conservation and observable reductions in pest populations. Changes in pest populations are a common motivating factor when adopting a novel pest management approach (Pilcher et al., Reference Pilcher, Rice, Higgins, Steffey, Hellmich, Witkowski, Calvin, Ostlie and Gray2002; Sharifzadeh et al., Reference Sharifzadeh, Abdollahzadeh, Damalas and Rezaei2018). Therefore, we suggest on-farm trials that demonstrate reductions in pest populations due to microbiome conservation are key for adoption. When on-farm trials are impractical, social motivations including recommendations from extension agents may promote adoption. In fact, >75% of our participants reported using information on farming practices from the Northeast Organic Farming Association of New York (NOFA-NY). Taken together, we suggest university extension and not-for-profit agencies (e.g., NOFA-NY) may play an important role in disseminating information on and promoting the pest-suppression benefits of the soil microbiome. Moving beyond individual farmers, we did not find spatial autocorrelation in microbiome beliefs. This was unexpected because organic farmer beliefs cluster geographically (Bălan et al., Reference Bălan, Toma, Dobre and Soare2015; Kuo and Peters, Reference Kuo and Peters2017). Nevertheless, extension planning via the use of belief typologies should allow for targeted messages to subgroups and result in higher adoption of conservation programs (Lyle, Reference Lyle2015; Upadhaya, Arbuckle and Schulte, Reference Upadhaya, Arbuckle and Schulte2021). Thus, we suggest adapting diverse educational efforts that account for local belief heterogeneity will be key when disseminating information and motivating farmers to adopt microbiome conservation measures that promote pest suppression.
Extension efforts aimed at promoting microbiome conservation should also consider farming system characteristics and farmer demographics. We show that some farming practices known to promote microbiome conservation decreased with increasing farm size, time in certified organic production, and farmer age. These changes in farming practices could represent increased intensification and mechanization for the purpose of specialization (e.g., the loss of crop diversification in larger farms) and a refinement of practices to suit local biotic, abiotic, and societal conditions. These findings may also reflect previously reported conventionalization of organic systems (Buck, Getz and Guthman, Reference Buck, Getz and Guthman1997). Farming communities with these characteristics (e.g., large farm sizes) may be vulnerable to the loss of ecosystem services mediated by the microbiome. For example, Liebert et al. (Reference Liebert, Benner, Kerr, Björkman, Master, Gennet, Gómez, Hart, Kremen, Power and Ryan2022) found larger organic farms used fewer agroecological practices including intercropping and reduced tillage. We suggest conventionalized organic farming may be linked with local declines in the microbiome. However, these correlations must be empirically tested. For example, the loss of some practices, including mineral fertilizer use in older farms, may result in the optimization of ecosystem services because these practices may suppress microbe populations on farms with less time in organic production. Our findings also indicate organic farms serving as the main source of household income increased use of leguminous cover crops, demonstrating that farmer income may be linked with efforts to promote the microbiome (Prokopy et al., Reference Prokopy, Floress, Klotthor-Weinkauf and Baumgart-Getz2008). Specifically, organic farmers may perceive cover crops as supporting on-farm income whereas the economic benefits of other practices linked with microbiome conservation (e.g., no-tillage) may be unclear. Thus, another direction for researchers will be to determine economic tradeoffs linked with microbiome conservation, which may help provide farmers with information needed for practice adoption. Taken together, our findings indicate an approach leveraging beliefs and meeting local farming system conditions may be ideal for promoting the adoption of microbiome-supportive practices.
There exist several caveats to our research including self-selection bias (Heckman, Reference Heckman, Eatwell, Milgate and Newman1990). Because our study was voluntary, farmers uninterested in the microbiome may not have participated and the beliefs of non-respondents remain unknown. As a result, interpretations of our findings should be restricted to NY organic farmers interested in the microbiome. However, this is arguably the population of interest when starting to study the determinants of microbiome conservation. Limitations in sample size (n = 85) also influenced cluster membership, indicating a tradeoff in allowing for variation in beliefs and statistical inference. While greedier solutions increase cluster membership (Bloom et al., Reference Bloom, Bauer, Kaminski, Kaplan and Szendrei2021), correlations between beliefs and practices may be obscured. More broadly, to parallel previously understood variation in the practices used on organic farms (e.g., a spectrum of conventionalization across organic farms), we suggest there also exists variation in beliefs, and allowing for this variation, while limiting in some regards (e.g., low membership groupings), promotes the untangling of correlations between beliefs and farming practice adoption. Nevertheless, correlations between the beliefs examined by our study and practice adoption should not be misunderstood as causation. The use of cover cropping, for example, regulates a suite of ecosystem services (Schipanski et al., Reference Schipanski, Barbercheck, Douglas, Finney, Haider, Kaye, Kemanian, Mortensen, Ryan, Tooker and White2014), and microbiome conservation is likely only one reason mediating adoption. Therefore, the beliefs composing the principal components used in our analysis do not infer a causal connection between beliefs and practices. Similarly, our results for beliefs and the factors motivating the future adoption of practices should not be viewed as causal, because many motivations (e.g., environmental) are not strictly linked with microbiome beliefs but motivations of organic farmers in general (Han, Arbuckle and Grudens-Schuck, Reference Han, Arbuckle and Grudens-Schuck2021). Taken together, while farmers may be behaving based upon microbiome outcomes, these causal links remain unknown.
Future research should focus on empirically linking variation in farmer beliefs with observable ecological changes in agroecosystems. We suggest clustering participants by their beliefs using affinity propagation presents an opportunity to construct socio-ecological models, particularly when sample sizes are large and it is physically untenable to study the ecology of all farming systems (Frey and Dueck, Reference Frey and Dueck2007). Specifically, affinity propagation selects exemplars that can be used to represent belief clusters when assessing difficult to measure ecological outcomes in agroecosystems. By working in interdisciplinary teams of researchers, social scientists can identify farmers representing belief clusters. Soil scientists and ecologists can then conduct targeted on-farm research that assesses the validity of farmer beliefs. Using feedback from on-farm observations, social scientists can then design messaging frames motivating farmers to challenge their ecological knowledge (NRC, 2000; Haden et al., Reference Haden, Niles, Lubell, Perlman and Jackson2012). Teschner and Orenstein (Reference Teschner and Orenstein2022) for example leveraged a transdisciplinary team of ecologists and social scientists to address risk perceptions of cover crops aiding in the reduction of herbicide use by farmers. Rebaudo and Dangles (Reference Rebaudo and Dangles2013) further indicated the value of this approach by simulating a socio-ecological model linking changes in pest management with the temporal diffusion of information. Synthesizing across the literature, we suggest socio-ecological approaches that stimulate feedback between interdisciplinary teams of researchers, extension agents, and farmers will promote the adoption of farming practices that support the pest-suppressive microbiome.
Wider study of farms as socio-ecological systems, where beliefs and farming practices are linked with ecological outcomes, could have a multitude of benefits (Gaba and Bretagnolle, Reference Gaba and Bretagnolle2019). Researchers might expect greater adoption of new pest management tactics if these practices were developed specifically for the belief system of the farmer and if changes in farmer beliefs could be predicted (Läpple and Kelly, Reference Läpple and Kelly2013; Rose, Keating and Morris, Reference Rose, Keating and Morris2018). More broadly, greater adoption of sustainable pest management practices could yield environmental benefits for organic farming systems. While organic farms are more ecologically sustainable than conventional farms (Reganold and Wachter, Reference Reganold and Wachter2016), they represent a spectrum of practices used by different farmers (Bloom et al., Reference Bloom, Constancio, Hauri and Szendrei2022). Due to this spectrum, organic and conventional farms can have similar ecological outcomes (e.g., for the conservation of biological control agents) (Orpet et al., Reference Orpet, Jones, Beers, Reganold, Goldberger and Crowder2020). Moving forward, we propose that understanding the beliefs of farmers may be key to determining their motivations and promoting the sustainability of organic farming systems via soil microbiome-mediated pest suppression in the future.
Supplementary material
The supplementary material for this article can be found at https://doi.org/10.1017/S174217052400005X.
Data availability statement
Data available via the Figshare Digital Repository at 10.6084/m9.figshare.25146026.
Acknowledgements
We would like to thank our stakeholders D. Holmes, A. Vasilas, N. Stranieri, L. Murdock, L. McDermott, K. Campbell-Nelson, J Lerner, V. Drzewucki, R.M. Maher, M.T. McGrath, T. Rusinek, M. Nuckols, B. Perry, M. Henderson, D. Havas, M. Filippi, C.H. Crim, B. Claypoole, W. Walsh, and A. Dunn for their input during survey tool development.
Author contributions
E. H. B., S. S. A., and C. L. C. designed the experiment. E. H. B. created the survey tool, developed scripts for modeling and data visualizations. All authors contributed text, edited, and approved the final manuscript.
Funding statement
Funding for this work was provided to E. H. B., S. S. A., and C. L. C. by USDA AFRI Postdoctoral Fellowships (grant number: 2021-67012-35042) and a USDA ORG Grant to E. H. B. and C. L. C. (grant number: 2022-51106-38007).
Competing interests
None.


 Open access