


No intervention in severe mental illness will ultimately succeed without the development and maintenance of good relationships between patients and staff. These relationships demand a continuity that is prized by patientsReference Crawford, de Jonge, Freeman and Weaver1, Reference Sanatinia, Cowan, Barnicot, Zalewska, Shiers and Cooper2 and lauded by government agencies.3 But, however desirable, does continuity actually affect clinical outcomes? A study of 100 community patients with all diagnoses followed up for 20 monthsReference Bindman, Johnson, Szmukler, Wright, Kuipers and Thornicroft4 found no relationship between ease of access, allocation of care coordinators and breaks in care with clinical outcomes, but the authors accepted that their analysis was too limited for the complex relationships revealed. A systematic review by Puntis et al Reference Puntis, Rugkasa, Forrest, Mitchell and Burns5 concluded that using too many different measures of continuity (many listed by SaulzReference Saultz6), as well as of outcomes, meant that this important question remains unanswered. If, in the face of financial restrictions, continuity can be seen as merely an agreeable luxury, current reorganisation (or ‘transformation’) in mental health services in the UKReference Gentleman7, Reference Gilburt8 can continue without restraint. It is urgent that services rapidly develop the use of routinely gathered data to track the impact of these changes on continuity and clinical outcomes.
We therefore decided to relate longitudinal changes in routinely gathered data from the Health of the Nation Outcomes Scales (HoNOS)Reference Wing, Beevor, Curtis, Park, Hadden and Burns9 or, for older patients the HoNOS65+, to changes in a measure of continuity of care. We chose services for people with schizophrenia as individuals with long-term conditions like this are the most vulnerable to disorganised services. The organisational context in which the study took place can be partly described by examining rates of team change – the number of new and closed community teams for these patients – over the duration of the study. We wanted to use a continuity measure that was independent of current service models (for example the care programme approach in the UK10). Of the several sorts of continuity of care defined in severe mental illness,Reference Freeman, Weaver, Low, de Jonge and Crawford11 relationship and longitudinal continuity seemed to us most germane. We also thought it crucial that data should be already readily available for routine monitoringReference Johnson, Prosser, Bindman and Szmukler12, Reference Burns, Catty, White, Clement, Ellis and Jones13 rather than added temporarily for yet another research study. Any electronic patient record system now captures each face-to-face contact between a patient and a staff member outside in-patient units, allowing any one of several indices of relationship continuity to be routinely calculated at least in these settings. Therefore, the aims of the study were (a) to examine if there was any decline through the years 2006–2016 in continuity of care measured by the Modified Modified Continuity Index (MMCI)Reference Magill and Senf14 and HoNOS; (b) to investigate which factors contribute to any decline in these, if found, and (c) which of the HoNOS scales change significantly during the years for the examined population.
Method
The study took place in one South London National Health Service (NHS) mental health trust covering four London boroughs. The Trust has an electronic patient record system that was fully implemented by 2006 and is pseudoanonymised into the Clinical Records Information System (CRISReference Perera, Broadbent, Callard, Chang, Downs and Dutta15) for research. Data were extracted in February 2017. All ICD-10 diagnoses16 ever applied to patients were screened for any occurrence of the category F20 (schizophrenia) or F22 (persistent delusional disorder) together with subcategories of these. Patients referred from 2006 to 2016 aged over 16 in whom at least 75% of diagnoses made in adult mental health services were in either category and who had at least one episode of care outside in-patient units were included in the sample.
The number of new community teams and the number of teams closed each year in the Trust were calculated using the latest list of all teams since the Trust began, each with a unique site code. From a table containing the acceptance and discharge dates of every patient's relationship with each team, identified by site code, the dates on which the first patient was accepted by a new team, and on which the last was discharged and the team closed, were identified for each team. Teams that started or ended during the study were counted. All patients using community teams that were designated for patients with ‘psychosis’ (as described below) were included in this analysis of team changes across the Trust, not just those in the sample. Teams that were simply renamed with no change of staff were not included as they would not be assigned a new site code.
Data on all face-to-face individual contacts with staff outside in-patient settings (including crisis management and home treatment teams) between 2006 and 2016 for the patients in the sample were included from the data for all patients, apart from repeat contacts on the same day with the same staff member. The MMCIReference Magill and Senf14 was calculated for each calendar year in which any community contact took place. This is shown by:
 $$MMCI = \displaystyle{{1-(k{\rm /}(N + 0.1))} \over {1-(1{\rm /}(N + 0.1))}}$$
where k is the number of different staff seen and N is the total number of contacts with all staff in the year; results range from 0 if all staff were seen only once each to 1 if only one staff member was seen throughout.
The mean total HoNOS or HoNOS65+ scores for each patient was calculated for each year. If three or fewer HoNOS scale scores were missing the total score was calculated proportionately using the remaining valid scales. All community teams in contact with the patient are recorded. Three types of change can occur; transfer to a completely different team with different staff, transfer to a newly created, restructured team but with the same staff, or addition of contacts with a new team and new staff to the current one (‘co-working referral’). It was not possible to tell which of these applied, so the measure taken was the number of distinct community teams with which the patient was registered each year.
Demographic data available included the Index of Multiple Deprivation (IMD)17 for the first address each year with missing data by last observation carried forward. Process data included the number of distinct community teams involved with the patient each year. A future paper will examine the relationship between continuity and mortality and use of in-patient services.
Data analysis
Data were extracted from CRIS using Microsoft SQL Server 2008 R2, prepared using Visual Foxpro v9.0 and analysed with IBM SPSS v23 and R version 3.4.1. Descriptive statistics are presented as counts and proportions for categorical variables and as means and standard deviations for continuous ones. The IMD was treated as continuous. The generalised estimating equations (GEE) method was used to analyse longitudinal data. This takes into account the fact that observations within an individual are correlated, and estimates the population average across time. The estimated coefficients reflect the relationship between the longitudinal development of the dependent variable and the longitudinal development of the predictor variables, using all data.
Little's MCAR (missing completely at random) test was used to examine any systematic missing values. For GEE analysis an exchangeable working correlation matrix structure was assumed, with link function identity. The final most parsimonious model was conducted by dropping, one by one, the non-significant variables guided by the corrected quasi likelihood under independence model criterion (lower values – better fit). In order to examine whether any relationships found with HoNOS total scores were strongly associated with particular individual HoNOS scale change, change in individual HoNOS scales over the years were analysed using multivariate marginal models (R package mmm),Reference Asar and Ilk18 again with link function identity and exchangeable correlation structure. Effect sizes (d) were calculated following MorrisReference Morris19 using calculators by Lenhard & Lenhard.Reference Lenhard and Lenhard20
Ethics of research
CRIS was approved as a data-set for secondary analysis by Oxfordshire Research Ethics Committee C, reference 18/SC/0372. The use of data in this project was approved by the CRIS oversight committee ref 16-103.
Results
Team changes
Over the 11 years covered by this study 58 new community teams for all patients with psychosis were opened and 100 teams were closed. Some of these were small, specialist services; for larger teams (dealing with at least 100 patients) in the same period the numbers were 34 and 56, respectively. In 2010–2011 there was a major reorganisation of services for working age adults so that the patient's condition determined the teams caring for them rather than their address; generic community mental health teams were effectively abolished. A new division became specifically responsible for patients with ‘psychosis’– including affective psychosis, but primarily schizophrenia. Six new larger teams were created, but this was no greater than the number previously created in 2006 and 2007. A total of 18 larger teams were closed in 2011 (32.1% of all closures of larger teams in the study period). Different team reorganisations took place in different boroughs. For instance, in one borough within 3 years an assertive outreach team and four case management teams were combined into two promoting recovery teams and then split into four.
Descriptive statistics of the sample
Demographics, diagnostic categories and changes of teams responsible for the patient
Figure 1 shows the derivation of the patients and observations included in the analysis. The mean age of the 5552 patients included at first contact with the service was 46.48 years (s.d. = 16.82) and of them 3472 (62.5%) were males. The majority (n = 4621, 83.2%) had their main diagnosis in categories commencing F20 (schizophrenia) and the remainder (n = 931, 16.8%) in categories commencing F22 (delusional disorders). The distribution of ethnicity (for the 5463 patients with data) was as follows: Black (n = 2445, 44.8%), White (n = 2280, 41.7%), Asian (n = 330, 6.0%), mixed (n = 119, 2.2%), other (n = 289, 5.3%). In total, 36 030 valid patient/year observations were analysed. Over the 11 years there were 10 408 (28.9%) patient/years in which more than one community team was involved with a given individual whereas in the remaining 25 622 (71.1%) only one team was involved.
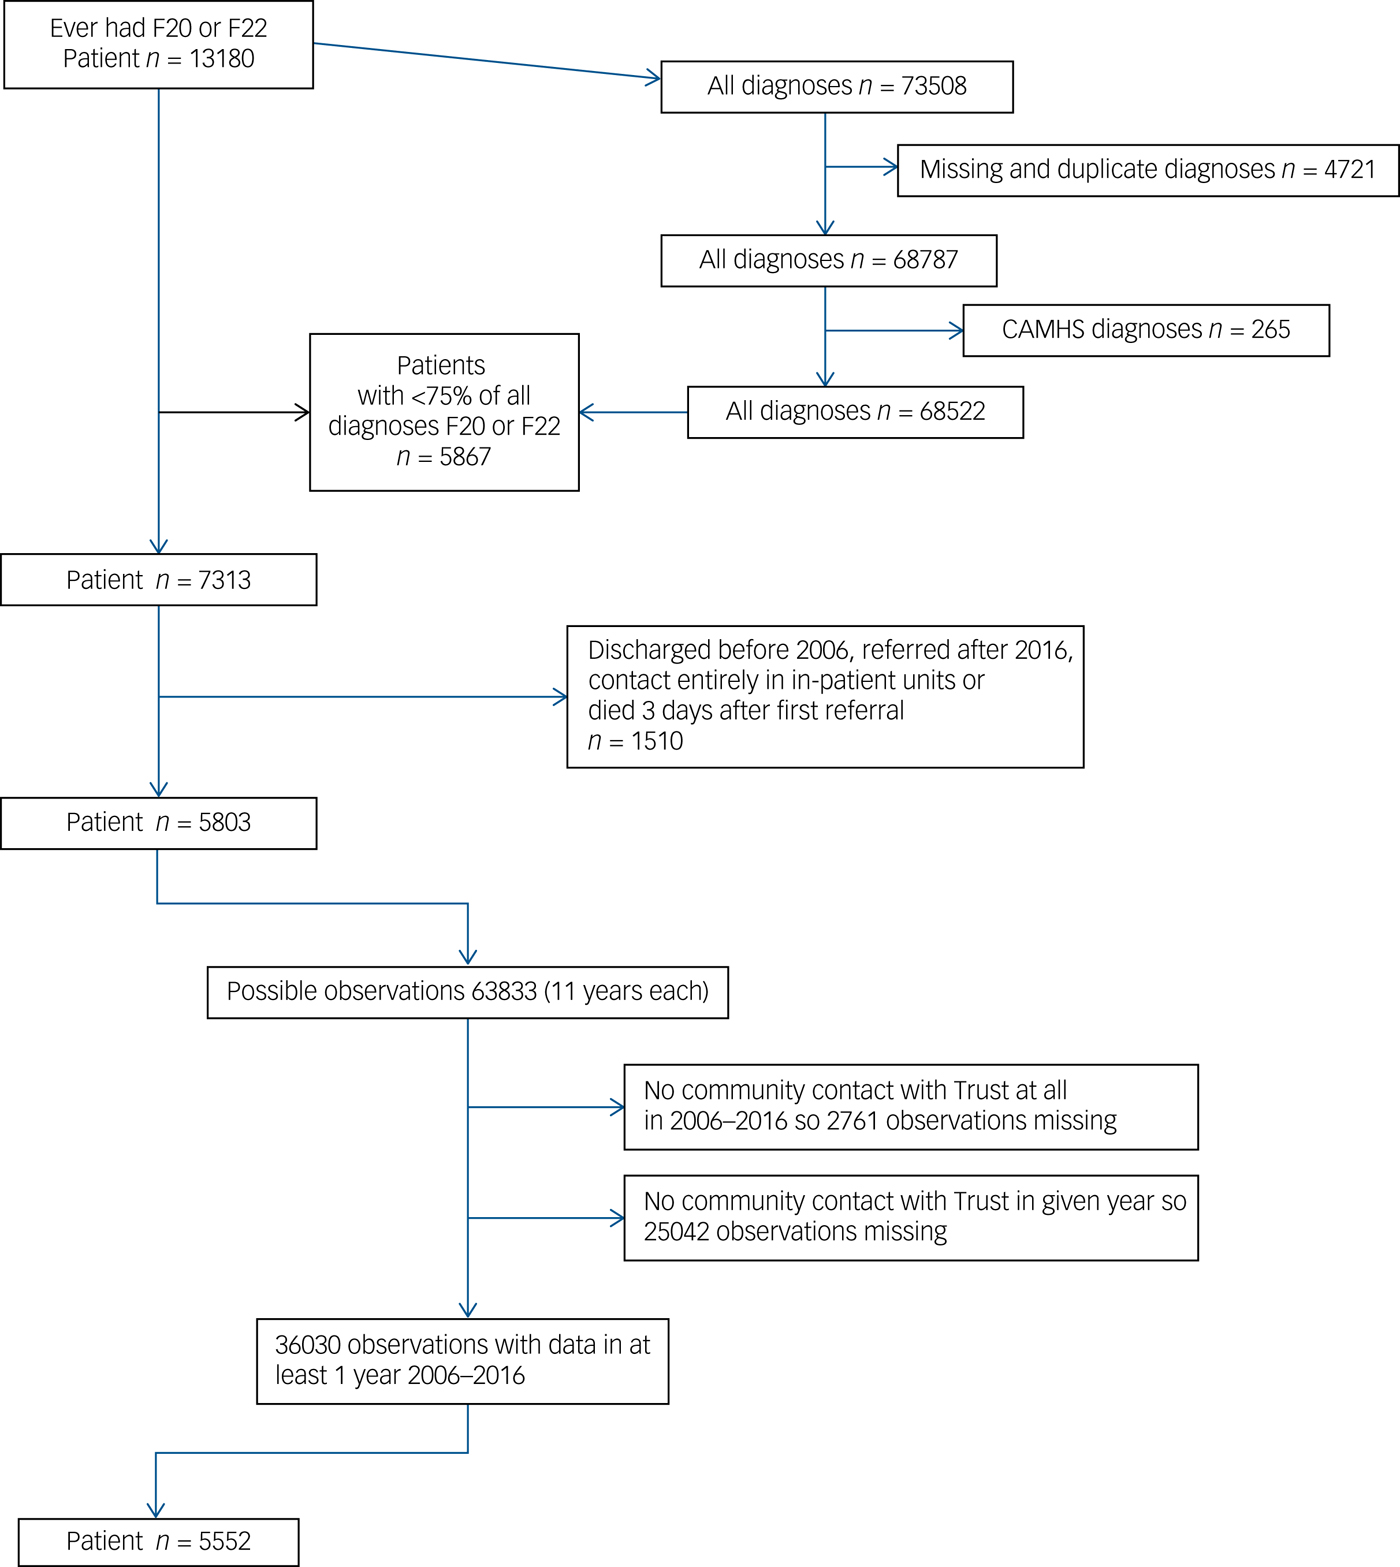
Fig. 1 Derivation of the patients included in the study in February 2017.
HoNOS, MMCI, IMD and number of teams during the years 2006–2016
The mean total number of annual valid HoNOS ratings per patient rose from 0.77 in 2006 to a peak of 2.14 in 2012 and then declined to 1.8 by 2016. The mean total number of annual contacts recorded per patient rose from 7.4 in 2006 to 15.8 in 2007 but changed little after then. Table 1 shows the means and standard deviations of the continuous variables HoNOS, MMCI and the mean number of community teams involved in the care of the patients in 2006–2016. The IMD was included as a possible confounding variable.
Table 1 Means and standard deviations of continuous variables each year
MMCI, Modified Modified Continuity Index; HoNOS, Health of the Nation Outcome Scales; IMD, Index of Multiple Deprivation.
Figure 2 shows the mean MMCI and mean total HoNOS scores by year, for years in which patients had any contact with staff. The MMCI fell more or less steadily throughout. HoNOS scores improved until 2009 and then rose more or less steadily.

Fig. 2 Change in Modified Modified Continuity Index (MMCI) and Health of the Nation Outcome Scales (HoNOS) total scores.
Inference statistics (longitudinal analysis of data)
Little's MCAR test (χ2 = 130.731, d.f. = 6511, P = 1.0) showed that the missing data appeared to be MCAR.
The effect of years on the MMCI and total HoNOS scores
For this longitudinal analysis two separate GEE models were constructed with years as independent. In the first the dependent variable was the mean MMCI and in the second the HoNOS total score. There was a significant decline of MMCIs over the years (Wald χ2 = 99.845, d.f. = 1 P < 0.0001) together with a significant increase (worsening) of HoNOS total scores (Wald χ2 = 118.441, d.f. = 1, P < 0.0001).
Effect of variables on MMCI over the years
To examine which variables were significantly associated with this MMCI decline over the years, an initial GEE model was constructed with the MMCI as the dependent variable and years (2006–2016), gender, age, ethnicity, number of teams caring for the patient, main diagnosis (F20 or F22) and IMD as independent variables. The final most parsimonious model is presented in Table 2. Higher MMCIs scores were significantly associated with older age, being involved with fewer community teams and in earlier years.
Table 2 Parameter estimates of the final generalised estimating equations models showing the effects of significant variables on the Modified Modified Continuity Index (MMCI) and Health of the Nation Outcome Scales (HoNOS)
a. The sign + or − in front of the estimates (B) shows the direction of the relationship with the dependent variable, for example the minus (−) in front of the B for years means that the MMCI is higher in the earlier years.
b. Repeated measures, pooled. Effects of 0.5 and above indicate strong effect.
The effects of variables on outcomes (total HoNOS scores) over the years
A model similar to the above model (Effect of variables on MMCI over the years), was constructed with the same independent variables but with total HoNOS scores as the dependant variable and reduced in the same way. The final most parsimonious model is presented in Table 2. Higher (worse) HoNOS scores were independently significantly related to older age, later years and both lower MMCI and more teams caring for the individual in each year.
Change in individual HoNOS scales over the years
Here the trajectory of each individual HoNOS scale was examined over the years. For this analysis a multivariate longitudinal model was used with each one of the 12 HoNOS scales as dependent variables and year as the independent. The results are shown in supplementary Table 1 available at https://doi.org/10.1192/bjp.2018.261. Only one scale (11: living conditions) improved (lower values) between 2006 and 2016. Scales 3 (problems with drugs or alcohol), 9 (problems with relationships), 10 (problems with activities of daily living) and 12 (problems with occupation/activities) did not contribute significantly to the overall decline. All other HoNOS scales showed a significant decline (higher scores) over the years.
Discussion
Main findings
These data confirm, at least in one large UK service, reports of declining relationship continuity of care for patients with schizophrenia such as that reported by Sanatinia et al Reference Sanatinia, Cowan, Barnicot, Zalewska, Shiers and Cooper2 but also presents evidence that this decline is associated with worse clinical outcomes.
Interpretation of our findings
A very high relationship continuity score would not reflect ideal multidisciplinary practice. At the same time no-one would approve of an MMCI of zero. There will probably be a ‘sweet spot’ or range which would reflect both good relationship continuity – say with a care coordinator or a support worker – along with the impact of useful other contacts from the team or others. We do not know what this value is, of course, so we can only examine trends. The MMCI declined overall during the study. If it was declining towards this ‘sweet spot’, rather than away from it, we would not have expected it to be correlated with worse outcomes over time.
The straightforward explanation of these findings is that declining relationship continuity disrupts patients, impairs communication and interferes with the best management of schizophrenia. However, other explanations require examination.
Fewer recorded contacts with staff in the first year of the study may have led to bias, since continuity is likely to be lower when there are more contacts. However, this did not apply after the first year, when continuity continued to decline. Lower rates of HoNOS completion in earlier years would have led to bias if lower total HoNOS scores were more likely to be recorded. However, in the programme of feedback of HoNOS data to teams in this Trust we have found a trend in the opposite direction – higher rates of completion of paired ratings are associated with slightly higher total initial scores.
The MMCI was calculated for all contacts identified as outside in-patient settings. This included crisis and home treatment team contacts. It is possible that worsening mental states led to extra team involvement and thus declining continuity. We had accurate data on whether contacts were in in-patient units or not, but not which community team was affiliated with each staff member at the time of each contact outside these units, so we could not control for this possibility. However, we had accurate data on the teams with which patients were referred, and relationship continuity was associated with worse outcomes independent of the number of teams to which the patient was referred each year.
For some patients schizophrenia is a progressive disorder, so as they become more disabled they require more attention from more staff from different disciplines, and therefore a greater probability of less continuity. However, the relationship between poorer outcomes and lower continuity reported here over the 11-year period was independent of the passage of time; also, the number of annual contacts, which perhaps should be a response to a worsening clinical situation, did not increase after the first year.
An opposite trend in both HoNOS and continuity scores at the start of the study period may have a number of explanations including a lag between changes in continuity of care and any impact of these on outcomes.
A decline in continuity might be seen as the price to be paid for involvement of more specialist teams in the care of an individual with the expectation of improved outcomes. However, the more community teams involved with the patient, the worse were the outcomes, and although lower relationship continuity appeared to be related to the number of teams involved these were operating independently in their relationship to poorer outcomes.
Finally, it is possible that, rather than decline in outcomes being caused by decline in relationship continuity, another factor causes both separately. Reduced resources available to the NHS have been met in mental health services, as opposed to others, without change in financial deficit ratesReference Gilburt21 implying that at least in these services resource reductions have been efficiently transmuted into lower staffing levels. There has certainly been a strident imperative in the last 5 years or so to discharge mental health patients to primary care as soon as they are no longer in an acute state. This might mean higher overall morbidity in remaining case-loads and thus worse outcomes measure scores. However, if the balance of reduced but more morbid case-loads with reduced staff numbers was sustained it is not clear why relationship continuity of care should continue to be independently related to further decline in outcomes unless the remaining staff were obliged to adopt more of a ‘duty rota’ approach rather than one aimed at sustaining relationships with individual patients.
Implications
It seems likely that the independent impact on outcomes of changes of team is a function of repeated service reconfiguration. The large-scale service reorganisation in 2010 together with the local ones before and afterwards affected patients with all diagnoses, not just schizophrenia. Figure 1 suggests that the decline in outcomes we report in these patients may be related to this upheaval, although, 5 years later, some improvement in outcomes may now be seen. However, as it has since been determined, at least in one part of the Trust, that this change did not achieve the goals set at the timeReference Tulloch, Soper, Pettit, Koeser, Polling and Watson22 further large-scale changes are once again now in progress, returning to a more locality-based focus. Although these goals were not clearly defined, such as could be determined were set entirely in terms of process quality and financial probity (see Fig. 5 in Tulloch et al)Reference Tulloch, Soper, Pettit, Koeser, Polling and Watson22 so the impact of the new configuration will presumably be judged on the same limited criteria. It seems that the clinical outcomes for vulnerable people with long-term severe mental illness experiencing yet a further period of team closure, division, amalgamation and creation may still not be taken into consideration. It seems unlikely that this is unique to this Trust.
The way in which structure, process and outcomes quality in health services are relatedReference Donabedian23 has been profoundly misunderstood. This has led to repeated political and management activity termed ‘redisorganisation’Reference Oxman, Sackett, Chalmers and Prescott24 by authors previously instrumental in evidence-based medicine. Hitherto this activity appears to have been without the restraint that routine clinical outcomes measurement can provide.
Our data suggest that the impact of declining relationship continuity is related to declining outcomes in schizophrenia in a way additional to, but independent of, redisorganisation of services. Within episodes with the same team, relationship continuity is declining and this is related to poorer outcomes. Our data do not indicate why this should be. Perhaps increasing pressure on teams means that it is no longer possible to maintain an irreducible case-load of people with long-term conditions without moving towards a de facto duty system within the team, rather than full implementation of the care programme approach? Or perhaps the disrespect of continuity manifest in repeated organisational change is somehow transmitted to everyday clinical decisions?
Hitherto, the repeated and sometimes quite casual restructuring of clinical services – not just in mental health – is regarded by observers with the sort of wry amusement found in Oxman et al.Reference Oxman, Sackett, Chalmers and Prescott24 We now suggest that the time for such levity in mental health provision is over.
Supplementary material
Supplementary material is available online at https://doi.org/10.1192/bjp.2018.261.
Funding
CRIS as a data resource was funded by the National Institute for Health Research (NIHR) Biomedical Research Centre at South London and Maudsley NHS Foundation Trust and King’s College London.


eLetters
No eLetters have been published for this article.