


In the first suicide terrorism act in the UK by Islamic extremists on the morning of 7 July 2005, four British young men killed themselves and caused the death of 52 and injuries to at least 700 commuters on London public transport. Although a terrorist attack had been expected, it was none the less highly disturbing particularly because the threat was internal and home-grown. Reference Tyrer1 Suicide terrorism has been shown to have substantial effects on the psychological and physical health of survivors. Reference Schuster, Stein, Jaycox, Collins, Marshall and Elliott2–Reference Rubin, Brewin, Greenberg, Simpson and Wessely4 Interestingly, Rubin et al Reference Rubin, Brewin, Greenberg, Simpson and Wessely4 reported a much lower prevalence of substantial distress among Londoners after 7 July 2005, compared with that reported in the general adult US population after 11 September 2001. Reference Schuster, Stein, Jaycox, Collins, Marshall and Elliott2 However, the effect of suicide terrorist attacks on the general population's suicide rate has been reported in few studies, yielding conflicting and contradictory results. Starkman Reference Starkman5 reported a 49% increase in the number of self-harm incidents over the 12 months following 11 September 2001 but made no reference to actual suicide figures either in his study or other studies from the USA. Suicide terrorist attacks in Israel between 1983 and 1999 were shown to have significant negative association with the suicide rate. Reference Lester6 Salib Reference Salib7 reported a brief but significant inverse effect on suicide in England and Wales after 11 September 2001 in contrast to De Lange & Neeleman Reference De Lange and Neeleman8 who reported an increase in suicide and self-harm in The Netherlands in the weeks following the attacks. The authors suggested that owing to a different perception of external threat by countries not directly affected by suicide attacks, the effect of 11 September may have been more acutely felt in the UK because of its cultural and historical relationship with the USA, but perhaps not so intensely in The Netherlands. Reference De Lange and Neeleman8
The aim of this study is to examine the effect of the 7 July 2005 suicide terrorist attacks on suicide rates in England and Wales. We hypothesised a much greater impact on suicide rates in the UK in response to the events of 7 July 2005 compared with those of 11 September 2001. The term ‘suicide’ used in our study refers to suicide and undetermined injury deaths combined.
Method
Data collection
Daily counts of suicides (ICD–10 9 codes X60–X84), undetermined injury deaths (ICD–10 codes Y10–Y34), and deaths due to natural causes, reported in England and Wales between 1 January 2001 and 31 December 2005 were obtained from the Office for National Statistics. The data-set consisted of daily frequencies grouped by gender, age and date of death. Suicide counts for the months of July since 1979 were extracted from the Office for National Statistics mortality data, supplied to the first author for a previous study. Reference Salib7 Corresponding mid-year adult population counts were also obtained from the Office for National Statistics in order to compute suicide rates per 100 000 over the age of 16 years (online Table DS1). We excluded four verdicts of suicide relating to the suicide terrorists themselves on 7 July 2005, thus reducing the daily count on 7 July from 16 to 12 incidents.
One-week periods beginning with Thursday 7 July, the day when the suicide terrorist attack took place, were taken as the basic unit of analysis. The day of the attack fell in week 237 of the 5-year series and in the 27th week of 2005. Data were aggregated and divided by the corresponding person-time at risk to obtain rates per 100 000 person-years. The variable referring to ‘rate difference’ was created by subtracting the mean suicide rate for years 2001–2004 from that for 2005 in the aggregated data-set of 260 periods. A rate difference of 0 indicated no change, whereas a rate difference <0 or >0 would indicate a reduction or an increase respectively, in suicide rates in 2005 compared with the previous 4 years. Covariates used in the regression analysis included binary variables for: individual years 2002–2005 (with 2001 as reference year); seasons and periods before and after 7 July for each of the 5 years. In the linear regression model, which used 2001 as a baseline rate, rate difference was computed by subtracting suicide rates for each year from that for 2001. We were able therefore to compare suicide rates in 2005 to actual rates in 2001 but also to obtain the mean rate of the previous 4 years.
Statistical analysis
Seasonally adjusted suicide daily counts were created by using the additive seasonal decomposition procedure (SPSS Version 10 for Windows) to control the confounding effects of seasonal variations in suicide on estimation of trend. The deseasonlised series (original series minus seasonal component) of daily suicide count for 2001–2005 was used in the analysis. Time trends in suicide over the study period were analysed using regression models, similar to those in De Lange & Neeleman. Reference De Lange and Neeleman8 The Durbin–Watson statistic Reference Draper and Smith10 was used to assess whether autocorrelation affected the data. This ranges from 0 through 2 (midpoint) to 4, indicating positive, absent and negative autocorrelation respectively. In our regression analysis, the value of the Durbin–Watson statistic varied around the midpoint (1.5–1.92) for all computed coefficients (suicide rates and suicide rate difference) as displayed in the results section, thus supporting the absence of an autocorrelation effect on the data. The exploratory use of the Cochrane–Orcutt procedure Reference Venables and Ripley11 to adjust for autocorrelation did not alter regression estimates. We used Shewhart Control Charts Reference Montgomery12 to explore daily and weekly suicide rate differences between 2005 and previous years (2001–2004). Observed suicide rate differences that fall outside the upper control limit or lower control limit are unlikely to have occurred by chance at a pre-specified significance level (P<0.01). The over-dispersion parameter was calculated by dividing the variance by the mean and is taken to be absent or minimal if the parameter approaches unity. As there was no evidence of over-dispersion, we used Poisson regression to model the expected number of suicide cases, non-negative integers, to be the product of the total deaths reported in 2005 multiplied by the suicide rate. This was achieved using an offset term to account for the number of adult deaths. Poisson regression models were fitted to daily and weekly suicide rates including indicator variables for days or weeks before and after 7 July 2005. The models also included the total number of daily or weekly adult deaths as an offset term. Model selection was based on Akaike's Information Criterion, which allows comparing non-nested models. Statistical analysis was carried out using SPSS Version 10 and R version 2.4.1 for Windows. 13
Results
Online Table DS1 summarises July's suicide rates for 1979–2005 in relation to total annual suicides and the corresponding mid-year adult population counts. The suicide rate reported in July 2005 (9.8/100 000 population) was the lowest of all July months for the period studied (the highest, at 16.7/100 000 population, was recorded in July 1983). As a proportion fo the total number of suicides for the year in question, the percentage for July 2005 (355/4340=8.2%) did not differ significantly from the percentages for the previous 26 years, suggesting that the reduction in suicide in July 2005 was probably due to a general declining trend in suicide incidence in England and Wales.
Figure 1 shows daily incidence of suicide over the whole year of 2005 after seasonal decomposition. The reductions, to the right of the reference line at 7 July, during the first and second weeks of July were among the lowest in that year. Similar reductions, however, on other days before and after 7 July can be also seen in the graph. Linear regression coefficients of annual suicide rates and rate difference over the 5 years, adjusted for autocorrelation, seasonality, and annual variations in suicide, and pre- and post-7 July variations in mortality, are shown in Tables 1, 2, 3. The adjusted coefficients indicate a steady decline clearly shown in the negative coefficients compared with 2001 suicide rates. The decline was evident in each of the 4 years, before and after 7 July, with the lowest regression coefficient value post 7 July in 2005 (Table 3), representing an estimated 16% reduction in suicide rate compared with the same period in 2001 and a 6% reduction observed in pre 7 July 2005, also comparable with the same period in 2001 (suicide rate difference (2005 and 2001)/2001 suicide rate multiplied by 100). There was no gender difference in the decline.
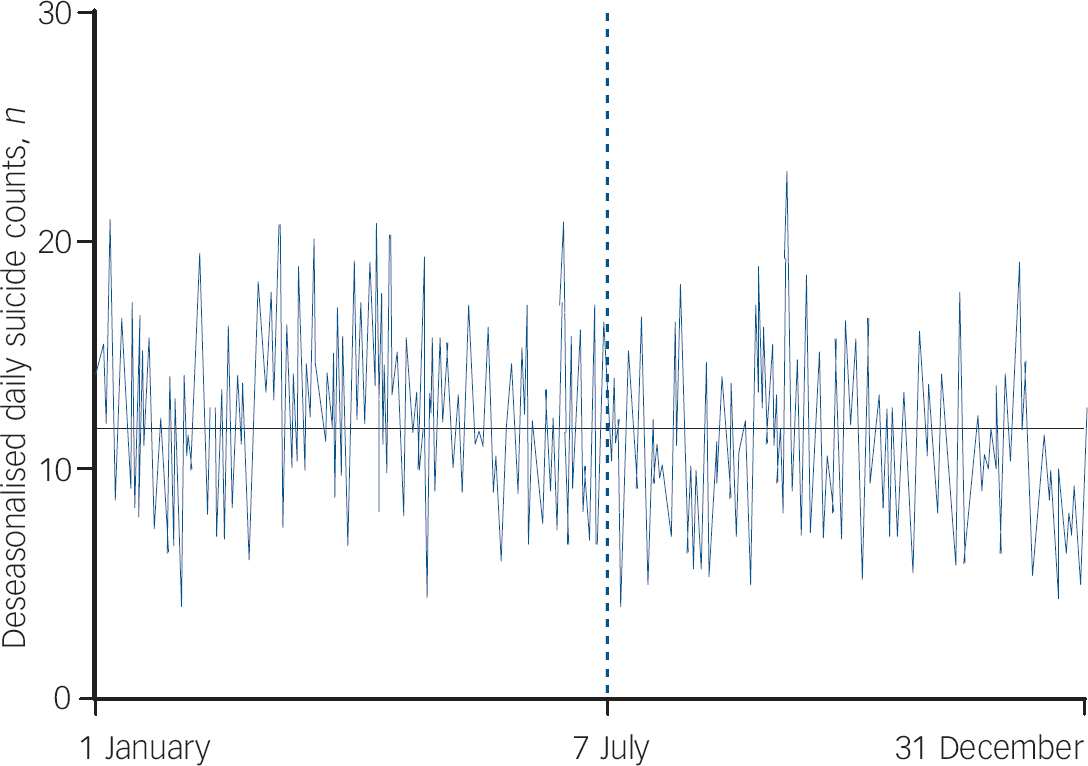
Fig. 1 Daily suicide in England and Wales, 2005.
Table 1 Overall suicide counts, rates and rate differences (regression coefficients), England and Wales: 2001–2005

| Year | Rate n (per 100 000 person-years) | Suicide rate (95% CI) | P | Rate difference (95% CI) | P |
|---|---|---|---|---|---|
| 2001a | 4703 (11.2) | (1) | (1) | ||
| 2002 | 4665 (11.1) | -0.13 (-0.60 to 0.34) | 0.59 | -0.13 (-0.72 to 0.49) | 0.69 |
| 2003 | 4659 (11) | -0.17 (-0.63 to 0.9) | 0.48 | -0.17 (-0.83 to 0.49) | 0.62 |
| 2004 | 4604 (10.7) | -0.53 (-0.99 to 0.04) | 0.09 | -0.54 (-1.2 to 0.15) | 0.13 |
| 2005 | 4340 (9.9) | -1.21 (-1.78 to -0.74) | 0.001 | -1.27 (-1.9 to -0.61) | 0.001 |
| All years | 22971 (10.8) | -0.28 (-0.39 to -0.18) | 0.001 | -0.29 (-0.44 to -0.14) | 0.001 |
Table 2 Pre 7 July suicide counts, rates and rate differences (regression coefficients), England and Wales: 2001–2005

| Year | Rate n (per 100 000 person-years) | Suicide rate (95% CI) | P | Rate difference (95% CI) | P |
|---|---|---|---|---|---|
| 2001a | 2477 (11.8) | (1) | (1) | ||
| 2002 | 2485 (11.8) | -0.05 (-0.71 to 0.52) | 0.86 | -0.04 (-0.99 to 0.91) | 0.91 |
| 2003 | 2564 (12.1) | 0.27 (-0.38 to 0.93) | 0.41 | 0.31 (-0.64 to 1.3) | 0.54 |
| 2004 | 2551 (11.1) | -0.07 (0.72 to 0.58) | 0.86 | -0.01 (-0.92 to 0.96) | 0.96 |
| 2005 | 2410 (11.1) | -0.82 (-1.47 to -0.017) | 0.013 | -0.77 (-1.8 to 0.01) | 0.057 |
| All years | 12 487 (11.6) | -0.17 (-0.031 to -0.02) | 0.025 | -0.15 (-0.37 to 0.05) | 0.092 |
Table 3 Post 7 July suicide counts, rates and rate differences (regression coefficients), England and Wales: 2001–2005

| Year | Rate n (per 100 000 person-years) | Suicide rate (95% CI) | P | Rate difference (95% CI) | P |
|---|---|---|---|---|---|
| 2001a | 2226 (10.6) | ||||
| 2002 | 2180 (10.3) | -0.21 (-0.86 to 0.44) | 0.53 | -0.21 (-1.1 to 0.7) | 0.65 |
| 2003 | 2095 (10) | -0.64 (-1.29 to 0.01) | 0.055 | -0.66 (-1.6 to 0.26) | 0.16 |
| 2004 | 2035 (9.6) | -1.02 (-1.67 to -0.19) | 0.018 | -0.92 (-1.9 to -0.13) | 0.025 |
| 2005 | 1930 (8.9) | -1.63 (-2.28 to -0.98) | 0.001 | -1.7 (-2.7 to -0.79) | 0.001 |
| All years | 10 466 (9.9) | -0.40 (-0.55 to -0.26) | 0.001 | -0.43 (-0.64 to -0.22) | 0.001 |
Figure 2 illustrates daily suicide rates in July 2005 compared with the July daily mean of suicide in 2001–2004. Two brief drops in daily suicide rates per 100 000 person-years are seen on 12 July 2005, 5 days after the first attack, and on 21 July, which coincided with the second wave of attacks. Rates then started to gradually increase to pre-attack levels. Such a decrease was not observed in the previous 4 years (Fig. 2). Figure 3 shows the Shewhart control chart for the rate difference for 2005 v. previous years and their lower and upper 99% control limits (both upper and lower control limits at P=0.01). The reductions in rate difference shown on 12 and 21 July were significant at P<0.05 but failed to reach the 99% lower control limit (P>0.01). We fitted Poisson regression models which included indicator variables for each day of July 2005. Our alternative hypotheses of these variables imply a reduction in the incidence of suicide. The models included terms for day of the week and its interactions with the daily indicator variables. The final model was obtained minimising Akaike's Information Criterion in a stepwise model selection procedure and included significant terms only for variables corresponding to 12 and 21 July (P<0.05). These differences imply a reduction of about 40% of the expected daily rate.
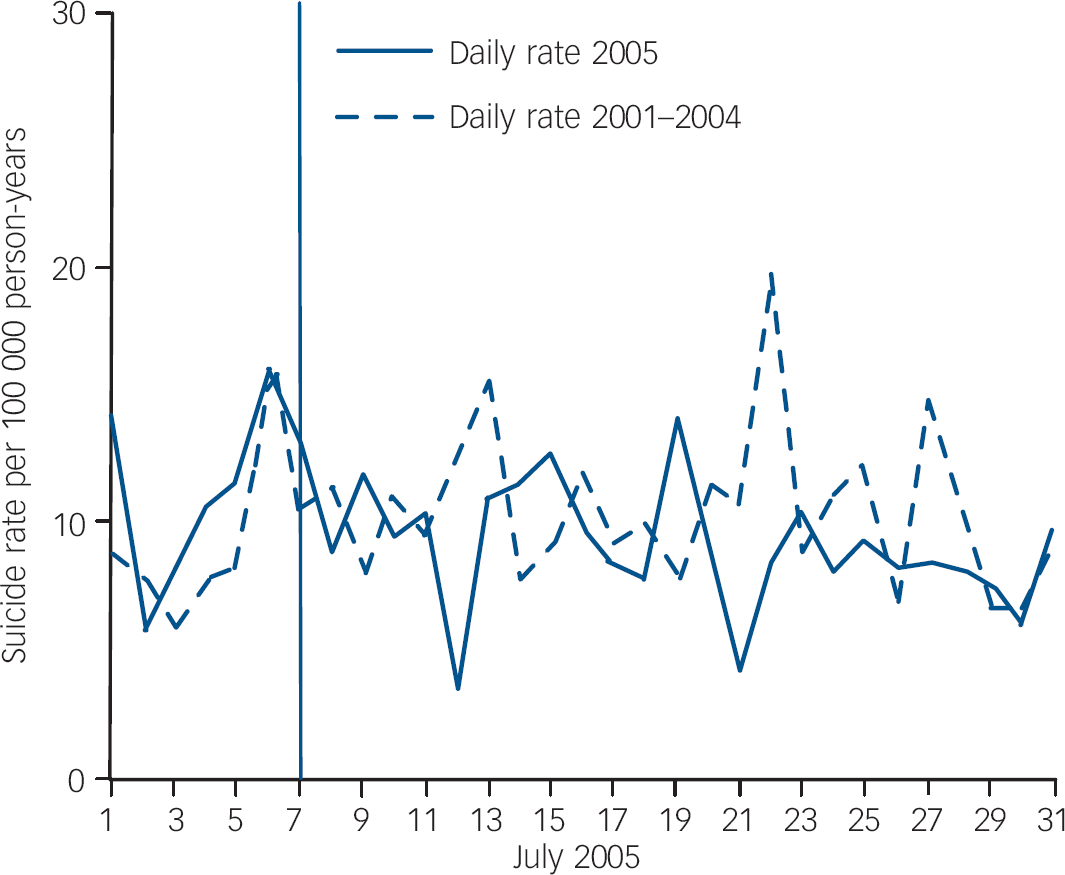
Fig. 2 Daily suicide rates in July 2005 compared with 2001–2004.
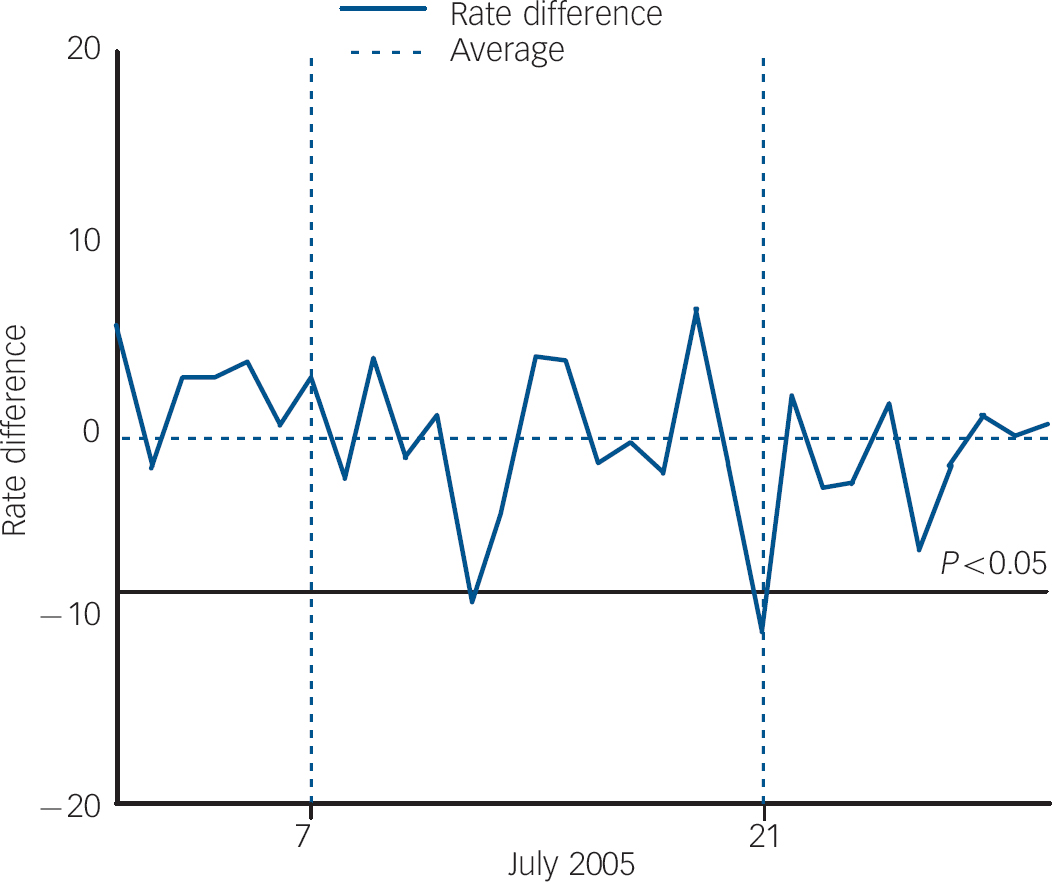
Fig. 3 Shewhart control chart showing rate difference: July 2005 v. July 2001–2004. Lower control limit=–12.8; upper control limit=11.4; average=–0.66.
To examine the longer-term effect of 7 July, we compared weekly suicide rates for 2005 with those for 2001–2004 in relation to the week of 7 July (Fig. 4). Figure 5 shows the Shewhart control chart of the weekly suicide rate difference for the 12 weeks before and 12 weeks after 7 July 2005. The reduction observed late in July and August did not reach the lower control limit (P>0.05), and corresponds to random variations in the suicide incidence rate. Interestingly, there was a similar reduction in June, before the attacks.

Fig. 4 Weekly suicide rates for 2005 compared with 2001–2004 and rate difference in England and Wales.

Fig. 5 Shewhart control chart showing weekly rate difference before and after 7 July 2005. Lower control limit=–4.66; upper control limit=2.69; average=–0.98.
In summary, the results confirm a small but significant reduction in suicide that was only evident on 2 days in July 2005 after the terrorist attacks. The reduction noted during the entire post 7 July period in 2005, though significant compared with the period before the attacks, was also observed in previous years and is therefore unlikely to have been directly related to the terrorist attacks.
Discussion
Interpretation of the findings
A small but significant reduction in daily suicide rates was observed a few days following the terrorist attack in London on 7 July 2005. A second reduction on 21 July was also observed, coinciding with the second wave of attacks. News about the attacks on 21 July, which did not result in any fatalities, was released just before 12.00 h, thus confirming that most of the reduction in the number of suicides occurred after the attacks. No similar pattern in suicide was seen in the previous 4 years. The reduction in suicide rates estimated at 40% of the expected daily rate was seen only on 2 days: 12 July, 5 days after the attacks, and 21 July, on the day of the second wave of attacks. The reduction in suicide after 7 July 2005 was similar but not greater than that reported in England and Wales after 11 September 2001. Reference Salib7 The study findings are contrary to our expectation and only weakly support Durkheim's theory Reference Durkheim14 that periods of national threat and major events create group integration within society and lower suicide rates through the impact on social cohesion. The extent of the impact on suicide by the terrorist attacks of 7 July may have been influenced by three main factors: the emotional reaction to the incidents, effect of media coverage and previous experience of terrorism.
Emotional reactions to terrorist attacks
The prime aim of simultaneous suicide–homicide acts of terrorism is to cause devastating physical damage, inflicting profound fear on an entire population rather than just on the victims of the actual attack, aided by the extensive, dramatic and spectacular media coverage as on 11 September. Reference Salib15 However, emotional reactions to terrorist incidents vary. Some people develop well-recognised psychiatric disorders such as depression or post-traumatic stress disorder, higher levels of general anxiety or stress-related symptoms. Others who may not report psychiatric symptoms could show considerable changes in their behaviour Reference Grieger, Fullerton, Ursano and Reeves16 or their feelings about the future. Reference Bleich, Gelkopf and Solomon17 Shortly after 11 September 2001, about 90% of the residents of New York City and Washington DC reported symptoms of stress, with 44% reporting substantial symptoms. Reference Schuster, Stein, Jaycox, Collins, Marshall and Elliott2 High levels of distress have also been seen among the population of Oklahoma City after the bombing of the Federal Building in 1995, Reference North, Nixon, Shariat, Mallonee, McMillen and Spitznagel18 in France after a wave of bombings in 1996, Reference Verger, Dab, Lamping, Loze, Deschaseaux-Voinet and Abenhaim19 and in the Israeli population as a consequence of the ongoing intifada. Reference Bleich, Gelkopf and Solomon17 The terrorist attacks in London had been expected and prior to 7 July 2005 attempts had been made by the British government to prepare the UK population for a possible major incident. This may have led to a relatively weaker emotional impact compared with the totally unexpected 11 September 2001 attacks in New York. Rubin et al Reference Rubin, Brewin, Greenberg, Simpson and Wessely4 reported that 31% of Londoners reported substantial distress after 7 July 2005: a much lower prevalence than that reported in the general adult US population after 11 September 2001. Reference Schuster, Stein, Jaycox, Collins, Marshall and Elliott2 Greater loss of life, dramatic imagery, and live television coverage of the New York attacks may explain this difference. Rubin et al Reference Rubin, Brewin, Greenberg, Simpson and Wessely4 also reported that 7 July 2005 attacks inflicted disproportionately high levels of distress among ‘non-White’ and Muslim Londoners. Whether these results partly reflect a response bias, with Muslim respondents attempting to maintain a distinction between themselves and the bombers for fear of recrimination or it may represent a differential response within different communities for unknown reasons is not clear. It would be very interesting to explore these findings further, but in relation to suicide.
Effect of media coverage
In addition to the acute emotional and behavioural changes brought about by suicide terrorist attacks, media reporting of deaths and disaster-related television viewing can cause severe distress and also influence the suicide rate. Reference Bollen and Phillips20,Reference Stack21 The assassination of President Kennedy in 1963, perceived as an immediate national threat, resulted in a reduction in the suicide rate in the USA. Reference Biller22 The televised national shock and public display of grief following the death of Princess Diana, Princess of Wales and after her funeral in 1997 was shown to have influenced the rate of suicidal behaviour and self-harm. Reference Hawton, Harriss, Appleby, Juszczak, Simkin and McDonnell23 The ‘imitative’ and ‘copycat’ effects on suicide Reference De Lange and Neeleman8,Reference Bollen and Phillips20,Reference Stack21,Reference Yip, Fu, Yang, Ip, Chan and Lee24 have been used to explain an increase in suicide rates following major televised events. Yip et al Reference Yip, Fu, Yang, Ip, Chan and Lee24 reported a significant increase in suicide in Hong Kong following the suicide of a famous pop singer, which resulted in extensive and dramatic media coverage. De Lange & Neeleman Reference De Lange and Neeleman8 found an increase in suicide and self-harm in The Netherlands in the weeks following the 11 September 2001 attacks in the USA. Suicide bombings might themselves be ‘copycat’ acts rather than part of organised terrorist plots. The television coverage of the 7 July 2005 events in the UK was not as graphic, pervasive and dramatic as those of 11 September 2001. Also, there were no live scenes of homicide and suicide as shown during the extensive coverage of the New York attacks. It is therefore possible to conclude that the impact of television coverage of the 7 July events was less traumatic than that of 11 September 2001.
Effect of previous experience of terrorism
The temporary reduction in suicide associated with 7 July is probably not dissimilar to that reported during major wars. Suicide rates declined during both World Wars of the last century, both in men and women, and in both participating and nonparticipating nations. Reference Lester25 Similar findings have also been reported in Israel following years of exposure to suicide terrorism. Reference Lester6 It is plausible to assume that previous experience of IRA terrorism in London and elsewhere in the UK from the late 1960s to the late 1990s may have significantly reduced short-term emotional responses among Londoners who had previously been exposed to terrorism. Similar adaptive responses have been described in the Israeli population exposed to repeated suicide bombings. Reference Shalev, Tauval, Frenkiel-Fishman, Hadar and Eth26 Previous experience of terrorism was found to reduce the likelihood of perceiving the world more negatively because any preconceptions of the world being benign or fair had already been tarnished by previous experience. Reference Rubin, Brewin, Greenberg, Simpson, Hughes and Wessely27 It is therefore possible that the protective effect of previous experience of terrorism in the UK against the development of substantial stress Reference Rubin, Brewin, Greenberg, Simpson and Wessely4 and its association with positive changes to perception of the self and of the world Reference Rubin, Brewin, Greenberg, Simpson, Hughes and Wessely27 may have limited the impact on suicide of the 7 July attacks compared with those of 11 September 2001. In summary, there are some possible explanations for the relatively reduced impact of the 7 July attacks on suicide in England and Wales:
-
(a) the British government's attempts to prepare the UK populations for a possible major incident that preceded the 7 July attacks;.
-
(b) the protective effect of having previous experience of terrorism in Britain and its association with positive changes to self-perception; Reference Rubin, Brewin, Greenberg, Simpson, Hughes and Wessely27
-
(c) the television coverage of 7 July 2005 was less graphic, and thus perhaps less traumatic than that of 11 September 2001.
-
(d) the diminishing shock value of repeated suicide terrorism as its psychological potency lessens through the process of normalisation. Reference Hafez28
Limitations of the study
This is an ecological study that supports the possibility that the observed brief reduction in the suicide rate after 7 July 2005 may reflect a psychological effect of the attacks on individuals. However, the analysis dealt with the effect of the 7 July 2005 attacks only, and it is possible that other events occurring around this time and various other confounders may also have played a role. The ecological design does not connect exposure and outcome, so there is no way of ascertaining the proportion of suicides following the 7 July attacks that were attributable to exposure to the psychological stressors that the attacks created. The study did not examine the effect of 7 July on non-fatal self-harm behaviour or suicide and self-harm in people with mental illness, or the effect of ethnic, religious and cultural differences on rates of suicide within the UK. In addition, suicide data from Scotland and Ireland were not available for inclusion in the analysis. At the time of writing, mortality data for 2006 were not available from which we might have assessed the effect of the first anniversary of 7 July. In view of the small numbers of suicides, it is possible that some of the study's negative findings may have been, at least partly, the result of statistical type II errors. One of the main problems associated with using routinely collected data is one of misclassification of data, no matter how reliable and complete.
Future research
It would be interesting to study the effect of 7 July on suicide rates in English-speaking countries with close historical, cultural and economic links with the UK such as the USA, Canada, Australia and New Zealand. The effect of ethnic, religious and cultural difference on suicide rates after 7 July within the UK, particularly within the Muslim population in view of reported findings by Rubin et al, Reference Rubin, Brewin, Greenberg, Simpson and Wessely4 should also be explored in future studies.
Acknowledgements
The authors are grateful to Mr Allan Baker from the Office for National Statistics for his kind support and to Bernia Hayes and Sarah Cron, Hollins Park Library, and Michael, Emma and Mark Salib for their help. We dedicate this paper to the memory of Maureen Balmer. Research at the Institute of Child Health, University College London, and Great Ormond Street Hospital for Children NHS Trust benefits from R&D funding received from the NHS Executive.


eLetters
No eLetters have been published for this article.