


The importance of equity in mental health services has recently been re-emphasised (Reference AchesonAcheson, 1998). Painstaking efforts are made to ensure that National Health Service (NHS) resources are allocated equitably between health authorities, using a formula which takes account of the need for mental health services (Reference Carr-Hill, Hardman and MartinCarr-Hill et al, 1994a ; Reference Smith, Sheldon and MartinSmith et al, 1996), although the final allocation is not divided according to different clinical areas. Although the effectiveness of the allocation process in achieving equity has been criticised (Reference GloverGlover, 1996; Reference Jarman and BajekalJarman & Bajekal 1996; Reference LelliotLelliott, 1996), the question of how resources are spent, which is at the discretion of each authority, has been insufficiently considered. However, it is likely to be the more important source of inequity (Reference SheldonSheldon, 1997).
National comparisons of health authority expenditure on mental health care have not previously been published. In this paper we compare expenditure and allocation for all the health authorities in England. We test the hypothesis that the way in which resources are spent contributes to inequity, to the disadvantage of those areas with the greatest needs.
METHOD
General allocation for purchasing mental health services
In 1997-1998, health authorities were allocated £24 367 million to purchase hospital and community health services (HCHS), of which £21 816 million was given as a general recurrent allocation based on a weighted capitation formula (Fig. 1). The total weighted capitation of each area, on which the general allocation is based, is arrived at by weighting the mid-year (1997) crude population for age, for local costs, and for the need for four types of health care: general and acute, psychiatric, community psychiatric, and community, each expressed as an index (NHS Executive, 1997). Using the approach described by Glover (Reference Glover1999), the proportion of the total allocated to the purchase of mental health services was assumed to be the proportion of the weighted capitation derived from the use of the York Psychiatric (Reference Carr-Hill, Hardman and MartinCarr-Hill et al, 1994a ) and Community Psychiatric (Reference Buckingham, Bebbington and CampbellBuckingham et al, 1996) Need indices. In 1997-1998, the decision was taken to weight 11.08% (the ‘programme weight’) of the age- and cost-weighted population of each area using these two indices, applied in the ratio 88.06:11.94 (NHS Executive, 1997).

Fig. 1 Resource allocation and expenditure in the National Health Service (NHS) (hospital and community health services) 1997-1998 (£). (Figures in normal or bold typeface are derived from central sources (NHS Executive, 1996, and NHS Common Information Core); figures in italics are estimated as described in the text.)
Special allocations for purchasing mental health services
In addition to the general allocation, health authorities receive other sums, special allocations, intended for the purchase of mental health services (Fig. 1). The largest of these is the ‘old long stay’ (OLS) allocation, to cover the continuing care costs of individual patients with mental illness who were in hospital prior to 1971, and patients with learning disabilities who were in hospital prior to 1970. The total OLS allocation figures for each health authority in 1997-1998 were available from the NHS Executive (1996), but the proportions of the total allocated to patients with mental illness were not available centrally. Regional offices provided details of the proportion of the total OLS allocated to 21 authorities for patients with mental illness in 1997-1998. For a further 52 authorities, regional offices provided these details for 1996, and for the remaining 27 authorities this proportion was provided for 1999. The 1996 or 1999 proportions were combined with the total OLS allocation for 1997-1998 to estimate the total amount of OLS allocated to each authority for patients with mental illness in 1997-1998.
A smaller special allocation, ‘joint finance’, has an identifiable ‘mental health target’ element based on the community psychiatric index, and this was calculated from published data (NHS Executive, 1996) using a method similar to that used for the general allocation. Two other special allocations are available to purchase psychiatric care: the drug misuse allocation and the mental health challenge fund. The figure for the former is available from published data (NHS Executive, 1996) and that for the latter was supplied by the NHS Executive.
Mental health expenditure and service activity
The Department of Health collects data annually (the Common Information Core, CIC) on the clinical activities which health authorities contract to purchase from health trusts, and the associated expenditure. Total mental health expenditure for 1997-1998 was derived from the expenditure on five types of activity: in-patient, out-patient, day care, residential, and community care for mental illness. The total expenditure on these activities formed 12.345% of the total expenditure on all hospital and community health services reported in the CIC. Other types of activity recorded in the CIC were not costed, but were used in this study as possible explanatory variables to model the relationship between expenditure and allocation. These variables were: the total number of patients under the care of the service (in the fourth quarter of 1997-1998) and the number of occupied bed-days purchased (in the public and private sectors) for mentally disordered offenders, each expressed per capita of the population served. In addition, two measures derived from the CIC were used as crude proxies for the extent of development of community services: the number of community psychiatric nurse (CPN) contacts per capita, and the fraction of total expenditure which was spent on in-patient beds.
Comparing allocation and expenditure
The absolute levels of allocation and expenditure, derived as described above, are not directly comparable, because the programme weight of 11.08% used in the calculation of the mental health general allocation in 1997-1998 was based on the proportion of total expenditure on mental health in 1992-1993 and 1994-1995, the most recent data available at the time. Changes in this proportion over the intervening years need to be accounted for before attempting comparisons for 1997-1998, and we therefore reworked the calculation using a nominal programme weight of 12.345%, the actual proportion of total expenditure on mental health in 1997-1998.
The estimated total allocation to mental health for each health authority was calculated by adding all the mental health special allocations to the mental health general allocation. Using a nominal programme weight as described has the effect of ensuring that our estimate of the national total allocation is approximately equal to the national total spend (Table 1), and therefore for an authority which is spending the amount on mental health services which is implied by the formula, expenditure and allocation should also be approximately equal.
Table 1 Allocation and expenditure on mental health services by 100 health authorities in England, 1997-1998 (£000/£ per capita total population)

| Health authority or region | Allocation (£000) | Expenditure (£000) | Per capita allocation (£) | Per capita expenditure (£) | Ratio expenditure:allocation | Expenditure, excess (+) or deficit (-) (£000) | Per capita expenditure, excess (+) or deficit (-) (£) |
|---|---|---|---|---|---|---|---|
| Northern | 388 592 | 354 725 | 61.78 | 57.48 | 0.94 | -33 867 | -4.30 |
| Bradford | 32 012 | 25 024 | 65.72 | 51.37 | 0.78 | -6988 | -14.35 |
| Calderdale and Kirklees | 37 798 | 26 869 | 64.68 | 45.97 | 0.71 | -10 929 | -18.70 |
| Durham | 37 470 | 39 095 | 61.53 | 64.20 | 1.04 | 1625 | 2.67 |
| East Riding | 29 975 | 25 004 | 51.54 | 42.99 | 0.83 | -4971 | -8.55 |
| Gateshead and South Tyneside | 25 797 | 31 379 | 71.97 | 87.54 | 1.22 | 5582 | 15.57 |
| Leeds | 45 840 | 38 179 | 63.14 | 52.59 | 0.83 | -7661 | -10.55 |
| Newcastle and North Tyneside | 35 933 | 29 658 | 75.63 | 62.43 | 0.83 | -6275 | -13.21 |
| North Cumbria | 16 372 | 17 784 | 51.29 | 55.71 | 1.09 | 1412 | 4.42 |
| North Yorkshire | 34 068 | 38 624 | 46.00 | 52.15 | 1.13 | 4556 | 6.15 |
| Northumberland | 17 458 | 19 593 | 56.40 | 63.29 | 1.12 | 2135 | 6.90 |
| Sunderland | 19 996 | 21 098 | 67.52 | 71.24 | 1.06 | 1102 | 3.72 |
| Tees | 35 422 | 26 326 | 63.54 | 47.22 | 0.74 | -9096 | -16.32 |
| Wakefield | 20 450 | 16 092 | 64.19 | 50.51 | 0.79 | -4358 | -13.68 |
| Trent | 277 140 | 265 045 | 53.84 | 49.99 | 0.93 | -12 095 | -3.84 |
| Barnsley | 12 525 | 12 046 | 55.06 | 52.95 | 0.96 | -479 | -2.11 |
| Doncaster | 16 504 | 14 366 | 56.02 | 48.76 | 0.87 | -2138 | -7.26 |
| Leicestershire | 48 338 | 53 239 | 51.75 | 57.00 | 1.10 | 4901 | 5.25 |
| Lincolnshire | 29 384 | 26 228 | 47.26 | 42.18 | 0.89 | -3156 | -5.08 |
| North Derbyshire | 17 106 | 17 760 | 45.55 | 47.29 | 1.04 | 654 | 1.74 |
| North Nottinghamshire | 19 207 | 16 120 | 49.33 | 41.40 | 0.84 | -3087 | -7.93 |
| Nottingham | 37 649 | 39 802 | 57.98 | 61.30 | 1.06 | 2153 | 3.32 |
| Rotherham | 14 191 | 12 150 | 55.35 | 47.39 | 0.86 | -2041 | -7.96 |
| Sheffield | 36 825 | 33 334 | 70.02 | 63.38 | 0.91 | -3491 | -6.64 |
| South Derbyshire | 29 272 | 28 083 | 52.36 | 50.23 | 0.96 | -1189 | -2.13 |
| South Humber | 16 139 | 11 917 | 51.50 | 38.03 | 0.74 | -4222 | -13.47 |
| Anglia and Oxford | 239 726 | 278 327 | 44.44 | 51.04 | 1.16 | 38 601 | 6.60 |
| Bedfordshire | 26 990 | 23 804 | 48.88 | 43.11 | 0.88 | -3186 | -5.77 |
| Berkshire | 34 236 | 42 346 | 43.11 | 53.33 | 1.24 | 8110 | 10.21 |
| Buckinghamshire | 28 736 | 31 893 | 42.22 | 46.85 | 1.11 | 3157 | 4.64 |
| Cambridge and Huntingdon | 17 583 | 22 773 | 38.51 | 49.87 | 1.30 | 5190 | 11.37 |
| East Norfolk | 29 338 | 36 086 | 47.01 | 57.83 | 1.23 | 6748 | 10.81 |
| North West Anglia | 20 044 | 18 519 | 48.58 | 44.89 | 0.92 | -1525 | -3.70 |
| Northamptonshire | 28 647 | 32 256 | 46.96 | 52.87 | 1.13 | 3609 | 5.92 |
| Oxfordshire | 24 083 | 32 219 | 39.57 | 52.94 | 1.34 | 8136 | 13.37 |
| Suffolk | 30 067 | 38 431 | 45.11 | 57.66 | 1.28 | 8364 | 12.55 |
| North Thames | 502 824 | 533 709 | 75.07 | 79.78 | 1.05 | 30 885 | 4.70 |
| Barking and Havering | 23 562 | 22 261 | 61.29 | 57.91 | 0.94 | -1301 | -3.39 |
| Barnet | 22 081 | 22 546 | 70.02 | 71.49 | 1.02 | 465 | 1.48 |
| Brent and Harrow | 38 405 | 33 932 | 83.81 | 74.05 | 0.88 | -4473 | -9.76 |
| Camden and Islington | 46 403 | 53 769 | 126.42 | 146.48 | 1.16 | 7366 | 20.07 |
| East and North Hertfordshire | 22 133 | 25 066 | 44.71 | 50.63 | 1.13 | 2933 | 5.92 |
| Ealing, Hammersmith and Hounslow | 56 202 | 55 821 | 85.56 | 84.97 | 0.99 | -381 | -0.58 |
| East London and City | 62 859 | 66 071 | 102.52 | 107.75 | 1.05 | 3212 | 5.24 |
| Enfield and Haringey | 40 295 | 40 151 | 84.67 | 84.37 | 1.00 | -144 | -0.30 |
| Hillingdon | 14 618 | 12 619 | 59.09 | 51.01 | 0.86 | -1999 | -8.08 |
| Kensington, Chelsea and Westminster | 38 154 | 52 611 | 107.26 | 147.91 | 1.38 | 14 457 | 40.64 |
| North Essex | 39 130 | 48 318 | 44.20 | 54.58 | 1.23 | 9188 | 10.38 |
| Redbridge and Waltham Forest | 34 623 | 37 575 | 76.51 | 83.04 | 1.09 | 2952 | 6.52 |
| South Essex | 36 255 | 35 591 | 51.48 | 50.54 | 0.98 | -664 | -0.94 |
| West Hertfordshire | 28 103 | 27 378 | 53.50 | 52.12 | 0.97 | -725 | -1.38 |
| South Thames | 438 778 | 482 729 | 64.83 | 70.39 | 1.09 | 43 951 | 5.56 |
| Bexley and Greenwich | 30 437 | 31 916 | 70.08 | 73.48 | 1.05 | 1479 | 3.40 |
| Bromley | 21 109 | 13 297 | 71.91 | 45.30 | 0.63 | -7812 | -26.61 |
| Croydon | 20 297 | 19 202 | 60.90 | 57.61 | 0.95 | -1095 | -3.28 |
| East Kent | 33 395 | 30 344 | 56.15 | 51.02 | 0.91 | -3051 | -5.13 |
| East Surrey | 26 161 | 33 316 | 63.46 | 80.82 | 1.27 | 7155 | 17.36 |
| East Sussex | 46 028 | 44 641 | 62.61 | 60.72 | 0.97 | -1387 | -1.89 |
| Kingston and Richmond | 19 831 | 27 837 | 62.09 | 87.16 | 1.40 | 8006 | 25.07 |
| Lambeth, Southwark and Lewisham | 79 033 | 97 389 | 106.86 | 131.68 | 1.23 | 18 356 | 24.82 |
| Merton, Sutton and Wandsworth | 48 929 | 49 353 | 78.29 | 78.97 | 1.01 | 424 | 0.68 |
| West Kent | 45 248 | 46 062 | 46.80 | 47.64 | 1.02 | 814 | 0.84 |
| West Surrey | 29 231 | 43 124 | 45.86 | 67.65 | 1.48 | 13 893 | 21.79 |
| West Sussex | 39 080 | 46 248 | 52.97 | 62.68 | 1.18 | 7168 | 9.71 |
| South West | 322 827 | 354 199 | 49.12 | 53.92 | 1.10 | 31 372 | 4.80 |
| Avon | 49 926 | 51 616 | 50.50 | 52.21 | 1.03 | 1690 | 1.71 |
| Cornwall and Isles of Scilly | 24 085 | 26 043 | 49.11 | 53.10 | 1.08 | 1958 | 3.99 |
| Dorset | 35 913 | 32 896 | 52.07 | 47.70 | 0.92 | -3017 | -4.37 |
| Gloucestershire | 26 549 | 25 352 | 47.44 | 45.31 | 0.95 | -1197 | -2.14 |
| Isle of Wight | 7507 | 762 | 59.78 | 60.70 | 1.02 | 115 | 0.92 |
| North and East Devon | 23 481 | 25 701 | 49.35 | 54.02 | 1.09 | 2220 | 4.67 |
| North and Mid Hampshire | 22 502 | 28 583 | 41.02 | 52.11 | 1.27 | 6081 | 11.09 |
| Portsmouth and SE Hampshire | 27 750 | 31 951 | 51.58 | 59.39 | 1.15 | 4201 | 7.81 |
| Somerset | 21 526 | 24 307 | 44.09 | 49.79 | 1.13 | 2781 | 5.70 |
| South and West Devon | 31 338 | 39 477 | 52.72 | 66.41 | 1.26 | 8139 | 13.69 |
| Southampton and SW Hampshire | 26 088 | 29 029 | 48.23 | 53.67 | 1.11 | 2941 | 5.44 |
| Wiltshire | 26 162 | 31 622 | 43.52 | 52.60 | 1.21 | 5460 | 9.08 |
| West Midlands | 299 290 | 276 495 | 54.96 | 49.87 | 0.93 | -22 795 | -5.09 |
| Birmingham | 75 238 | 68 070 | 74.04 | 66.99 | 0.90 | -7168 | -7.05 |
| Coventry | 20 260 | 17 051 | 67.27 | 56.62 | 0.84 | -3209 | -10.66 |
| Dudley | 15 446 | 15 135 | 49.15 | 48.16 | 0.98 | -311 | -0.99 |
| Herefordshire | 7199 | 7215 | 43.24 | 43.34 | 1.00 | 16 | 0.10 |
| North Staffordshire | 27 496 | 28 122 | 57.83 | 59.15 | 1.02 | 626 | 1.32 |
| Sandwell | 20 367 | 15 477 | 69.49 | 52.81 | 0.76 | -4890 | -16.68 |
| Shropshire | 19 187 | 18 454 | 44.97 | 43.25 | 0.96 | -733 | -1.72 |
| Solihull | 9229 | 9884 | 45.35 | 48.58 | 1.07 | 655 | 3.22 |
| South Staffordshire | 24 420 | 26 527 | 41.55 | 45.13 | 1.09 | 2107 | 3.58 |
| Walsall | 15 614 | 12 401 | 59.44 | 47.21 | 0.79 | -3213 | -12.23 |
| Warwickshire | 24 489 | 24 039 | 48.75 | 47.85 | 0.98 | -450 | -0.90 |
| Wolverhampton | 16 940 | 11 387 | 69.83 | 46.94 | 0.67 | -5553 | -22.89 |
| Worcestershire | 23 405 | 22 733 | 43.57 | 42.32 | 0.97 | -672 | -1.25 |
| North West | 441 516 | 384 874 | 66.04 | 56.62 | 0.87 | -56 642 | -9.42 |
| Bury and Rochdale | 25 552 | 16 277 | 65.02 | 41.42 | 0.64 | -9275 | -23.60 |
| East Lancashire | 37 116 | 27 759 | 72.45 | 54.18 | 0.75 | -9357 | -18.26 |
| Liverpool | 39 110 | 34 637 | 83.60 | 74.04 | 0.89 | -4473 | -9.56 |
| Manchester | 45 148 | 37 023 | 104.78 | 85.92 | 0.82 | -8125 | -18.86 |
| Morecambe Bay | 18 903 | 24 883 | 60.75 | 79.97 | 1.32 | 5980 | 19.22 |
| North Cheshire | 18 630 | 23 128 | 59.72 | 74.14 | 1.24 | 4498 | 14.42 |
| North West Lancashire | 32 255 | 32 244 | 68.62 | 68.60 | 1.00 | -11 | -0.02 |
| Salford and Trafford | 32 992 | 28 054 | 73.68 | 62.65 | 0.85 | -4938 | -11.03 |
| Sefton | 18 865 | 11 550 | 64.94 | 39.76 | 0.61 | -7314 | -25.18 |
| South Cheshire | 32 701 | 45 647 | 48.51 | 67.71 | 1.40 | 12 946 | 19.20 |
| South Lancashire | 15 345 | 8888 | 49.29 | 28.55 | 0.58 | -6457 | -02.74 |
| St Helens and Knowsley | 20 325 | 16 925 | 61.03 | 50.82 | 0.83 | -3400 | -10.21 |
| Stockport | 14 954 | 12 040 | 51.41 | 41.39 | 0.81 | -2914 | -10.02 |
| West Pennine | 31 840 | 23 279 | 66.88 | 48.90 | 0.73 | -8561 | -17.98 |
| Wigan and Bolton | 37 470 | 31 327 | 64.66 | 54.06 | 0.84 | -6143 | -10.60 |
| Wirral | 20 310 | 11 213 | 61.28 | 33.83 | 0.55 | -9097 | -27.45 |
| England (total) | 2 910 691 | 2 930 103 | 59.19 | 59.84 | 1.01 | 19 412 | 0.39 |
Comparisons between expenditure and allocation were made using both the absolute excess of expenditure over allocation, and the ratio of mental health expenditure to allocation in each health authority.
Measure of deprivation
We used the York Psychiatric Need Index, the main index of psychiatric need included within the allocation formula itself (Reference Carr-Hill, Hardman and MartinCarr-Hill et al, 1994a ), as a proxy for deprivation.
Statistical analysis
All data were analysed using the STATA software package (STATA Corporation, 1997). The ratio of expenditure to allocation was used as the dependent variable in a linear regression model, using backward stepwise selection to identify a simplified model (the criteria being P>0.05 for removal from and P<0.1 for addition to the model). The Psychiatric Need Index and the activity variables described above were entered into the model as explanatory variables.
RESULTS
Allocation and expenditure
Figure 1 shows the total allocations made to health authorities for hospital and community health services in 1997-1998, the reported expenditure by them, and our estimates of the total allocation for mental health services (in italics). It can be seen that the special allocations to mental health form only a small proportion (7%) of the total allocation. The largest part of this, the OLS allocation, varies widely (from zero in six health authorities to £6.8 million in East Surrey) and is unrelated to the Psychiatric Need Index (r=0.13, P=0.2), as might be expected given the historical origins of its distribution. Table 1 shows the estimated mental health allocation and the expenditure, the ratio between them, and the excess of expenditure over allocation for each of the 100 health authorities in England.
The relationship between expenditure and allocation
As can be seen from Table 1, the ratio of expenditure to allocation varies considerably, ranging from 0.55 to 1.48. The distribution is approximately normal, with a standard deviation of 0.20. This alone suggests that if the allocation process is equitable, then expenditure cannot be. The hypothesis that the inequity introduced by variable expenditure acts to the disadvantage of areas with greater need can be tested by regressing the expenditure: allocation ratio on the Psychiatric Need Index. This shows a significant negative relationship, areas with greater levels of need tending to spend less than their allocation on mental health services (coefficient ‒2.55, 95% CI ‒4.1 to 1.0, P=0.001). However, the relationship is not a strong one, only 9.2% of the variance in the ratio being explained by deprivation. Figure 2 illustrates this with a scatter plot of the ratio plotted against need, with the regression line described above shown on the graph. A small number of more deprived health authorities are identified. It can be seen that the four inner-London authorities appear as outliers, with high levels of need, but high expenditure relative to allocation. By contrast, Manchester and Liverpool, which also have high levels of need, spend less than their allocation, consistent with the relationship shown by the regression line. If the outlying position of the inner-London authorities is taken into account by including a dummy variable for inner-London status in a linear regression model, a considerably stronger negative relationship between the ratio of expenditure to allocation and need is revealed (model 1, Table 2), and the model explains nearly 30% of the variation in the ratio. That is, the tendency of areas of greater need to spend less in relation to their allocation is both significant and of moderate strength outside inner London, although there is still considerable unexplained variation.
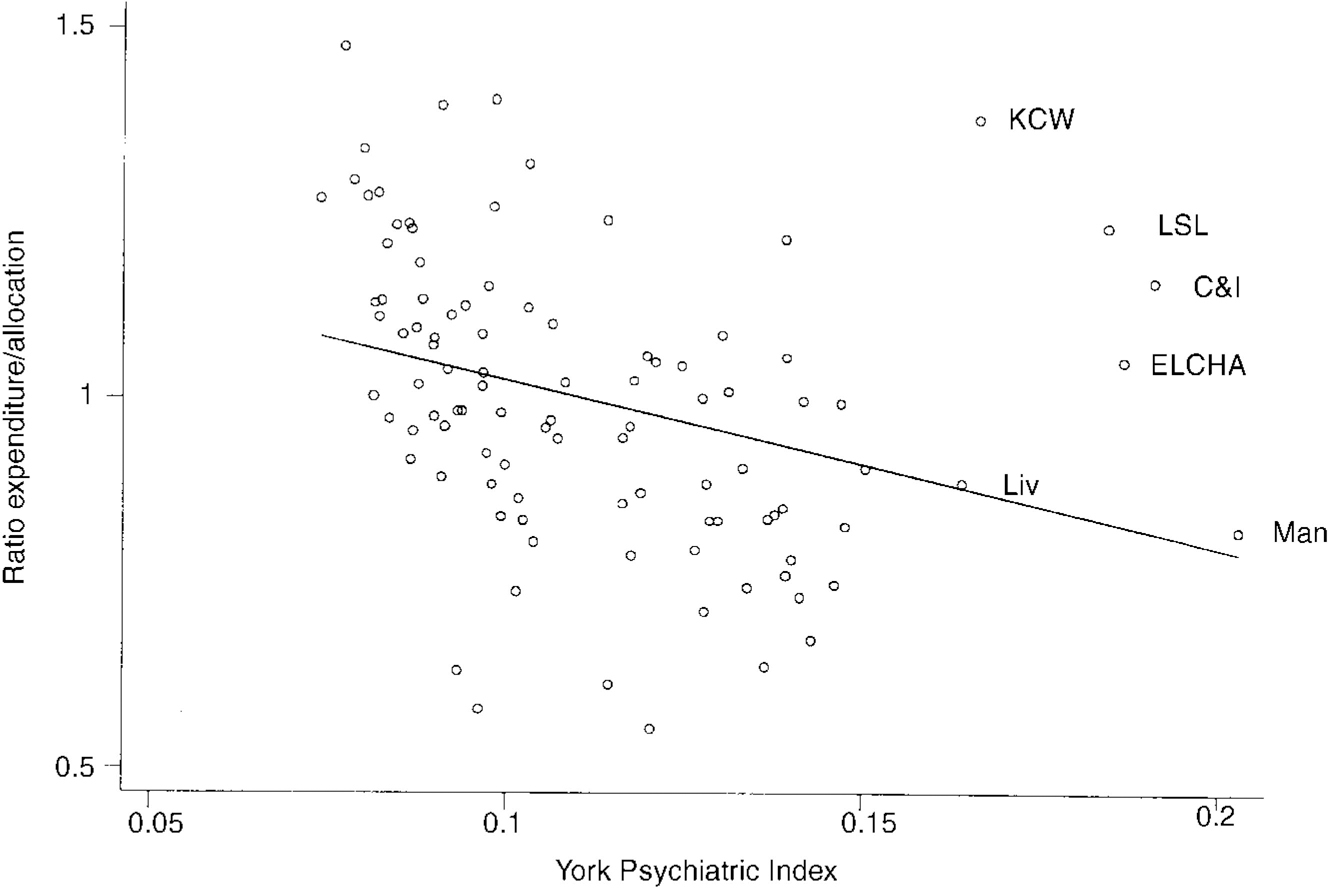
Fig. 2 Expenditure allocation ratio and need for 100 health authorities in England, 1997-1998. (KCW, Kensington, Chelsea and Westminster; ELCHA, East London, City and Hackney; LSL, Lambeth, Southwark and Lewisham; C&I, Camden and Islington; Man, Manchester; Liv, Liverpool.)
Table 2 Regression analyses of expenditure:allocation ratio in health authorities in England on York Psychiatric Need Index, inner-London status and service activity purchased
| Variable | Coefficient | 95% CI | P |
|---|---|---|---|
| Model 1 | |||
| Psychiatric Need Index | -4.26 | -5.66 to ‒2.84 | <0.001 |
| Inner-London health authority | 0.53 | 0.33 to 0.72 | <0.001 |
| (For model: F(2,97)=2.13, P<0.0001, adjusted R 2=0.2906) | |||
| Model 2 | |||
| Psychiatric Need Index | -4.73 | -6.37 to ‒3.08 | <0.001 |
| Per capita secure occupied bed-days | 6.94 | 3.89 to 9.99 | <0.001 |
| (For model: F(2,97)=16.8, P<0.001, adjusted R 2=0.2421) | |||
Our second hypothesis is that the relationship between expenditure and allocation is explained by the levels of service activity purchased. A number of measures of activity available in the CIC can be hypothesised to explain higher levels of expenditure in relation to allocation. It has been shown previously that the number of patients cared for by specialist mental health services is variable, even when need is taken into account (Reference Bindman, Beck and GloverBindman et al, 1999), and it might be that services which spend more are attempting to serve a greater proportion of their local population. The numbers of mentally disordered offenders for whom care is purchased is known to be particularly high in London (Reference McCrone, Leese and GloverMcCrone et al, 1997), suggesting this is a possible cause of excess expenditure over allocation. Health authorities purchasing services which have less well-developed community care, spending a high proportion of their resources on in-patient beds or having low levels of CPN activity, might also be expected to spend more in relation to allocation. Entering the activity variables into a stepwise linear regression model together with the York Psychiatric Index (model 2 in Table 2), only the need index and the per capita number of bed-days purchased for mentally disordered offenders are retained in the model, which explains 24% of the variance. However, the effect of these bed-days in the model is simply to explain part of the high level of expenditure in London. This can be demonstrated by reintroducing the dummy variable for inner London into the model. This causes beddays for mentally disordered offenders to be excluded, as having no independent explanatory power for health authorities outside London, and the resulting model is the same as model 1 (Table 2).
Regional variations in the ratio of expenditure to allocation
Figure 3 illustrates the geographical variation in the ratio of expenditure to allocation. It suggests that although there is some variability in the ratio, even between neighbouring health authorities, there is also a degree of regional clustering. This is confirmed by the regional average (Table 1), showing an average underspend in Northern, Trent, West Midlands and North West regions, and corresponding overspends in the remaining regions.

Fig. 3 Excess/deficit in expenditure relative to allocation for 100 health authorities in England. Percentage over-/underspend (numbers of health authorities); [UNK] + 10 to +50 (18); [UNK] +2.5 to +10 (22); [UNK] ‒2.5 to +2.5 (21); [UNK] ‒10 to ‒2.5 (16); ▪ ‒50 to ‒10 (23).
DISCUSSION
Limitations of the study
This study concerns only geographically equitable resource allocation and expenditure at the health authority level. We do not address the question of the overall adequacy of resources, nor can it be assumed that equitable expenditure would guarantee that the ultimate goal - equal access to services for individuals with equal needs - would be achieved. The study takes as its starting point the assumption that the York Psychiatric Index accurately reflects the need for psychiatric services in each area. Although this assumption is to some extent justified by the use of the index in the allocation process, its limitations have been acknowledged by the York team which devised it (Carr-Hill et al, Reference Carr-Hill, Hardman and Martin1994a ,Reference Carr-Hill, Sheldon and Smith b ; Smith et al, Reference Smith, Sheldon and Carr-Hill1994,Reference Smith, Sheldon and Martin1996) and it has also been criticised by other commentators on the grounds that it is based on inappropriate measures of the utilisation and the supply of mental health care (Reference GloverGlover, 1996; Reference Jarman and BajekalJarman & Bajekal, 1996; Reference LelliotLelliott, 1996). We also assume that it is appropriate to disaggregate the mental health allocation from the total, and that the result is the level of resources needed to achieve equity. The possibility of doing so appears to have been recognised by the York team, who wrote that “use of the index implies a considerable redistribution of resources towards deprived areas… it is to be hoped that the psychiatric index we have developed will be the first step towards a more equitable distribution of resources” (Reference Smith, Sheldon and MartinSmith et al, 1996). A further limitation of the study is the failure to take into account the level of social services spending on community mental health care in each area, which may exacerbate or alleviate any apparent deficiencies in health spending; however, this cannot easily be considered because directly comparable data are not available (Reference Judge and MaysJudge & Mays, 1994).
Underspending in areas of greater need
The results of this study show that at the level of health authorities, the relation of expenditure on mental health to the psychiatric allocation varies, but declines significantly as the level of socio-economic deprivation increases, in areas outside inner London. Subject to the assumptions described above, this does appear to suggest that expenditure is inequitable, and that the effect of this inequity is to cause further disadvantage to areas with high levels of socio-economic deprivation. This probably arises because the York indices, which identify psychiatric and general medical needs separately, were only introduced into the allocation process from 1995-1996 onwards. As a consequence of the more redistributive nature of the new psychiatric index, compared with the general index, the allocation based on it contains the assumption that a greater proportion of the total resources for health care should be spent on mental health in more deprived areas, a proportion which, using the method described by Glover (Reference Glover1999), doubles from 8 to 16% from the least to the most deprived health authorities. However, this assumption, which could not have been made prior to the introduction of the York formula, has never been drawn to the attention of health authorities. They may fail to spend resources in line with the York formula simply because it has never been suggested that they should do so. Even if the implications of the formula have become apparent, they might be reluctant to divert resources to psychiatry from high-profile acute services (which may also be under pressure to a degree not accounted for in the formula).
Mental health expenditure in London
The high level of expenditure on mental health in London has been noted previously (Reference Chisholm, Lowin, Knapp, Johnson, Ramsay and ThornicroftChisholm et al, 1997), and has been attributed to high levels of expenditure on mentally disordered offenders (Reference McCrone, Leese and GloverMcCrone et al, 1997) and to levels of need greater than those accounted for in the York index (Reference Ramsay, Thornicroft, Johnson, Johnson, Ramsay and ThornicroftRamsay et al, 1997), although this has been debated (Reference KisleyKisely, 1998). This study suggests that the four inner-London health authorities spend more on mental health than they are allocated on the basis of the York index, and that this can only partially be explained by high per capita rates of mentally disordered offender in-patients. Their excess expenditure is more striking given that other inner-city areas tend to show a relative underspend. Though this tends to support the view that these authorities are responding to levels of need unrecognised in the allocation process, this study cannot exclude other explanations of the high expenditure.
Policy implications
In 1997, Sheldon wrote: “formula fever has distracted attention from the now more important issue of how the allocated resources are spent. Health authorities… should focus their attention on whether current spending patterns reinforce socially produced inequalities and, if so, doing something about this at a local level”. This preliminary attempt at an analysis of the kind advocated by Sheldon suggests that the implications of the York formula are not being translated into practice, and that current mental health spending is failing to rectify past inequities.
The first step towards addressing this would be to make explicit to each health authority the implications of the allocation formula for the resourcing of particular clinical areas (Reference GloverGlover, 1999). Where there are substantial shortfalls of mental health expenditure in relation to allocation, local health authorities should be called upon to justify them, particularly where we have found this to be a systematic effect: in deprived areas outside London. This might prompt a gradual shift in expenditure, to approach the allocation more closely over time. However, it may become apparent that there are good local justifications for current spending patterns, and if so, those would need to be considered in any future re-examination of the allocation formula.
Clinical Implications and Limitations
CLINICAL IMPLICATIONS
-
▪ Expenditure on mental health is not distributed equitably between health authorities.
-
▪ Health authorities in areas of greatest need are more likely to be spending less on mental health services than they are allocated.
-
▪ Health authorities in London spend more on mental health than they are allocated; the high number of beds purchased for mentally disordered offenders explains only part of this excess expenditure.
LIMITATIONS
-
▪ The mental health allocations we present are estimates derived for the purposes of comparison between health authorities; they are not absolute sums which should be spent.
-
▪ We assume the accuracy of routine data, but have no independent means of validating it.
-
▪ Many factors other than resources determine the effectiveness of services, and equitable expenditure would not be sufficient to ensure equitable services.
ACKNOWLEDGEMENTS
We are grateful to the Regional Office staff who provided OLS data, and to Colin Sanderson for his comments on the manuscript.


eLetters
No eLetters have been published for this article.