Psychological Distress and Somatic Distress
Psychological distress (PSYCH) and somatic distress (SOMA) commonly co-occur (Clarke et al., Reference Clarke, Piterman, Byrne and Austin2008; de Waal et al., Reference de Waal, Arnold, Eekhof and van Hemert2004; Lee et al., Reference Lee, Leung, Kwok and Ng2015; Shidhaye et al., Reference Shidhaye, Mendenhall, Sumathipala, Sumathipala and Patel2013). PSYCH can be described as a negative feeling that affects a person's life. This discomfort is usually manifested as anxiety, frustration, hopelessness, sadness, or worthlessness. SOMA, also known as somatoform disorder or somatization syndrome, can involve various bodily discomforts such as prolonged fatigue, pain, tiredness, or sleep disturbance (Hanel et al., Reference Hanel, Henningsen, Herzog, Sauer, Schaefert, Szecsenyi and Löwe2009; Hiller et al., Reference Hiller, Rief and Brähler2006). The prevalence of PSYCH and SOMA tends to vary across studies, likely due to the heterogeneous definition of the distress and the group from which the distress is measured. An analysis of five Australian National Health Surveys found that a high level of PSYCH affected 11.1–13.4% of the population aged 18–65. This prevalence remained fairly stable from 2001 to 2014 (Harvey et al., Reference Harvey, Deady, Wang, Mykletun, Butterworth, Christensen and Mitchell2017). In primary care settings, approximately 9.5% of Australian general practice attenders had a very high level (K10 ≥ 30) of PSYCH (Clarke et al., Reference Clarke, Piterman, Byrne and Austin2008). Somatization syndromes based on the Patient Health Questionnaire, on the other hand, occurred in 9.3% of the German general population (Kocalevent et al., Reference Kocalevent, Hinz and Brähler2013). A higher prevalence has been reported in clinical samples, with 16.1% of Dutch general practice participants reporting somatoform disorders as classified in the Diagnostic and Statistical Manual of Mental Disorders, Fourth Edition (DSM-IV; de Waal et al., Reference de Waal, Arnold, Eekhof and van Hemert2004), and 18.5% of Australians being classified as somatisers (Clarke et al., Reference Clarke, Piterman, Byrne and Austin2008). Despite the varying prevalence, a common finding in the studies is a high comorbidity of PSYCH, anxiety/depressive disorder, and somatoform disorders (Barsky et al., Reference Barsky, Wyshak and Klerman1992; Clarke et al., Reference Clarke, Piterman, Byrne and Austin2008; de Waal et al., Reference de Waal, Arnold, Eekhof and van Hemert2004; Escobar et al., Reference Escobar, Gara, Silver, Waitzkin, Holman and Compton1998; Eytan et al., Reference Eytan, Haller, Wolff, Cerutti, Sebo, Bertrand and Niveau2011; Maier & Falkai, Reference Maier and Falkai1999; Ormel et al., Reference Ormel, VonKorff, Ustun, Pini, Korten and Oldehinkel1994). A higher level of distress, as measured by the 10-item Kessler Psychological Distress Scale (K10; Kessler et al., Reference Kessler, Andrews, Colpe, Hiripi, Mroczek, Normand and Zaslavsky2002), is associated with higher probability of meeting criteria for a mental disorder or substance use (SU) disorder (Andrews & Slade, Reference Andrews and Slade2001; Slade et al., Reference Slade, Grove and Burgess2011).
SPHERE-12 for Measuring PSYCH and SOMA
The 12-item Somatic and Psychological Health Report (SPHERE-12) is shortened from the original 34-item SPHERE for screening mental illnesses that are commonly found in primary care settings and for use in research (Hickie et al., Reference Hickie, Davenport, Hadzi-Pavlovic, Koschera, Naismith, Scott and Wilhelm2001). The SPHERE-12 questionnaire consists of two six-item sub-scales: the PSYCH-6, measuring PSYCH, and the SOMA-6, measuring SOMA.
Short questionnaires can be advantageous as short instruments with 12 or fewer items, such as the Beck Depression Inventory-Short Form (BDI-SF; Beck & Steer, Reference Beck and Steer1993), Patient Health Questionnaire-9 (PHQ-9; Kroenke et al., Reference Kroenke, Spitzer and Williams2001), and K10 (Kessler et al., Reference Kessler, Andrews, Colpe, Hiripi, Mroczek, Normand and Zaslavsky2002), have been shown to be as accurate as longer questionnaires that contain 15 or more items (Cheng & Chan, Reference Cheng and Chan2005) in detecting depression (Akena et al., Reference Akena, Joska, Obuku, Amos, Musisi and Stein2012). In addition, they can be completed in a shorter time with lower participant burden and higher completion rates. Few studies have focused on PSYCH and SOMA measured with the SPHERE scale (Clarke & McKenzie, Reference Clarke and McKenzie2003; Couvy-Duchesne et al., Reference Couvy-Duchesne, Davenport, Martin, Wright and Hickie2017a).
Classical Twin Studies
The classical twin study provides a unique opportunity to understand the extent to which a trait or a group of related traits is governed by nature or nurture. This method is commonly used to estimate the relative importance of genetic or environmental influences on comorbid disorders (Agrawal et al., Reference Agrawal, Silberg, Lynskey, Maes and Eaves2010; Han et al., Reference Han, McGue and Iacono1999; Karkowski et al., Reference Karkowski, Prescott and Kendler2000; Kendler et al., Reference Kendler, Prescott, Myers and Neale2003; Kendler et al., Reference Kendler, Myers and Prescott2007; Lynskey et al., Reference Lynskey, Glowinski, Todorov, Bucholz, Madden, Nelson and Heath2004). Twin studies typically employ standard error of the mean (SEM), which provides various models to partition the variation of a single phenotype, or the covariance of multiple phenotypes, into additive genetic component and environmental component. Multivariate twin studies typically find that psychiatric disorders are influenced by both genetic and environmental factors (Gelernter, Reference Gelernter2015; Sullivan et al., Reference Sullivan, Neale and Kendler2000).
The Genetic Relationship Between PSYCH and SOMA
Few studies have examined the genetic etiology of PSYCH and SOMA (Ball et al., Reference Ball, Siribaddana, Sumathipala, Kovas, Glozier, Rijsdijk and Hotopf2011; Gillespie et al., Reference Gillespie, Zhu, Heath, Hickie and Martin2000; Hansell et al., Reference Hansell, Wright, Medland, Davenport, Wray, Martin and Hickie2012; Hickie et al., Reference Hickie, Kirk and Martin1999; Ivkovic et al., Reference Ivkovic, Vitart, Rudan, Janicijevic, Smolej-Narancic, Skaric-Juric and Deary2007). Moderate heritability has been estimated for PSYCH (0.18–0.4) and SOMA (0.32–0.43). A high genetic correlation (0.84) has been found between PSYCH and SOMA in Australian adolescents and young adults (Hansell et al., Reference Hansell, Wright, Medland, Davenport, Wray, Martin and Hickie2012), suggesting a large overlapping genetic effect on these two phenotypes. Little is known about the genetic relationship between PSYCH, SOMA, and the more severe mental disorders and SU.
Aims
The objectives of this study were to (1) validate the PSYCH-6 and SOMA-6 sub-scales; (2) estimate the heritability for the PSYCH-6 and the SOMA-6, as well as CIDI-based assessment of affective disorders (AD) and SU; and (3) examine the overlapping genetic influence on the PSYCH-6, SOMA-6, AD, and SU. We examined the internal consistency and reliability of the PSYCH-6 and SOMA-6. We applied the item response theory (IRT) modeling to create refined phenotypes that estimate the normalized liability to PSYCH, SOMA, AD, and SU. We estimated the heritability for individual AD, SU phenotypes, as well as the IRT theta scores for the four scales (PSYCH-6–IRT, SOMA-6–IRT, AD–IRT, and SU–IRT). Finally, we investigated the genetic and environmental influences on the covariance between these four IRT scores.
Materials and Methods
The 19Up Study
The Brisbane Longitudinal Twin Study (BLTS; Wright & Martin, Reference Wright and Martin2004) has collected a comprehensive array of neurobiological correlates, environmental risk factors, and endophenotypes for psychiatric disorders, since its inception in 1992 at QIMR Berghofer Medical Research Institute. The current study used data collected in one of the BLTS studies, 19Up (see Figure 1 for details of data collection; Couvy-Duchesne et al., Reference Couvy-Duchesne, O'Callaghan, Parker, Mills, Kirk, Scott and Gillespie2018; Gillespie et al., Reference Gillespie, Henders, Davenport, Hermens, Wright, Martin and Hickie2013).
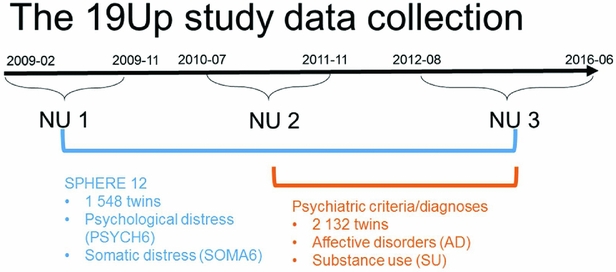
FIGURE 1 Timeline of data collection of psychological distress, somatic distress, and CIDI-based psychiatric diagnoses in the 19Up study.
PSYCH and SOMA were assessed with the SPHERE-12 questionnaire when the participants were on average 26 years old. The SPHERE-12 data were available from all the three waves of the 19Up: NU1, NU2, and NU3. In addition, the Diagnostic and Statistical Manual of Mental Disorders, Fifth Edition (DSM-5, American Psychiatric Association, 2013) diagnoses were made using an online version of the Composite International Diagnostic Interview (CIDI; World Health Organization, 1990). The CIDI-based diagnoses were collected in NU2 and NU3. The 19Up study was approved by the QIMR Human Research Ethics Committee. Data were stored in compliance with national regulations regarding personal data protection. Informed consent was obtained from all the participants.
Participants
Detailed descriptions of participation rates, sample demographics, and the prevalence of mental or SU disorders in the 19Up cohort have been published (Couvy-Duchesne et al., Reference Couvy-Duchesne, O'Callaghan, Parker, Mills, Kirk, Scott and Gillespie2018). The current study only used the data collected from twin individuals. The SPHERE-12 sample was comprised of 1,548 twin individuals. Their mean age was 25.3 years (age range: 18.4–38.4) and the sex ratio was 56.9% females. The CIDI sample was composed of measurements from 2,132 twin individuals. Their mean age was 26.1 years (age range: 18.7–38.6) and the sex ratio was 57.8% females. The number of complete twin pairs and twin individuals are shown for each study wave and zygosity group in Table 1.
TABLE 1 Number of Complete Twin Pairs and Individual Twins (Parenthetical) in Each Zygosity and Sex Group and Across All the Groups (Sum) From Different Waves of (1) SPHERE-12 Questionnaire, (2) Diagnostic Interviews, and (3) Twins Who Are in Both Samples (Overlapped)
Note: SPHERE-12 data were collected from three waves: NU1, NU2, and NU3. Diagnostic data were collected from two waves: NU2 and NU3.
Measures
Following standard administration procedures, respondents were asked to rate each SPHERE-12 item on the extent it had troubled them over the previous two weeks: sometimes or never having the problem (coded as 0), often (coded as 1), and most of the time (coded as 2). Internal consistency of the SPHERE-12 questionnaire was assessed using Cronbach's alpha (Cronbach, Reference Cronbach1951) both item by item and for the whole scale without excluding any items. A small proportion of the participants answered the SPHERE-12 questions in two or three waves, enabling us to evaluate the test–retest reliability of the questionnaire between (1) NU1 and NU2, (2) NU2 and NU3, and (3) NU1 and NU3. There were 132 participants in both NU1 and NU2, 20 participants in both NU2 and NU3, and 22 participants in both NU1 and NU3. SPHERE data used for the item-by-item assessment of internal consistency consisted of 2,122–2,126 twins and siblings. Phenotypes used in our univariate and multivariate genetic modeling were composed of measurements per twin individual. For twins with multiple measurements, their earliest wave was used.
The CIDI was used to assess various lifetime DSM-5 psychiatric criteria to obtain diagnostic classifications relevant to AD or SU. The AD included agoraphobia, depressive episodes, major depressive disorder (MDD), panic attack (PA), panic disorder (PD), and social anxiety. The SU phenotypes included ever using alcoholic beverages, tobacco products, cannabis, non-medical use of prescription drugs (e.g., pain killers, stimulants), or illicit drugs, such as cocaine, amphetamine, inhalants, sedatives or sleeping pills, hallucinogens, opioids, and party drugs (e.g., MDMA, ketamine, or gamma-hydroxybutyrate), as well as alcohol-use disorder (AUD), and cannabis-use disorder (CUD). We selected six binary AD diagnoses and three ordinal SU diagnoses to construct the AD and SU scale.
Non-Parametric Item Response Theory Modeling
We employed the non-parametric IRT to evaluate item properties within each psychiatric domain or scale (i.e., PSYCH-6, SOMA-6, AD, and SU). One advantage of IRT is that item difficulty and item discriminability are used to weight the items when calculating the IRT score. In addition, IRT makes it possible to combine information from uniquely measured psychopathology (Thomas, Reference Thomas2011). Consequently, the IRT score can yield more precise estimation of the underlying trait than a summed score. This represents an improvement over the classical test theory, in which different items are usually assumed to have equal difficulty and discriminability and items’ properties cannot be evaluated.
IRT models can be categorized as parametric IRT or non-parametric IRT. The parametric IRT assumes a logistic shape on item-response step functions (IRSFs). This more restricted method can lead to the rejection of useful items when the assumption is violated. Non-parametric IRT, however, does not impose a logistic shape on the IRSFs. This flexible method has become increasingly popular in modeling various scales, such as personality (Maydeu-Olivares, Reference Maydeu-Olivares2005), quality of life (Sijtsma et al., Reference Sijtsma, Emons, Bouwmeester, Nyklíček and Roorda2008), psychopathology (e.g., Khan et al., Reference Khan, Lewis and Lindenmayer2011; Meijer & Baneke, Reference Meijer and Baneke2004), and mental health (Stochl et al., Reference Stochl, Jones and Croudace2012).
In IRT, the family of graded response models (GRMs; Samejima, Reference Samejima1968) is suitable for analyzing polychotomous items collected by means of response scales (Hemker et al., Reference Hemker, Sijtsma, Molenaar and Junker1997; Mellenbergh, Reference Mellenbergh1995). IRT models the probability of answering each option in an item as a function of the underlying trait (e.g., level of depression or somatization). Such conditional probabilities are often referred to as IRSFs. Here, we used non-parametric GRM (np-GRM) that makes no assumptions about the underlying shape of the IRSF (Sijtsma et al., Reference Sijtsma, Emons, Bouwmeester, Nyklíček and Roorda2008). This model allows the checking of a fundamental requirement in IRT and scale construction — the probability of reporting a symptom is a strictly growing function of the latent score (hypothesis of monotonicity of IRSF). In practice, this ensures that the ordering of respondents on the score reflects the true ordering on the latent trait (Ark, Reference Ark2005).
The np-GRM employs a kernel-smoothing technique to model the relationship between the level of underlying trait and the probability of choosing a particular option for a questionnaire (Ramsay, Reference Ramsay1991). We visually examined the IRSF of every item for determining items that were included in the final scales. Items were included in the np-GRMs if they were monotonically increasing. The PSYCH-6 (questions 1–6 in Table 2) and the SOMA-6 (questions 7–12 in Table 2) included every item in their np-GRMs. The AD scale included the aforementioned six binary DSM-5 diagnosis items. The SU scale included three ordinal diagnoses: AUD, CUD, and degree of drug use. The degree of drug use was derived from ever using any illicit substance aforementioned. This variable was coded as 0 for never using any of the nine drugs, 1 for ever using any one of them, 2 for ever using any two of them, and 3 for ever using 3 or more of them. The IRT scaling provided a better distributional shape, with reduced skewness and kurtosis relative to the scaling of the PSYCH-6 and the SOMA-6 summed scores (Figure S1).
TABLE 2 Internal Consistency Assessed With Cronbach's Alpha Coefficients and Test–Retest Reliability Assessed With Intra-class Correlation Coefficients for Individual SPHERE-12 Questionnaire Items

Note: Psychological distress sub-scale included items 1–6. Somatic distress sub-scale included items 7–12. Cronbach's alpha coefficients for each item represent the effect of removing that item from the computation of the alpha coefficients (e.g., if item 1 is removed, the resulting value for the scale is 0.87, if item 2 is omitted, it is 0.87, and so on). 95% confidence intervals shown in square brackets.
We attempted various data transformations for PSYCH-6 and SOMA-6 measurements; however, a reverse J-shaped distribution was seen in all the transformed measurements. Even though IRT modeling attempts to put all data on a normal scale of liability with a limited number of items, it was not possible to remove all kurtosis and skewness, which is evident in the distribution of our data. We combined the PSYCH-6 and SOMA-6 measurements across the three waves, as we did not find significant differences in the IRT scores among the three study waves for the PSYCH-6 (Kruskal–Wallis chi-squared = 3.4,511, df = 2, p value = .1781) and the SOMA-6 (Kruskal–Wallis chi-squared = 0.69,418, df = 2, p value = .7067). The IRSFs for the four scales, PSYCH-6, SOMA-6, AD, and SU, are shown in Figures S2–S5.
Basic Assumption Tests
There are different zygosity and sex groups in the twin design (Evans et al., Reference Evans, Frazer and Martin1999). For binary phenotypes, the differences in thresholds and covariances were examined between different zygosity and sex groups. For continuous phenotypes, the differences in means, variances, and covariances were examined across all the groups (Evans et al., Reference Evans, Frazer and Martin1999). When no significant differences are found between the groups, means and variances can then be combined across the groups to estimate the underlying population mean and variance (Evans et al., Reference Evans, Frazer and Martin1999).
Univariate Twin Modeling
The observed variance of the phenotypes was partitioned into (A) additive genetic, (D) dominant genetic, (C) common environmental, and (E) unshared environmental variation using a univariate ACE or ADE model. The ACE models were fit for the phenotypes where MZ correlations (rMZ) were smaller than twice the DZ correlations (rDZ). The ADE models were fit for the phenotypes where rMZ were greater than twice the rDZ. The presence of D effect was not significant, given large sample sizes are required to detect a significant D.
Univariate twin models were fit separately for each continuous, binary, and ordinal phenotypes using the full-information maximum likelihood (FIML) method, which allows the use of data from all available individuals (see the number of twins in Table 3), including those without co-twins and those with co-twins who had missing measures. The log-likelihood ratio test was performed to assess the fit of nested models. We regressed the IRT scores (PSYCH-6–IRT, SOMA-6–IRT, AD–IRT, and SU–IRT) against covariates age of survey, sex, and study waves for obtaining their residuals. The four residualized IRT scores (PSYCH-6r, SOMA-6r, ADr, and SUr) were used to fit multivariate twin models.
TABLE 3 Maximum Likelihood Estimate Beta (Standard Error) of Age and Sex, Twin Correlations (Standard Errors), and Heritability (95% Confidence Interval) for Affective Disorders, Substance Use, PSYCH- 6, and SOMA- 6 Distress Sub-scales of the SPHERE-12

Note: Total number of subjects (N), number of complete MZ, or DZ twin pairs (individuals) are given. Significant betas are in bold-face. rMZ and rDZ are shown as NC when these correlations are too small. The heritability is bolded when the AE models are significantly different from the E models. The heritability is shown as NC when both rMZ and rDZ are NC. NC = not calculable.
Multivariate Twin Modeling
Multivariate twin models allow us to estimate the relative contribution of genes and environment to the covariation between measures (Neale & Cardon, Reference Neale and Cardon1992). Our analytical flow started with fitting the fully saturated Cholesky decomposition (CD) for PSYCH-6r, SOMA-6r, ADr, and SUr, followed by the more parsimonious independent pathway (IP) models, and common pathway (CP) models. To make it easier for researchers who are not familiar with twin studies and SEM, we provided conceptual path diagrams for the quadrivariate CD (Figure S6), IP (Figure S7), and CP (Figure S8) model. SEM enables us to quantify the effect of a single latent variable on an observed variable. High magnitudes of path coefficients indicate that latent variables have a large effect on the observed variables. The relative contribution of different latent variables to the variation of an observed variable can be quantified by squaring the standardized path coefficients. The CD model assumes one A, one C, and one E factor influences each of the four observed variables. As this model does not carry an assumption about the underlying genetic and environmental architecture, it was used as the base model against its nested sub-models (e.g., Cholesky AE, Cholesky CE, and Cholesky E) and the more parsimonious IP and CP models were compared.
The IP model hypothesizes that genes and environment exert differential influence on the covariance between phenotypes (Gillespie & Martin, Reference Gillespie, Martin, Everitt and Howell2005). This model estimates one set of shared genetic factor (Ac), common environmental factors (Cc), and unshared environmental factors (Ec), which influence the covariation between the four phenotypes via separate paths to each of them. In addition, this model also estimates genetic factor (As), common environmental factors (Cs), and unshared environmental factors (Es) that are specific to each phenotype, to explain the remaining phenotype-specific variance.
Nested within the IP model, the CP model is more parsimonious and restrictive than the IP model. This model hypothesizes that the covariation between the four phenotypes is influenced by common A, C, and E factors through a latent factor (Gillespie & Martin, Reference Gillespie, Martin, Everitt and Howell2005). Similar to the IP model, the CP model estimates phenotype-specific variance with A, C, and E factors that are specific to each phenotype. More complicated models, such as the IP with two or three common genetic factors, were also explored. We interpreted the parameter estimates, such as phenotypic correlations (rP), genetic correlations (rG), environmental correlations (rE), and factor loading, from the best-fitting multivariate model.
Statistical Software
We used R (R Core Team, 2016) and SAS 9.4 (SAS Institute Inc., 2013) for statistical analyses, graph, and table generation. The following R packages were used: package psy (Falissard, Reference Falissard2012) for internal consistency (Cronbach's alpha coefficient), package irr (Gamer et al., Reference Gamer, Lemon, Fellows and Singh2012) for test–retest reliability, package KernSmoothIRT (Mazza et al., Reference Mazza, Punzo and McGuire2014) for the np-GRM models, and package OpenMx (Boker et al., Reference Boker, Neale, Maes, Wilde, Spiegel, Brick and Wilhelm2017) for twin modeling. Path diagrams were generated using Ωnyx (Oertzen et al., Reference Oertzen, Brandmaier and Tsang2015).
Results
Internal Consistency and Test–Retest Reliability of SPHERE-12
Good internal consistency (Cronbach's alpha: 0.87–0.88, Table 2) was seen in the SPHERE-12 scale, with the scale hardly varying as each item was dropped in turn, suggesting a high level of homogeneity among these items. A normal distribution in the intervals, assessed with Shapiro–Wilk test, was found between NU2 and NU3 (W = 0.94, Pr < W: 0.27) and between NU1 and NU3 (W = 0.94, Pr < W: 0.16), but not between NU1 and NU2 (W = 0.97, Pr < W: 0.004). Moderate intra-class correlations (ICC; Table 2) were found between NU1 and NU2 (ICC: 0.59–0.65, interval: 1.6 ± 0.3 years, range: 0.2–2.5 years) and between NU2 and NU3 (ICC: 0.5–0.62, interval: 4.3 ± 0.8 years, range: 2.5–6.3 years). The ICC values were non-significant between NU1 and NU3 in each of the 12 items and the total scores.
Basic Assumption Tests
For binary phenotypes, no significant birth-order effect on the thresholds was found (Table S2: H1t). A zygosity effect (Table S2: H2t) was found only in alcohol use. Significant differences between correlations of MZ twins (rMZ) and DZ twins (rDZ) were found in drug use ever, and cannabis use ever (Table S2: H3c). We found a significant familiar aggregation effect (Table S2: H4c) in all the AD and SU phenotypes, except for agoraphobia and PD.
For continuous phenotypes, we did not find a significant birth-order effect (Table S3: H1m) or zygosity effect (Table S3: H2m) on the means. Significant differences between rMZ and rDZ (Table S3: H3c) were found in all the phenotypes, suggesting the presence of significant genetic effects in these phenotypes. A significant familiar aggregation effect on the covariance (Table S3: H4c) was found in all the phenotypes.
Univariate Genetic Analyses
As shown in Table S4, the results of the univariate genetic analyses revealed that the additive genetic (A) and unshared environmental (E) effect model best explained the variation in all the phenotypes (bolded AE models) except for AU and tobacco use ever. Table 3 shows the sample sizes, estimates of betas, twin correlations, and heritability from the best-fitting models for each of these phenotypes. We found a significant effect of age in all SU phenotypes, PSYCH-6-IRT, and SOMA-6-IRT, but not in any AD phenotypes. Sex had a significant effect on the variance of all the phenotypes except for SOMA-6-IRT. Significantly higher rMZ than rDZ was found in all the phenotypes except for agoraphobia and PD. Most AD phenotypes were moderately heritable, with heritability ranging from 37% for PA to 42% for social anxiety. The SU phenotypes were found to be more heritable than the AD phenotypes, with heritability ranging from 49% for AUD to 79% for ever using drugs. We were unable to estimate heritability for agoraphobia and PD as the low prevalence of these disorders resulted in a lack of discordant/concordant twin pairs, which resulted in insufficient information in the analyses.
Multivariate Genetic Analyses
Table S5 shows the model-fitting results for various multivariate models. Dropping the C component from the full Cholesky ACE model did not lead to a significant loss of model fit (Model 2). Dropping the A component (Model 3), or A and C component (Model 4), however, led to significant losses of fit. We then fit alternative IP models with one common genetic factor (Model 5), IP with two common genetic factors (IP2A; Model 6), IP with three common genetic factors (Model 7), as well as the CP model (Model 8). As none of these models led to significant loss of fit, we then explored the most parsimonious models from the IP model and IP2A model. To test the importance of the A, C, and E components, we fit a series of nested models by dropping these components from the common and the specific paths of the IP model (Models 10–17) and the IP2A model (Models 21–28). The C component could be dropped from both the common and specific paths of the IP model (Model 17), as well as the IP2A model (Model 28), without significantly loss of fit. Moreover, the IP_AE_AE model (Model 33) and the IP2A_AE_AE model (Model 34) had a lower AIC than the Cholesky AE model (Model 12). We present the parameter estimates from IP_AE_AE (Figure 2) as it had the lowest AIC.
FIGURE 2 Path diagram of an independent pathway (IP) model with standardized parameter estimates. The IP model has an additive genetic (Ac) factor and a unique environmental factor (Ec) that are common to all four phenotypes, as well as genetic factor (As) and unshared environmental factor (Es) that are specific to each phenotype. All shared environmental influences have been dropped without worsening the model fit. Solid lines indicate significant paths and dotted lines indicate non-significant paths (95% confidence intervals include zero). Standardized path coefficients, their 95% confidence intervals (CIs), and percentage of variation of a phenotype explained by a factor are presented for significant paths. Non-significant paths are shown with path coefficients and 95% CIs.
Table 4 shows rP, rG, and rE between any two of the four phenotypes. Significant rP’s were found between all the four phenotypes, with an average of 0.22 (range: 0.06–0.51). Significant and higher rG, ranging from 0.15 to 0.85, was also found between the four phenotypes. The magnitude of rG between the PSYCH-6r and ADr was very close to that between the SOMA-6r and ADr. The same pattern was also seen when comparing the rG between PSYCH-6r and SUr with the rG between the SOMA-6r and SUr. Significant rE was only found between the PSYCH-6r and the SOMA-6r, the PSYCH-6r and ADr, and the PSYCH-6r and SUr.
TABLE 4 Estimates of Phenotypic, Genetic, and Environmental Correlations Between Psychological (PSYCH-6r) and somatic (SOMA-6r) Distress Sub-scales of the SPHERE-12, the Affective Disorders (ADr), and Substance Use (SUr) Scales

Note: 95% confidence intervals shown in square brackets. Significant correlations that did not include zero in their confidence intervals are bolded.
The common unshared environmental factor (Ec in Figure 2) had a significant influence on the PSYCH-6r, SOMA-6r, and ADr, explaining 5–73% of their variation. The specific environmental factors (Es) had a significant effect on SOMA-6r, ADr, and SUr, explaining 53–64% of their variations. In phenotypes with significant Ec and Es, the Es had a much larger contribution than the Ec. A different pattern was seen in the additive genetic influence. The common additive genetic factors (Ac) had significant loading onto each set of the four phenotypes, explaining 3–22% of their variations. The specific additive genetic factors (As), however, were allowed to load only onto ADr and SUr. The relative contribution of the As was two to four times larger than the Ac.
Discussion
This is the first study to investigate the overlapping genetic and environmental influences underlying the four comorbid disorders — PSYCH, SOMA, AD, and SU — in young Australian adults. We began our analytical flow with the validation of the SPHERE-12 instrument and then dissected the genetic and environmental influences using univariate and multivariate twin modeling. We found evidence for a small but significant genetic influence that was common to all the four phenotypes (Ac). The unshared environmental factors exerted greater influence on the four phenotypes; however, these influences were largely specific to SOMA, AD, and SU. This suggests that the genetic and environmental influences on the four phenotypes may be best explained by one common genetic factor (Ac), one unshared environmental factor that is common to the PSYCH-6, the SOMA-6, and AD (Ec), and genetic (As) and unshared environmental factors (Es) that were specific to some phenotypes.
Test–Retest Reliability of SPHERE-12
The SPHERE-12 has proved to be a highly consistent and moderately reliable instrument in our young Australian sample, which is consistent with longer SPHERE questionnaires such as the SPHERE-21 (Couvy-Duchesne et al., Reference Couvy-Duchesne, Davenport, Martin, Wright and Hickie2017) and the SPHERE-34 (Hansell et al., Reference Hansell, Wright, Medland, Davenport, Wray, Martin and Hickie2012). Internal consistency (Cronbach's alpha) was consistent between the PSYCH sub-scales (our PSYCH-6: 0.86; anxiety depression: 0.86–0.88; PSYCH-14: 0.87) and between SOMA sub-scales (our SOMA-6: 0.81; chronic fatigue: 0.78–0.79; SOMA-10: 0.7), suggesting that the item reduction did not lower the consistency of the SPHERE questionnaire.
Test–retest reliability, commonly assessed by ICC, reflects the variation in measurements taken during a test and a retest on the same subjects and under the same conditions (Koo & Li, Reference Koo and Li2016). The value of ICC can be influenced by factors such as variability among participants, sample sizes, and the time between the test and the retest. The ICC of our PSYCH-6, 0.47–0.48, was consistent with the anxiety-depression sub-scale, 0.47, reported by Couvy-Duchesne et al. (Reference Couvy-Duchesne, Davenport, Martin, Wright and Hickie2017). However, the ICC in our SOMA-6 (ICC: 0.36–0.5) was lower than their chronic fatigue subscale (ICC: 0.57). The fact that our NU1–NU3 ICCs were non-significant and lower than NU1–NU2 ICCs and NU2–NU3 ICCs may be attributed to the long NU1–NU3 interval (mean interval: 5.4 ± 0.7 years, range: 4.4–6.8 years) or the stability of PSYCH-6 or SOMA-6 measurements over time. Longer test–retest intervals have been shown to increase inconsistency (Dareng et al., Reference Dareng, Adebamowo, Eseyin, Odutola, Pharoah and Adebamowo2017).
Univariate Findings
Our heritability estimates were generally consistent with previous studies. Heritability estimates can vary between studies due to their variations in study designs, such as age groups, sample sizes, sexes, data collection methods (e.g., via self-reporting questionnaires or diagnostic interviews), and source of participants (e.g., community or clinical samples). Bearing in mind these differences, we checked to see whether our heritability estimates overlapped with the confidence intervals of heritability estimates reported from previous studies.
We found low but significant heritable influences on the PSYCH and the SOMA. Our heritability estimates for the PSYCH-6–IRT (0.23, 95% CI [0.13, 0.33]) and the SOMA-6–IRT (0.25, 95% CI [0.15, 0.35]) were consistent with heritability estimates for similar sub-scales in the oldest age groups (Couvy-Duchesne et al., Reference Couvy-Duchesne, Davenport, Martin, Wright and Hickie2017). They reported heritability 0.37 (95% CI [0.21, 0.51]) for anxiety-depression IRT scores at age 17–19 and 0.27 (95% CI [0.11, 0.41]) for chronic fatigue at the same ages.
We found moderate to high heritability estimates on the liability to AD and SU phenotypes (Table 3). For AD diagnostic phenotypes, our heritability estimates were in accordance with previous studies. Sullivan et al. (Reference Sullivan, Neale and Kendler2000) attributed on average 37% (range: 31–42%) of the variation in major depression to additive genetic factors by reviewing four community studies (Bierut et al., Reference Bierut, Heath, Bucholz, Dinwiddie, Madden, Statham and Martin1999; Kendler et al., Reference Kendler, Pedersen, Neale and Mathé1995; Kendler & Prescott, Reference Kendler and Prescott1999; Lyons et al., Reference Lyons, Eisen, Goldberg, True, Lin, Meyer and Tsuang1998) and two clinical studies (Kendler et al., Reference Kendler, Pedersen, Neale and Mathé1995; McGuffin et al., Reference McGuffin, Katz, Watkins and Rutherford1996). These reviewed studies employed various data collection methods, such as semi-structured interviews, mailed questionnaires, telephone interviews, or diagnostic assessments on probands with MDD. Rijsdijk et al. (Reference Rijsdijk, Snieder, Ormel, Sham, Goldberg and Spector2003) reported an estimate of 0.39–0.42 for severe depression, measured with GHQ, in female twins aged 18–79 (mean age: 47.7). Our heritability estimates for MDD (0.41, 95% CI [0.24, 0.57]) and depressive episodes (0.41, 95% CI [0.24, 0.56]) fell within the range reported from these studies. Unfortunately, heritability for agoraphobia and PD was not estimable, given insufficient cases in MZ and DZ twins (Table S1). We therefore compared our heritability of PA with that of PD, as PA is one of the defining features of PD. Previous studies reported a considerable variation in the heritability of PD, ranging from 0.28 in female twins (Hettema et al., Reference Hettema, Prescott, Myers, Neale and Kendler2005) to 0.48 from a meta-analysis (Hettema et al., Reference Hettema, Neale and Kendler2001) that combined data from five family studies and five twin studies. Our heritability of PA (0.37; 95% CI [0.17, 0.55]) was within this range. To our knowledge, the heritability of DSM-5 social anxiety has not been reported. However, studies that assessed a relevant symptom, social anxiety disorder (SAD), with diagnostic interviews on twin samples have reported a considerable variation in their heritability estimates, ranging from 0.1 to 0.55 (Czajkowski et al., Reference Czajkowski, Kendler, Tambs, Røysamb and Reichborn-Kjennerud2011; Hettema et al., Reference Hettema, Neale, Myers, Prescott and Kendler2006; Kendler et al., Reference Kendler, Myers, Prescott and Neale2001; Nelson et al., Reference Nelson, Grant, Bucholz, Glowinski, Madden, null Reich and Heath2000; Reichborn-Kjennerud et al., Reference Reichborn-Kjennerud, Czajkowski, Torgersen, Neale, Ørstavik, Tambs and Kendler2007). Our heritability estimate for social anxiety 0.42 (95% CI [0.23, 0.58]) was close to the upper range.
For SU phenotypes, we found that 50–79% of the variation was attributable to the additive genetic influence, which is comparable with heritability estimates for SU. To our knowledge, this is the first twin study that reports heritability estimate (0.78, 95% CI [0.66, 0.86]) for CUD using DSM-5 diagnosis. A meta-analysis (Verweij et al., Reference Verweij, Zietsch, Lynskey, Medland, Neale, Martin and Vink2010) reviewed 28 studies for heritability estimates for cannabis use initiation and problematic cannabis use; most of these phenotypes were defined by DSM-IV-TR (American Psychiatric Association, 2000). They reported heritability estimates of 48% in male twins and of 40% in female twins for cannabis use initiation. Higher heritability was found in problematic cannabis use: 51% in men and 59% in women. Another study reported heritability of 72% for the DSM-IV (American Psychiatric Association, 1994) definition of cannabis abuse or dependence in young Australian adults (Lynskey et al., Reference Lynskey, Agrawal, Henders, Nelson, Madden and Martin2012). A recent study found that 21% of the phenotypic variation in the DSM-5 CUD was attributable to the genomic variation in common SNPs, but this estimate was found to be non-significant (Agrawal et al., Reference Agrawal, Lynskey, Bucholz, Kapoor, Almasy, Dick and Bierut2014). It is worth noting that the diagnostic criteria for SU disorder differ between the DSM-IV and the DSM-5. The distinction between substance abuse and substance dependence in the DSM-IV has been replaced with a single SU disorder in the DSM-5 (Hasin et al., Reference Hasin, O'Brien, Auriacombe, Borges, Bucholz, Budney and Grant2013). Our heritability for AUD, 0.50 (95% CI [0.4, 0.59]), is similar to the best-fit estimate of 0.49 (95% CI [0.43, 0.53]) reported by Verhulst et al. (Reference Verhulst, Neale and Kendler2015). Another study reported a wide range of heritability (49–64%) for alcoholism (McGue, Reference McGue1999). For AU and tobacco use, dropping the A component did not lead to losses of fit, whereas dropping the C component led to losses of fit. With the lowest AIC, the resulting CE models best explained the variance of the two phenotypes.
Multivariate Findings
We found a strong genetic correlation (rG = 0.85) between the PSYCH-6r and the SOMA-6r, which is consistent with longer SPHERE sub-scales. Couvy-Duchesne et al. (Reference Couvy-Duchesne, Davenport, Martin, Wright and Hickie2017) found high genetic correlations of 0.85–1.00 between anxiety-depression and chronic fatigue IRT scores in four younger age groups (<13, 13–15, 15–17, and 17–19 years). Hansell et al. (Reference Hansell, Wright, Medland, Davenport, Wray, Martin and Hickie2012) reported a high rG of 0.87 between the PSYCH-14 and the SOMA-10 at mean age 15.5 years (age range: 12.0–25.6). Our results, together with these findings, suggest that the genetic overlap between PSYCH and SOMA remained consistently high in adolescents and young adults. It is interesting to note that the two SPHERE sub-scales had a similar genetic overlap with ADr (rG = 0.49, 0.53) and SUr (rG = 0.23, 0.25). Although the main objectives of this study were not to compare summed scores with IRT scores, we found a high rP between them in both the PSYCH-6 (rP: 0.81, 95% CI [0.79, 0.82]) and the SOMA-6 (rP: 0.82, [95% CI: 0.8, 0.84]).
An important finding from our independent pathway model was that the genetic influence on the four phenotypes was through the actions of three sets of genetic factors. The first set, the common genetic factor (Ac), explained 3–22% of the variance of the four phenotypes. The second and third sets were genetic factors (As) that were specific to ADr and SUr. For these two phenotypes, these As explained a larger proportion of their variance than the Ac.
What are the implications of the common genetic influence underlying comorbid psychiatric disorders? Given the genetic factors derived from multivariate models are statistically defined as a hypothetical predictive construct (Carey, Reference Carey1988), the genetic covariation does not directly map onto an inference about shared loci. However, the shared genetic construct suggests the potential utility of treatment approaches that target comorbid conditions in the absence of manifest comorbidity.
Limitations
The use of a genetically informative sample and comprehensive sets of phenotypes were the strength of this study; however, our results should be interpreted considering the following limitations. First, the low prevalence rates of agoraphobia and PD did not allow the estimation of their heritability. The estimation of heritability requires calculable rMZ and rDZ (i.e., neither zero nor negative). There were limited pairs of twins who were concordant for these disorders, meaning that we were unable to estimate the heritability for these phenotypes (Table S1). However, we included these items in our IRT modeling as they showed acceptable IRSF (Figure S4). Low prevalence is a common problem in these binary traits (Goodwin et al., Reference Goodwin, Faravelli, Rosi, Cosci, Truglia, de Graaf and Wittchen2005; Mosing et al., Reference Mosing, Gordon, Medland, Statham, Nelson, Heath and Wray2009). Second, our use of a cross-sectional design could limit the generalizability of our results beyond the age group 18–38 years. Third, we combined the PSYCH-6 and SOMA-6 measurement from all the study waves and sexes in order to obtain their genetic estimates in a sample as large as possible. This may have diluted the difference in variance and covariance components between the waves and between the sexes. Fourth, our study was well powered to reject the C component in favor of an AE source model, but was insufficiently powered to distinguish the IP and CP structural models within the AE source model. Finally, although we found that unique environmental factors and additive genetic factors explained on average 67.5% and 29.5% of the covariance between the four phenotypes, we do not know how these influences may change over age. For personality traits, genetic contribution tends to be stable over time, whereas new environmental effects emerge over time (Read et al., Reference Read, Vogler, Pedersen and Johansson2006). Similar results have also been found on the genetic and environmental influences on subjective well-being (Nes et al., Reference Nes, Røysamb, Tambs, Harris and Reichborn-Kjennerud2006). To study the stability of genetic influence on common psychiatric disorders, future work needs to use a longitudinal twin design.
Conclusions
The present study shows that both nature and nurture play an important role in the liability to PSYCH, SOMA, AD, and SU in young adults. We found consistently high internal consistency between the 12-item SPHERE and the longer SPHERE instruments. We examined the item properties for each of these four illnesses using non-parametric item response theory models. We found a high genetic overlap between PSYCH and SOMA. These shared genetic effects suggest the potential utility of treatment approaches that target comorbid conditions in the absence of manifest comorbidity.
Acknowledgments
We thank the twins and their siblings for participating in our studies. Special thanks to Ming-Chung Chiu for advice regarding better programming practices in R. The 19Up study was funded by NHMRC (APP10499110) and NIH (K99R00, R00DA023549) grants. LHC is supported by a QIMR Berghofer Medical Research Institute scholarship. SEM is supported by an NHMRC fellowship (APP1103623). We will not make their data available to other researchers due to regulations at QIMR Berghofer Medical Research Institute. We did not preregister this research in an independent, institutional registry.
Disclosure of Interests
None of the authors had a conflict of interest to disclose.
Supplementary material
To view supplementary material for this article, please visit https://doi.org/10.1017/thg.2018.33