


Physical inactivity is a key modifiable risk factor for CVD, type 2 diabetes and the metabolic syndrome, a precursor of these diseases(Reference Haskell, Lee and Pate1–3). Sedentary behaviour (too much sitting, as distinct from too little exercise) is a recently identified health risk that has shown associations with the metabolic syndrome and its components in cross-sectional(Reference Dunstan, Salmon and Owen4–Reference Ford, Kohl and Mokdad6) and prospective studies(Reference Katzmarzyk, Church and Craig7, Reference Dunstan, Barr and Healy8), mostly conducted in Western populations. Evidence from Oman demonstrates associations of physical inactivity, particularly in the work and transport domains, and sitting time with higher odds of the metabolic syndrome, although these associations are not completely independent(Reference Mabry, Winkler and Reeves9). Given the rising prevalences of obesity, type 2 diabetes, CVD and other chronic diseases in Oman(Reference Al-Lawati, Mabry and Mohammed10), reducing physical inactivity and prolonged sitting are public health priorities.
Recent reviews have identified lower educational attainment, lower income and older age to be consistently associated with physical inactivity, with evidence primarily from adults in developed countries(Reference Bauman, Sallis and Dzewaltowski11, Reference Trost, Owen and Bauman12). Less is known about the prevalence and correlates of sitting time(Reference Owen, Sugiyama and Eakin13). A recent review using data from twenty developed and developing countries identified older age and higher educational attainment to be associated with higher overall sitting time(Reference Bauman, Ainsworth and Sallis14).
Using a cross-sectional population-representative data set, the present study examined the sociodemographic, anthropometric and behavioural correlates of physical inactivity in the work, transport and leisure domains, and of sitting time, among Omani adults.
Methods
Overview of the Sur Healthy Lifestyle Survey
The Sur Healthy Lifestyle Survey is a cross-sectional survey of Omani men and non-pregnant women aged 20 years or older residing in the city of Sur; data collection took place from March to June 2006. It followed the WHO STEPwise methodology, a standard method of data collection on key risk factors for chronic diseases(15). The Arabic version of the WHO STEPwise instrument was adapted to the local context using the local Arabic dialect, incorporating additional questions on dietary intake and deleting the section on alcohol use due to the sensitivity of asking this information. A multistage sampling design was used where a random sample of 1700 houses was selected from 191 census clusters in Sur City and an individual was randomly selected in each selected household from all eligible household members. A high proportion of those selected completed the household interview and clinical measures (n 1373; 80·8 %). Ethical approval for the survey was granted by the Ministry of Health Research Committee. Participants with complete data for all key variables (n 1335; 97·2 %) were included in the present analyses. Only limited information on the study sampling frame and response rates was available. The sample differed in age and gender distribution from the Sur City population around the time of the survey (based on the most proximal National Census)(16). Thus, weights for each gender-specific 5-year age band were derived to ‘reweight’ the sample to the reference population (Sur City population, 2003)(16).
Data collection
The adapted Arabic version of the WHO STEPwise instrument was used to collect data for demographic variables (gender, age, education, work status and marital status), overweight and obesity, and behavioural risk factors (smoking, dietary habits, physical activity and sitting time). Demographic and behavioural data were collected using face-to-face household and individual interviews. Anthropometric measurements (height and weight) were taken following the WHO protocol(15) during the clinic visits. Questionnaires were reviewed for quality prior to data entry into the SPSS statistical software package version 9.
Potential correlates and outcome variables
The dependent variables were domain-specific physical inactivity and total sitting time measured using the sixteen-item Global Physical Activity Questionnaire (GPAQ) and scored as per standard protocols(17). GPAQ, developed by WHO and incorporated within the WHO STEPwise instrument, measures physical activity (intensity, duration and frequency) performed in three domains – work (paid and unpaid including housework), transport (walking and cycling) and leisure – as well as total sitting time. Studies have confirmed the validity and reliability of this instrument across diverse populations, but not Arab populations(Reference Armstrong and Bull18–Reference Trinh, Nguyen and van der Ploeg20). Physical activity was estimated by calculating energy expenditure using the metabolic equivalent of task (MET), the ratio of specific physical activity metabolic rates compared with the RMR (1 MET is equivalent to the energy cost of sitting quietly, 4·184 kJ (1 kcal)/kg per h). Total MET-min/d was calculated for each domain by first multiplying MET values by reported minutes, with moderate-intensity and transport activities assigned a value of 4 MET and vigorous-intensity activities assigned a value of 8 MET, and then adding the total MET-min of vigorous- and moderate-intensity activities performed.
Domain-specific activity variables did not follow a distribution that could easily be modelled and ordinal logistic regression assumptions were not met; thus, binary variables were used to define each physical inactivity outcome examined. A substantial proportion of participants did no transport and leisure physical activity; these outcomes were examined as none v. any, since inactivity (doing no activity) was of interest. All participants did at least some physical activity in the work domain; thus, this was examined as the lowest quartile (‘inactive’) v. the three higher quartiles of work physical activity in the Sur City population. The GPAQ instrument includes a single item on total sitting time: ‘Over the past 7 d, how much time did you spend sitting or reclining on a typical day?’, with responses reported as hours and/or minutes per day. Since the distribution of sitting time was non-normal, the natural logarithm for sitting time was used.
The independent variables included gender, age (20–29 years, 30–39 years, ≥40 years), education (less than secondary education, secondary education, post-secondary education), marital status (married, not married), employment status (employed, not employed), BMI (kg/m2; calculated as weight in kilograms divided by the square of height in metres), smoking status (current smoker, non-smoker) and intake of fruits and vegetables (<2 servings/d, ≥2 servings/d). Inclusion and categorization of variables was based on bivariate and regression analysis to ensure that there was sufficient power for the regression models and adequate numbers in all categories.
Data analysis
Data were analysed using the STATA statistical software package version 11. Independent associations of correlates of each physical inactivity outcome were estimated using binary logistic regression. Results are reported as odds ratios with 95 % confidence intervals. Independent associations of correlates of sitting time were estimated using linear regression. Results are reported as exponentiated beta coefficients with 95 % confidence intervals; these can be interpreted as ratios, sometimes termed ‘relative rates’. Whenever a significant correlate was identified, marginal probabilities (logistic regression) or means (linear regression) were also reported from these models to highlight the absolute prevalence of inactivity or mean sitting time (adjusted for confounders) in the population subgroups that had been identified as more inactive, or having higher sitting times, than their counterparts. All models were weighted to the Sur City population and included all correlates studied (age, education, employment status, marital status, daily number of vegetable and fruit servings, BMI; men's models also included smoking). Models (without weighting) were tested for gender and age interactions. Statistical significance was set at P < 0·05. Twofold higher or lower odds (logistic regression) or relative rates (linear regression) were considered potentially sizeable differences across categories (or across a meaningful exposure dose for continuous variables). As is the case for the P < 0·05 threshold for significance, these cut-offs are arbitrary but can be taken to indicate that associations are likely.
Results
The sample was young (mean age 36·3 (sd 12·5) years) with more than half having at least a high school education (57·7 %) and nearly two-thirds being married (61·6 %; see Table 1). In addition, the sample had a mean BMI in the overweight category (28·0 (sd 6·4) kg/m2). Overall, the highest level of physical inactivity was in the leisure domain (55·4 %); the median sitting time was about 2 h/d.
Table 1 Selected characteristics of participants in the Sur Healthy Lifestyle Survey, Oman, 2006
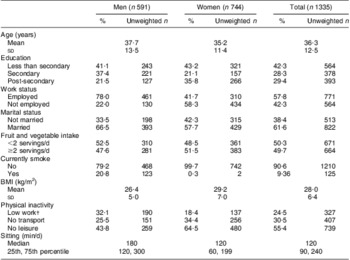
†Low work = lowest quartile.
Due to many statistically significant gender interactions, results are presented stratified by gender. Tables 2 and 3 present the independent correlates of men's and women's work, transport and leisure inactivity.
Table 2 Correlates of domain-specific physical inactivity in Omani men (n 591), Sur Healthy Lifestyle Survey, 2006Footnote †Footnote ‡
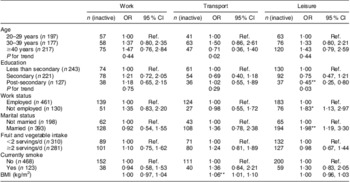
Ref., referent category.
* P < 0·05; **P < 0·01.
† Odds ratio and 95 % confidence intervals from logistic regression models, adjusted for all other variables in the table, weighted to the Sur City population, 2003. All n values presented are unweighted n within the sample.
‡ Participants classified as ‘inactive’ according to domain as follows: work, lowest quartile; transport and leisure, no physical activity.
Table 3 Correlates of domain-specific physical inactivity in Omani women (n 744), Sur Healthy Lifestyle Survey, 2006Footnote †Footnote ‡
Ref., referent category.
* P < 0·05.
† Odds ratio and 95 % confidence intervals from logistic regression models, adjusted for all other variables in the table, weighted to the Sur City population, 2003. All n values presented are unweighted n within the sample.
‡ Participants classified as ‘inactive’ according to domain as follows: work, lowest quartile; transport and leisure, no physical activity.
In men, none of the potential correlates examined showed significant associations with work inactivity. For transport inactivity, age (P for trend = 0·02) and BMI (P < 0·01) were significant correlates; for age, there was no clear increasing or decreasing trend and each additional BMI unit was significantly associated with a 6 % higher odds of transport inactivity (95 % CI 1, 10 %). Significantly higher odds of leisure inactivity were seen in men with lower levels of education (P for trend = 0·03), men who were not employed v. employed (P < 0·05) and married men v. unmarried (P < 0·01). Further examining adjusted prevalence across the identified correlates revealed some population subgroups who were commonly inactive considering the overall prevalence of inactivity (95 % CI) in men in Sur City: 31·2 (95 % CI 27·5, 35·0) % for work inactivity, 23·8 (95 % CI 20·3, 27·2) % for transport inactivity and 41·7 (95 % CI 37·7, 45·7) % for leisure inactivity. Adjusted prevalence (95 % CI) of leisure inactivity was 52·1 (95 % CI 41·9, 62·2) % in men who were not employed, 48·6 (95 % CI 41·6, 55·5) % in married men and 47·9 (95 % CI 39·8, 56·2) % in men with less than secondary education. Adjusted prevalence (95 % CI) of transport inactivity was 32·6 (95 % CI 23·6, 41·7) % in men who were obese (BMI ≥ 30·0 kg/m2) and 31·0 (95 % CI 23·2, 38·9) % in men aged 30–39 years.
In women, age was the only potential correlate significantly associated with work inactivity (P for trend = 0·03); specifically, those aged ≥40 years had more than double the odds of being inactive compared with the youngest cohort. No potential correlates had significant associations with transport inactivity. For leisure inactivity, work status and fruit and vegetable intake were significant correlates (both P < 0·05): the odds of leisure inactivity were approximately 1·8-fold higher in women who were not employed v. those employed and approximately 1·6-fold lower for women consuming at least two servings of fruits and vegetables daily v. those not. For women overall in Sur City, the adjusted prevalence (95 % CI) for work inactivity was 20·4 (95 % CI 17·5, 23·3) %, 33·9 (95 % CI 30·5, 37·3)% for transport inactivity and 65·7 (95 % CI 62·2, 69·1)% for leisure inactivity. Adjusted prevalence (95 % CI) across the identified correlates showed that the subgroups of women who were often ‘inactive’ were women aged ≥40 years (28·7 (95 % CI 20·0, 37·4)% for work inactivity), who were not employed (71·0 (95 % CI 65·5, 76·4) % for leisure inactivity) and who consumed less than two servings of fruit and vegetables daily (71·2 (95 % CI 65·9, 76·5) % for leisure inactivity).
Table 4 shows the correlates of sitting time. For men, there was only one significant correlate of sitting time (P for trend = 0·013): compared with those with less than secondary education, sitting time was relatively higher by 20 % in men with secondary education and by 32 % in men with post-secondary education. There was no evidence of an association of smoking or age with sitting time overall; however, the association of smoking with sitting time differed by age (P for interaction = 0·02). Using an additional model that included an interaction term for these variables, there was no association of smoking with sitting time in men aged 20–29 years and ≥40 years; however, in men aged 30–39 years, smokers had significantly higher mean sitting time than their non-smoking counterparts (215 (95 % CI 167, 277) min/d v. 149 (95 % CI 129, 173) min/d; P < 0·05; data not shown). The overall mean sitting time of men in Sur City was 157 (95 % CI 147, 168) min/d. Looking at the marginal means for the identified correlates revealed some groups of men with high sitting time, including those with post-secondary education (182 (95 % CI 157, 211) min/d) and smokers aged 30–39 years (215 (95 % CI 167, 277) min/d).
Table 4 Correlates of sitting time (natural logarithm) in Omani men and women, Sur Healthy Lifestyle Survey, 2006
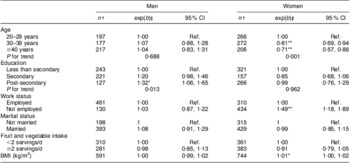
Ref., referent category.
*P < 0·05; **P < 0·01.
†Unweighted n.
‡Regression coefficient, back-transformed from the log scale weighted to the Sur City population, 2003; represents the ratio of sitting time relative to the referent group (categorical variables) or of a one unit increase (continuous variables).
For women, age, employment status and BMI were significantly associated with sitting time. Age was inversely associated with sitting time: compared with women aged 20–29 years, sitting time was relatively lower by 23 % in women aged 30–39 years (exp(b) = 0·81, 95 % CI 0·69, 0·94; P < 0·001) and by 41 % in women aged ≥40 years (exp(b) = 0·71, 95 % CI 0·57, 0·88; P < 0·001). Sitting time was relatively higher by 49 % in employed women compared with women who were not employed (exp(b) = 1·49, 95 % CI 1·18, 1·89; P < 0·01). In women, for every unit increase in BMI, there was a significant increase in sitting time (P < 0·05). The overall mean sitting time for women in Sur City was 122 (95 % CI 115, 130) min/d. Marginal means across the identified correlates showed high levels of sitting in certain groups of women: those aged 20–29 years (143 (95 % CI 127, 161) min/d), those who were not employed (141 (95 % CI 126, 158) min/d) and those who were obese (140 (95 % CI 126, 156) min/d).
Discussion
The present examination of the sociodemographic, anthropometric and behavioural correlates of physical inactivity and sitting time is one of the few available for a population from the Arabian Gulf and one of the few available internationally using the GPAQ. The population was most inactive in the leisure domain, compared with the transport and leisure domains, similar to some countries in Asia and Africa(Reference Guthold, Louazani and Riley21–24). Sitting time in our study was less than what has been reported in many other countries(Reference Bauman, Ainsworth and Sallis14, 24, 25). All attributes studied showed a significant association with at least one domain of physical inactivity or sitting time and differed by gender, domain-specific physical inactivity and sitting time. The gender variations highlight the importance of understanding the conservative cultural norms which influence how men and women can be physically active.
Evidence from developed countries, most of which addresses leisure-time physical activity, indicates that older age is associated with being less active(Reference Bauman, Sallis and Dzewaltowski11, Reference Trost, Owen and Bauman12). However, evidence on overall levels of physical inactivity (which includes physical activity from all three domains) paints an inconsistent picture. There is an increase in physical inactivity with age in both developed and developing countries, particularly in men. On the other hand, inactivity does not vary with age in some rural populations in Asia(Reference Ng, Hakimi and Van Minh22), and in Ho Chi Min City, Vietnam, specifically(Reference Trinh, Nguyen and Dibley23). In some countries, such as New Zealand, both men and women in all age groups are, in general, physically active(Reference Bauman, Bull and Chey26). In the present study, older Omani women were less active in the work domain compared with their younger counterparts. One explanation for this may be that younger women may be carrying the double burden of both formal employment (i.e. in professions that require long periods of standing/walking such as teaching and nursing) as well as household/family responsibilities, unlike women over 40 years of age who generally are not part of the formal employment sector(27). That younger age is associated with transport inactivity among men in Sur City may be a reflection of the cohort effect with older men possibly being more accustomed to regular active transport, bearing in mind that widespread car ownership is a relatively recent phenomenon(Reference Al-Lawati and Jousilahti28).
Many studies from developed countries have reported that people with less education have higher odds of being physically inactive(Reference Bauman, Sallis and Dzewaltowski11, Reference Trost, Owen and Bauman12); such an association was seen only among men in our study. However, similar to age, global evidence on the associations of education with physical activity is inconsistent(Reference Ng, Hakimi and Van Minh22, Reference Bauman, Ma and Cuevas29). Studies in South-East Asia have found that those with less education are more active(Reference Ng, Hakimi and Van Minh22, Reference Trinh, Nguyen and Dibley23), highly educated individuals in China were less active during work and transport but more active during leisure compared with those less educated, but in the Philippines, Malaysia and Nauru there was no association between education and physical activity(Reference Bauman, Ma and Cuevas29). Given that the association of education with physical inactivity appears to be context specific, and due to some of the inconclusive findings for the Sur population, further research is needed to better understand this relationship in Oman.
One of the most interesting findings from the current study is that men and women who were not employed were at significantly higher odds of leisure inactivity; a finding seen in some developed countries(Reference Bopp, Wilcox and Laken30–Reference Slingerland, van Lenthe and Jukema32) but not others(Reference Shibata, Oka and Nakamura33, Reference Allender, Hutchinson and Foster34). In our study, those who were not employed were diverse (i.e. students, job seekers, housewives and retirees); barriers and supports for physical inactivity likely vary for each of these different groups. Thus, further research about the non-working population would be useful to shape appropriate public health interventions.
Associations of the other correlates identified in the present study (marital status, diet and BMI) have been reported elsewhere(Reference Bauman, Sallis and Dzewaltowski11, Reference Trost, Owen and Bauman12). Studies have noted the clustering of risk behaviours such as physical inactivity with low fruit and vegetable intake(Reference Bopp, Wilcox and Laken30, Reference Hausdorf, Eakin and Whiteman35) which suggests that public health interventions might target both behavioural risk factors together. The association of higher BMI with transport inactivity in men suggests that the promotion of physically active transport (such as the provision of sidewalks in residential areas to improve access to neighbourhood mosques and grocery stores) could be considered a potential obesity prevention/management strategy.
A unique contribution of the current study is the evaluation of the correlates of sitting time, an area with limited available evidence(Reference Owen, Sugiyama and Eakin13). The finding that younger women have higher sitting times than older women was seen in ten of eighteen countries in the International Prevalence Study (IPS)(Reference Bauman, Ainsworth and Sallis14) and in a study in Australia(Reference Salmon, Owen and Crawford36); however, a study in the USA showed that sedentary time increased with age for both men and women(Reference Healy, Clark and Winkler37). The result that more-educated men have higher sitting times than those less educated was also observed in fifteen of nineteen countries in the IPS(Reference Bauman, Ainsworth and Sallis14) but not in a study in Australia(Reference Salmon, Owen and Crawford36). Some of the other correlates identified in our study (employment status, smoking and BMI) have been reported to be associated with television viewing time in populations in Australia and the USA(Reference King, Goldberg and Salmon38, Reference Clark, Sugiyama and Healy39). Recent evidence indicates that the relevant correlates can vary depending on the type of sedentary behaviour(Reference Salmon, Owen and Crawford36, Reference King, Goldberg and Salmon38, Reference Clark, Sugiyama and Healy39); thus, further research on the correlates of domain-specific sedentary behaviours is required.
Although our study had a high response rate (80 %) and data were weighted to the Sur population, the generalizability of the results within Sur itself is limited by the fact that information regarding population clusters and non-respondents was not available at the time of analysis. Since the study was only of the adult population in Sur, generalizability nationally or to neighbouring countries may also be limited. The sample size – while not planned a priori for the research questions that we address – appears adequate for sitting time; either the sitting time findings showed a ‘significant’ correlate of sitting time or null results showed any sizeable association to be unlikely (i.e. confidence intervals always ruled out sizeable effects, defined as a twofold relative rate or odds ratio). For physical inactivity, larger samples are needed to ensure adequate power to provide definitive results, as null results were sometimes inconclusive, neither showing a significant association nor ruling out sizeable effects (here, a doubling/halving in odds). Given (i) that the GPAQ has not been validated for an Arab population(Reference Bull, Maslin and Armstrong19), (ii) the error associated with self-reported measures of physical activity and sitting time and (ii) that the Sur questionnaire does not explicitly provide guidance to the interviewee on potentially confusing phrases (i.e. ‘moderate-intensity physical activity’ and ‘sitting time’)(Reference Healy, Clark and Winkler37), it is possible that some people have been misclassified for domain-specific physical activity and that the reported sitting is over- or underestimated. The associations reported do not denote causality owing to the cross-sectional nature of the study.
Measurement limitations need to be addressed in order to improve population-based surveys in Arab countries. For example, the GPAQ, which is a part of the STEPwise instrument, has been tested for validity in some developed countries but not with Arab populations. Device-based measurement would be preferable, but has not yet been used in population-based surveys in the Arabian Gulf region. Given that the WHO STEPwise approach has been used in several Arab countries, it appears to be the best option available at this time.
Conclusions
The present study is the first to report on the correlates of physical inactivity and sitting time for a population-based survey in the Arabian Gulf. Key population demographic subgroups with a particularly high prevalence of physical inactivity were men and women who were not employed, women aged ≥40 years, men aged 20–29 years and men who were married; those with high mean levels of sitting time were women aged 20–29 years, women who were not working and men with post-secondary education. Further information regarding the barriers and supports for these behaviours, particularly for the high-risk demographic groups, is required to shape public health policy and programme interventions. BMI had associations only with transport inactivity in men and sitting time in women, pointing to the need to explore the possibility of active transport and reductions in sitting time as potential obesity prevention/management strategies for this population. With over half of the population of Sur City and nearly three-quarters of non-working women doing no leisure-time physical activity at all, promotion of leisure-time physical activity is an important goal.
These findings can help to inform the targeting of public health interventions to reduce physical inactivity and sitting time. Given the varied patterns of associations by gender and by work, transport and leisure physical activity, public health interventions may need to be gender specific and focus on domain-specific physical activity, such as establishing gender-segregated exercise facilities to promote leisure-time physical activity among women and building walker-friendly neighbourhoods to promote transport physical activity among men. Because of the high prevalence of overweight/obesity in Oman and the Arabian Gulf(Reference Al-Lawati and Jousilahti28, Reference Ng, Zaghloul and Ali40), promoting physical activity, particularly among high-risk groups, is a priority. Since continued socio-economic development in Oman may lead to increases in work and transport inactivity and more prolonged sitting time, creating activity-supportive environments is an important population health strategy.
Acknowledgements
E.A.H.W., E.G.E., M.M.R. and N.O. are supported by Programme and Fellowship Grants from the National Health and Medical Research Council of Australia and by Research Infrastructure funding from Queensland Health. N.O. is also supported by Research Infrastructure funding from the Victorian Government. The authors declare to have no conflicts of interest. R.M.M. carried out the secondary analysis and writing of the manuscript; E.G.E. supervised the manuscript writing and manuscript editing; E.A.H.W. supervised the statistical analysis and editing of the Methods and Results sections of the manuscript; M.M.R. assisted with the statistical analysis and manuscript writing; N.O. assisted with the manuscript writing and manuscript editing. The authors thank the Director General of Health Service, A'Sharqiyah Region, Ministry of Health, Oman and those involved with the Sur Healthy City Project for their willingness to share their data.


