


Introduction
Long ice-core records from Vostok, EPICA Dome C, Dome F and other sites in Antarctica, as well as GRIP, GISP2, NorthGRIP and other sites in Greenland, provide detailed archives of natural climate change. They highlight, in particular, the close linkages between climate and greenhouse gas concentrations over the last eight glacial–interglacial cycles (Reference Martin and PeelPetit and others, 1999; Reference Goujon, Barnola and RitzJohnsen and others, 2001; EPICA community, 2004). The International Partnership in Ice Core Sciences (http://www.pages.unibe.ch/science/initiatives/ipics/documents.html) is planning future ice-coring activities, with the completion of major projects in Greenland and Antarctica over the next 15 years (Reference Brook, Wolff, Dahl-Jensen, Fischer and SteigBrook and others, 2006). One of the major objectives of the International Partnerships in Ice Core Sciences (IPICS) is to obtain a deep ice core in Antarctica that extends through the mid-Pleistocene transition (MPT), roughly 700–1250 ka (Reference ClarkClark and others, 2006), a time period when Earth’s climate shifted from a 41 000 year to a 100 000 year glacial– interglacial cycle. This transition has been recorded in marine sediments, and may have occurred due to changes in atmospheric greenhouse gas concentrations (Reference QinRaymo and Ruddiman, 1992). Because ice cores record past greenhouse gas concentrations, the recovery of a core spanning this time period would allow one of the hypotheses of the MPT to be tested.
Dome Argus (Dome A), the summit of the East Antarctic ice sheet, is a point of international interest because of its potential for providing a very long and undisturbed ice-core paleoclimate record (Fig. 1). Yet no in situ surveys of this site had been made until the 21st Chinese National Antarctic Research Expedition (CHINARE-21) visited Dome A in the 2004/05 austral summer. Here we present the preliminary results from these investigations. These results will be useful not only for planning any future ice coring, but also for understanding the meteorological and glaciological characteristics of this data-sparse area of the Antarctic ice sheet.

Fig. 1. Location of Dome A and other deep ice-coring sites along the ice divide of East Antarctic (IDEA). The distribution of modeled age (ka) of the basal ice at 98.5% relative depth is from P. Huybrechts (personal communication, 2007) using the model of Reference Raymo and RuddimanRybak and Huybrechts (2003).
Measurement of Site Characteristics at Dome A
Studies at Dome A during CHINARE-21 included: (1) deployment of an automatic weather station (AWS) measuring meteorological characteristics including snow accumulation rate; (2) a radio-echo sounding (RES) survey to detect internal ice layers and ice thickness; (3) recovery of a 110 m ice core; (4) sampling in a 2.3 m deep snow pit for determination of snow chemical content and recent snow accumulation rate; and (5) a global positioning system (GPS) survey to determine ice-flow rates and to map surface topography.
The surface topography of the summit region of Dome A was measured by real-time kinematic GPS survey. The position of the summit was determined as 80˚22'01.6" S, 77˚22'22.3" E at 4092.5ma.s.l. (Reference Van den BroekeZhang and others, 2007). The survey defined the topography in the region of the Dome A summit. The lowest surface elevation within the 30 km×30km survey area (with more than 1000 surveyed points) was 4090.2 m, giving an elevation range of only 2.7 m over the entire area. The surface slope in the summit area is <0.009%, indicating a very flat and smooth surface. Although repeat GPS measurements to determine the surface flow rate have not yet been made, flow rates are low in the flat inland polar summit regions, and a repeat GPS survey at a site 25 km from Dome C yielded an ice-flow rate of 0.2ma–1 (Reference Cafarella, Urbini, Bianchi, Zirizzotti, Tabacco and ForieriCafarella and others, 2006). We expect similarly low values near Dome A.
The AWS deployed at Dome A by CHINARE-21 was designed and built by the Australian Antarctic Division. It takes hourly measurements of air temperature and wind speed (both at nominal heights of 1, 2 and 4m above the surface), wind direction, atmospheric pressure, relative humidity, incoming solar radiation, surface snow height and subsurface firn temperatures at 0.1, 1.0, 3.0 and 10m depths. Data are relayed via the Argos system on the US National Oceanic and Atmospheric Administration (NOAA) satellites. More than 2 years of data have been received from this AWS. The AWS sensor specifications are listed in Table 1.
Table 1. Specifications for the AWS at Dome A

Snow surface height (SSH) was measured every hour with a Campbell Scientific SR50-45 ultrasonic distance sensor mounted on the 4 m arm of the AWS. The sensor has a field of view of approximately 22˚, and measures the distance to the closest object within this field of view (e.g. the top of the snow surface) with a resolution of 0.02 m. Total snow accumulation is calculated as the difference between the original installed height of the sensor above the surface and subsequent measured distances.
Two RES systems, with frequencies of 179 and 60MHz respectively (Fujita and others, 1999), were used to detect the internal ice layers and ice thickness along the 1228 km traverse line from Zhongshan station to Dome A, as well as within an area of 30km×30km around Dome A. An ice thickness of approximately 3050m was located at 80˚25'37.2" S, 77˚11'58.9" E. More detailed RES data will be reported elsewhere (personal communication from B. Sun, 2007).
A 110m long ice core was recovered from the summit of Dome A. Firn density was measured in situ, and in some samples δD, particle concentration and CH4 were measured in laboratories on our return from Antarctica. Samples from a snow pit were measured for chemistry, and to detect atmospheric bomb test horizons (1954–65) from gross β activity. These measurements, discussed below, support accumulation estimates and an understanding of snow densification.
Results and Discussion
Meteorological features at Dome A
Air temperature
At sites on the interior Antarctic ice sheet, the firn temperature at 10m depth is nearly constant and has only a slight seasonal fluctuation. Hence, in the dry snow zone where there is no melt or refreezing, the 10m firn temperature approximates the annual mean air temperature near the surface (Reference Lythe and VaughanMartin and Peel, 1978; Reference PetitQin, 1987; US National Snow and Ice Data Center, http://nsidc.org/data/docs/agdc/thermap/documentation.html). The measured 10m firn temperature at Dome A was –58.3˚C in 2005 and –58.2˚C in 2006 (Fig. 2), and the monthly deviations from the mean are less than 0.2˚C. During the in situ investigations at Dome A in January 2005, two portable thermometers (produced in China and Japan) were used to measure the 10m firn temperature in a borehole over a 24 hour period. They both recorded –58.3˚C, consistent with AWS records in 2005 and 2006.
Fig. 2. Monthly means of air and firn temperatures recorded by the AWS at Dome A in 2005 (a) and 2006 (b). AiT1, AiT2, AiT4 and SST10 represent air temperature at 1, 2 and 4m heights and subsurface temperature at 10m depth respectively.
Strong surface air-temperature inversions, consistent with the low wind speed at Dome A, were identified. These averaged 1.1˚C between 1 and 2m height, and 1.5˚C between 2 and 4m height, over the 2005–06 period (Fig. 2). The inversion strength reached much higher values for short periods during winter months, and it was not unusual for the air temperature 1m above the surface to be more than 10˚C lower than the temperature 2m above the surface. The annual average air temperature for the 2005–06 period at 1m height was –53.0˚C, considerably higher than the firn temperature (Fig. 2). A considerable difference between the air temperature and 10m firn temperature was also seen at other Antarctic summit sites, and, although the Dome A difference is exceptionally large, it is in inverse proportion to the wind speed at this site compared with others. For 2005– 06 the average air temperature at Dome A was higher than the long-term mean at Vostok, (–53.0˚C) even though the latter site is 600m lower. We are not sure at this stage whether this is just a function of the short record available for Dome A, or whether it is a feature of the large-scale atmospheric circulation over the ice sheet.
Snow surface height
The 2 years of Dome A SSH measurements, after correction for ambient temperature and quality-control checks, are shown in Figure 3. Seasonal SSH variations recorded by the AWS provide information on the variability of net snow accumulation (e.g. Reference QinQin and others, 2004).
Fig. 3. Daily cumulated snow surface height (snow accumulation) in 2005 and 2006 recorded by the AWS at Dome A.
In both 2005 and 2006 the SSH records were most variable in winter (mid-April to end of September), and the short-term changes at these times (both accumulation and ablation events) were far greater than recorded in warmer months. We suspect this was a result of a problem with the sensor operation in the extremely low winter temperatures at Dome A (typically between –50˚C and –80˚C). We have edited these data from the record. The SSH measurements are stable in the warmer months and consistent over the 2 years of record. In both 2005 and 2006 there was little snow accumulation from January through mid-April, and the major accumulation period was between October and December. The net accumulation in 2005 was 11 cm of snow, while in 2006 it was 5 cm of snow. We estimate the density of the surface snow at Dome A as <0.2 g cm–3. Hence the net accumulation rate averaged over the 2 years was 1–2cmw.e. a–1.
Air pressure and wind
Air pressures along the ice divide of East Antarctica (IDEA) are compared for the year 2005 (Fig. 4). Data at other sites along IDEA were obtained through the routine operational meteorological data exchange of the World Meteorological Organization’s Global Telecommunication System (GTS). Monthly average air pressure at Dome A ranges between 570 and 592 hPa, with an annual mean value of 574 hPa. The annual mean air pressures at Dome C and Vostok are 645 and 624 hPa respectively. Air-pressure data for Dome F in 2005 are available only for 22 days in January. The average for this period was 611 hPa. Although the seasonal variations of air pressure at all these sites show a ‘summer-high/winter-low’ pattern, a secondary high appears in mid-June. The Antarctic atmosphere is cold and dry. There is a strong horizontal temperature gradient between the continent and the ocean, and a strong vertical temperature gradient (inversion) as a result of the intense radiative cooling during winter. For this reason, near-surface temperatures are particularly sensitive to low-level atmospheric circulation (Reference Siegert, Carter, Tabacco, Popov and BlankenshipVan den Broeke, 2000). The circumpolar trough of low pressure around Antarctica undergoes a strong semi-annual oscillation in strength and position. It is deepest and closest to the continent in the equinoctial months of March and September and this strongly impacts the seasonal variation of pressure at Antarctic coastal regions. The effect is weaker at high inland sites, but still present as seen in Figure 4.
Fig. 4. Monthly average air pressure at several sites along IDEA in 2005. Note that the January value for Dome F is the average over 22 days.
Wind speed at Dome A in most seasons is <3ms–1, and seldom greater than 5 ms–1 (Fig. 5). Low wind speeds also occur at other sites along IDEA, with a tendency for lower wind speeds at the higher sites, and higher wind speeds at lower sites (Fig. 5). But it is clear that the altitude is not the only factor determining wind speed along IDEA. Wind speed at Vostok is the highest among the four sites, yet its elevation is not the lowest; local topography is also an important factor determining surface wind along the ice divide.
Fig. 5. Wind speed in 2005 for some locations along IDEA. Wind direction at Dome A in 2005 is also shown.
There is no strong prevailing wind direction at Dome A (Fig. 5). Southerly winds account for 23%, easterlies for 18%, southeasterlies for 10% and north-northwesterlies for 8%. The fact that there is no dominant wind direction suggests that, because Dome A is a summit region, a roughly symmetrical outflow of surface air is generated by the inflow occurring higher in the atmosphere.
Glaciology
Densification processes
A 110 m ice core was recovered at Dome A, and the density of this core was measured in situ using the weight–volume method. A total of 133 density values were obtained, primarily to determine the approximate depth where air-bubble close-off occurs. The density profile is shown in Figure 6, with the section of the ice core where the density varies between 0.81 and 0.85 g cm–3 shown in greater detail. Close-off depth was also deduced from 25 CH4 measurements made on core samples from 86.5–110m depth, and supported by diffusive column height estimates using δ15N of N2. These show that
Fig. 6. Snow density profile along the 110m firn core from Dome A. Densities at close-off depth, varying between 0.81 and 0.85 g cm–3, are shown in detail in the inset.
Using the temperature at Dome A (–58.3˚C), we can calculate the diffusive column height (DCH) given by δ15N:
where R is 8.314, T is the annual mean air temperature (K) and g is the gravitational acceleration (9.81ms–2). The DHC value is in very good agreement with the observed close-off depth of approximately 90–100 m, and suggests the absence of a convective zone.
Snow accumulation rate estimated from reference horizons
From the 2 years of AWS data discussed above, we estimate an accumulation rate of 0.01–0.02mw.e. a–1. Detection of the 1954 atmospheric atomic bomb test horizon from beta activity and of the 1991 Pinatubo (Philippines) eruption from trace chemicals (non-sea-salt sulphate) in samples collected from a Dome A snow pit (Fig. 7) provide an estimated mean accumulation rate between 1954 and 2005 of 0.023mw.e. a–1, in broad agreement with the AWS records. However, from the Pinatubo marker we estimate an average accumulation rate of around 0.034mw.e. a–1 for the 1992– 2005 period, considerably greater than the 1965–2005 mean. This suggests that the Dome A accumulation may be quite variable at decadal scales.
Fig. 7. Nuclear test and Pinatubo eruption events detected in a Dome A snow pit.
Figure 8 shows contours of close-off depth on a plot of accumulation rate vs temperature for the Arnaud densification model (Reference Arnaud, Barnola, Duval and HondohArnaud and others, 2000). The location of Dome A in this figure suggests an accumulation rate of 0.01– 0.02mw.e. a–1. We ran the LGGE (Laboratoire de Glaciologie et Géophysique de l’Environnement) firn densification model (Reference FujitaGoujon and others, 2003) with a surface temperature of –58.3˚C and different accumulation rate scenarios, until a good match was obtained with the Dome A firn density profile measured in the field. The best match is obtained with a very low accumulation rate of 1.25–1.5cmw.e. a–1. Such a low accumulation rate is comparable to the expected Last Glacial Maximum accumulation rates for Dome C and Vostok.
Fig. 8. Arnaud densification model based on the mean annual air temperature and surface snow accumulation rate. The contours represent the close-off depth.
Concluding Remarks
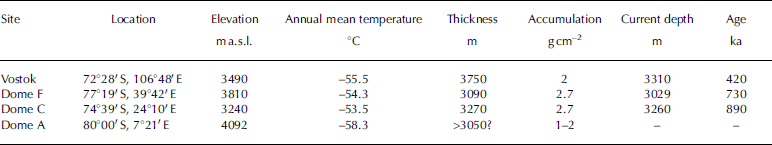
The major criteria for a site for retrieval of the longest possible ice-core record are (1) deep ice, (2) low accumulation rate, (3) a summit with low horizontal ice velocity, and (4) a frozen base or low geothermal heat flux. Although we have no solid values for the heat flux beneath Dome A, no subglacial lakes or drainage systems have been detected here, suggesting that it is probably cold-based (Reference Rybak and HuybrechtsSiegert and others, 1996, Reference Siegert and Dowdeswell2005; Reference JohnsenLythe and others, 2001). Although melting occurs beneath other summits along IDEA, the geothermal heat flow may have large spatial variations (Reference Dahl-Jensen, Mosegaard, Gogineni and MillerDahl-Jensen and others, 2003) and there may be no melting under Dome A, where the bedrock is structurally (and probably geologically) different. The preliminary results from CHINARE-21 show that the Dome A area satisfies some of the core-site criteria, and it may be an ideal site to seek records extending back to at least 1 Ma. In Table 2, we present the parameters of the major ice-coring sites in Antarctica and compare them with Dome A to show why this site is special.
Table 2. Characteristics of ice-coring sites along IDEA
Further field-site survey studies are needed at Dome A to select an optimal drill site in the region. Comparative studies should also be made in other areas to determine the best overall location in Antarctica for retrieving a very old ice core. The International Polar Year (IPY) 2007–08 is initiating a new era in polar science, involving a wide range of research disciplines (Reference AllisonAllison and others, 2007). The Prydz Bay–Amery Ice Shelf–Zhongshan–Dome A (PANDA) program is an endorsed project for IPY 2007–08. PANDA plans to undertake further site investigations at Dome A, including measurements of ice flow, ice thickness, densification processes and borehole/surface characteristics over a wider area around the dome. With the completion of PANDA and other related activities during IPY, scientists will have more detailed information for deciding the best location for deep ice-core drilling.
Acknowledgements
All members of inland traverses during CHINARE-21 are thanked for the coordinated fieldwork. This study is supported by the National Natural Science Foundation of China (NSFC: 40620120112), Chinese Academy of Sciences (CAS: KZCX3-SW-354) and the Hundred Talent Projects of CAS. This work was also supported by the Australian Government’s Cooperative Research Centres (CRC) Program through the Antarctic Climate and Ecosystems CRC.


