


In many Western societies, type 2 diabetes affects 5–8 % of the population with an associated burden on health resources( 1 ). This incidence is associated, in part, with the increase in global obesity, as approximately 80 % of people with type 2 diabetes are overweight or obese( 1 ). The transition to, and onset of, type 2 diabetes is characterised by insulin resistance( Reference Defronzo and Tripathy 2 ), and in both people who have developed diabetes and those in a ‘pre-diabetes’ state altered lifestyle including exercise and/or weight loss can improve glycaemic control( Reference Helmrich, Ragland and Leung 3 – Reference Krebs, Browning and McLean 5 ). Nonetheless, continued compliance with such interventions is often unsatisfactory and other interventions have been sought.
One approach involves supplementation with long-chain n-3 PUFA, notably EPA and DHA, found in fish and other marine oils( Reference Bergeron, Julien and Davis 6 , Reference Zhu, Liu and Chen 7 ). Their potential benefit was noted several decades ago in Alaskan Inuit who had a low prevalence of type 2 diabetes even when obese( Reference Mouratoff, Carroll and Scott 8 , Reference Mouratoff and Scott 9 ) – a feature lost when they adopted a non-traditional lifestyle( Reference Murphy, Schraer and Thiele 10 ). The role of long-chain n-3 PUFA was supported by rodent studies where supplementation with n-3 PUFA ameliorated the insulin resistance caused by a diet rich in SFA( Reference Storlien, Kraegen and Chisholm 11 ). Nonetheless, supplementation of human diets with n-3 PUFA has produced inconsistent outcomes, with a few studies reporting positive outcomes( Reference Ramel, Martinez and Kiely 4 , Reference Popp-Snijders, Schouten and Heine 12 – Reference Rasic-Milutinovic, Perunicic and Pljesa 15 ), but with these counterbalanced by other publications that showed negative responses( Reference Glauber, Wallace and Griver 16 – Reference Mostad, Bjerve and Bjorgaas 20 ). In practice, however, the majority of studies reported show either a null or mixed outcome( Reference Krebs, Browning and McLean 5 , Reference Giacco, Cuomo and Vessby 21 – Reference Smith, Atherton and Reeds 37 ). On the basis of such variable outcomes, it is not surprising that a meta-analysis of the available literature data concluded that there was no benefit of fish oil (FO) supplementation, at least in terms of aspects of glycaemic control( Reference Akinkuolie, Ngwa and Meigs 38 ).
The reason for these inconsistent outcomes of FO supplementation in humans may have a basis from more recent studies in farm species where responses in both glucose and protein metabolism were not observed until a threshold phospholipid enrichment in tissue membranes was achieved( Reference Gingras, White and Chouinard 39 , Reference Fortin, Julien and Couture 40 ). Such membrane phospholipid enrichments may not be attained in many of the human studies where either low doses of FO and (or) short intervention periods were employed, and therefore may not achieve values associated with positive health outcomes( Reference Flock, Harris and Kris-Etherton 41 ). Interestingly, recent studies in humans have reported that FO supplementation may impact on muscle protein synthesis over relatively short timescales (8 weeks( Reference Smith, Atherton and Reeds 37 , Reference Smith, Atherton and Reeds 42 )), which might indicate differences in insulin sensitivity between glucose and protein metabolism.
Therefore, the present study was based on a dose of n-3 PUFA (3·9 g/d) that is between the upper safe limit recommended in the USA (3 g/d)( 43 ) and Europe (5 g/d)( 44 ) and supplied over a 9-month period to older subjects with impaired glucose regulation. The primary outcome was to assess whether this supplementation improved insulin sensitivity in terms of glycaemic control. The secondary outcome was to examine whether the supplementation altered whole-body protein metabolism. A pilot study was also conducted to investigate whether n-3 PUFA enrichments in membranes of erythrocytes provided good surrogate markers of the phospholipid content in skeletal muscles.
Methods
Subjects and study design
Male and post-menopausal female Caucasian subjects were considered eligible for the study if aged between 40 and 61 years and had at least one of the following: impaired fasting glucose (fasting plasma glucose 6·1–6·9 mmol/l); impaired glucose tolerance (plasma glucose 7·8–11·1 mmol/l following a 2 h 75 g oral glucose tolerance test); type 2 diabetes mellitus newly diagnosed as a result of screening for this study but with HbA1c <53 mmol/mol (7 %) and fasting plasma glucose >5·5 mmol/l but not requiring hypoglycaemic therapy. Exclusion criteria were diabetes requiring hypoglycaemic therapy, use of anticoagulants, alcoholism, hepatic or renal failure, anaemia, CVD or respiratory disease, malignancy, epilepsy, regular steroid or non-steroidal anti-inflammatory drug treatment plus any objections raised by the volunteer’s general practitioner. Medication with stains was not an exclusion criterion. Recruitment was under the supervision of the first author (L. F. C.), a Specialist Registrar in diabetes care.
A total of 108 subjects were approached after the screening procedure. Of these, fifty-one did not respond, whereas another seventeen did not meet eligibility criteria. Those who were eligible (n 40) then elected to undergo at the start and end of the interventions either measures of insulin sensitivity (n 36), based on the hyperinsulinaemic–euglycaemic–euaminoacidaemic (HIEGEAA) clamp procedure, or instead provide muscle biopsies (n 4) for a pilot trial. This study was conducted according to the guidelines laid down in the Declaration of Helsinki. The trial was registered (NCT01241474; https://clinicaltrials.gov/) and ethics approval was obtained from the North of Scotland Research Ethics Committee. All the subjects gave their written informed consent. Three subjects withdrew from the clamp cohort for various reasons: development of type 2 diabetes mellitus requiring oral hypoglycaemic therapy (one volunteer), vasovagal event during the first HIEGEAA clamp (one volunteer) and general health deterioration (one volunteer). These occurred at or after the first clamp, and all the data obtained were excluded, with n 17 remaining in the MO cohort and n 16 in the FO cohort. One volunteer withdrew from the muscle biopsy cohort following discomfort from the first procedure.
Design and treatments
At enrolment, volunteers underwent a 2-month introductory period with the dietary n-3:n-6 ratio standardised to 1:6 by supply of oils for cooking and dressings (soya:sunflower oils used in a 3:1 ratio) and a spread (Flora Buttery™). Volunteers continued to use these oils and spread throughout the study. Height and weight were measured at enrolment as was RMR determined by indirect calorimetry as described previously( Reference Johnstone, Horgan and Murison 45 ). Body composition was determined by air-displacement plethysmography (BOD POD®, Body Composition System, Life Measurement Instrument) at the beginning and end of the study( Reference Johnstone, Horgan and Murison 45 ). These procedures were carried out at the Human Nutrition Unit of the Rowett Institute of Nutrition and Health.
The daily n-3 PUFA supplement contained 6 g of FO (menhaden, Pacific herring) as 6×1 g of EPAX 6000 TG (EPAX AS). Although the nominal content of EPA+DPA in the oil was 50 %, the actual composition of the 6000T batch included EPA 39·8 %, DPA 3·6 %, DHA 25·5 % and α-linolenic acid 2·8 % when assessed by GC. The actual daily intake of EPA plus DHA (3·9 g/d) was therefore above the safe limit (3 g/d) recommended by the US Food and Drug Administration( 43 ) but within the 5 g/d set by the European Food Safety Authority( 44 ). The control supplement consisted of maize oil (MO, 6×1 g capsules daily) also supplied by EPAX and contained <2 % EPA plus DHA.
In order to match the treatment groups for the clamp cohort, the initial volunteers after their first HIEGEAA clamp were randomly assigned to either FO or MO treatments via a double-blind procedure, using a computer-generated randomisation list and supervised by an independent statistician. If a subsequent volunteer of the same sex required an infusion rate of glucose (mg/min per kg fat-free mass (FFM)) during the 3rd hour of the clamp within 25 % of that of an unpaired earlier volunteer, they were paired together and given the alternative oil as the treatment. For the last three volunteers, this closeness of fit based on glucose infusion rate was not achieved (difference>25 %), and thus alternative criteria of amino acid disposal and body composition were used to complete one pairing while the other remained unpaired. Capsules of the two oils were identical in outward appearance and were provided via the double-blind procedure in similar containers labelled sequentially under the supervision of an independent nutritionist. Neither volunteers nor researchers knew which treatment was allocated.
Each month, subjects attended the Rowett Institute of Nutrition and Health for review. They completed a brief health questionnaire, received new oil capsules, were weighed and overnight fasted blood samples were collected and subsequently separated into erythrocytes and plasma, with portions of each stored at −8°C for further analyses.
Hyperinsulinaemic–euglycaemic–euaminoacidaemic clamp and biopsy procedures
The thirty-three volunteers (twenty men and thirteen women aged 51–69 years) underwent two HIEGEAA clamps in the Department of Diabetes, Aberdeen Royal Infirmary, Aberdeen, UK. The first was after the 2-month introductory period and the second after 9 months of oil supplementation. Dietary recommendations were given for the 3 d before the clamps, standardised for both quantity (1·5×RMR) and macronutrient composition (52 % carbohydrate, 15 % protein and 33 % fat).
After an overnight fast (from 19.00 hours the day before), subjects were cannulated in a dorsal hand or wrist vein (retrograde, for sampling) and in an antecubital vein (antegrade, for infusions using a three-way tap) of the contralateral arm. The blood samples were ‘arterialised’ by placing the hand in a warm blanket (Dreamland Thermo Therapy Heatpad). Before infusions, four background samples were obtained at 5-min intervals to determine baseline glycaemia. Volunteers then received a prime dose of 7·8 mg/kg FFM d-[6,6-2H2] glucose and 0·076 mg/kg FFM per min l-[1-13C] leucine followed by a 2-h infusion of 0·075 mg/kg FFM per min d-[6,6-2H2] glucose and 0·0126 mg/kg FFM per min l-[1-13C] leucine. During the last 30 min of infusion, six plasma samples were obtained at 5-min intervals and concentrations of glucose (glucose oxidase method; Yellow Springs Instrument) and plasma branched-chain amino acids (BCAA)( Reference Beckett, Hardin and Davis 46 ) were determined. Portions of plasma were also stored at −80°C for subsequent analyses of glucose and leucine oxo-acid enrichments.
Immediately after this 2-h infusion, the 3-h hyperinsulinaemic clamp was initiated. First, 21 units of insulin (Human Actrapid; Novo Nordisk) was mixed in 56 ml 0·9 % saline and 4 ml of the subject’s plasma in a syringe and delivered through a syringe pump (Graseby Medical Ltd). The infusion rate was based on body surface area and set at 160 mU/m2 per min for 4 min, then 80 mU/m2 per min for 4 min and finally maintained at a rate of 40mU/m2 per min for the next 172 min. Euglycaemia (±5 % of fasting glucose concentration or at 5·5 mm if fasting concentration was >5·5 mm) and euaminoacidaemia (±10 % fasting BCAA concentration) were maintained during the clamp procedure by separate variable rate infusions of 20 % dextrose (Fresenius Kabi) enriched to 3 mole percent excess (MPE) with d-[6,6-2H2] glucose (Cambridge Isotope Laboratories Inc.) and vamin 14 (Fresenius Kabi) enriched to 5 MPE with l-[1-13C] leucine (Cambridge Isotope Laboratories Inc.). Vamin 14 is a mixture of amino acids (total 694 mmol/l) used for parenteral infusions and contains nine non-essential amino acids and all nine essential amino acids, including (mmol/l) isoleucine (31·8), leucine (44·9) and valine (46·5). Approximately 1 ml of blood was obtained every 5 min during the clamp to monitor plasma glucose and BCAA concentrations. Adjustment was based on experience and, in the case of glucose, with the aid of an algorithm( Reference Defronzo, Tobin and Andres 47 ).
During the last hour of the clamp, nine plasma samples were obtained (at 125, 135, 145, 155, 160, 165, 170, 175 and 180 min) and frozen at −80°C for later hormone and isotope enrichment analyses. During clamp 2 (post-supplementation), the glucose was maintained at the same concentration used for clamp 1 (pre-supplementation), whereas the BCAA were clamped at the fasting concentrations for the day.
For the muscle biopsy procedure, volunteers were treated similarly to those who underwent the clamp procedure with blood samples withdrawn at each of the monthly visits and with muscle biopsies taken after the 2-month introductory period and again after 9 months of FO supplementation. Muscle biopsies (300 mg) were obtained from the Vastus lateralis using the semi-open technique( Reference Henriksson 48 ), which involved local anaesthesia, a skin incision and muscle removal using alligator forceps (Weil-Blakesley conchotome); the samples were then frozen in liquid nitrogen and stored at −80°C.
Sample processing and analyses
Membrane phospholipids were extracted from the tissue (erythrocyte or muscle) using chloroform and methanol, with butylated hydroxytoluene present to prevent oxidation of fatty acids, and then separated by TLC( Reference Bligh and Dyer 49 ) and analysed by GC (as methyl ester derivatives). In total, fourteen peaks were present for all the chromatograms and these were summed to estimate total and proportional fatty acid concentrations.
Concentrations of inflammatory IL-1β, IL-6) and cardiovascular markers (soluble intracellular adhesion molecule and soluble vascular adhesion molecule) were analysed using a multiplex system (Millipore Corporation), and high sensitivity C-reactive protein (hsCRP) level was determined using a commercially available kit on a Konelab30 selective chemistry analyser (Thermo Fisher Scientific). Insulin and C-peptide concentrations were measured in duplicate using ELISA (Mercodia). Plasma lipid profiles were analysed using commercial kits on the Konelab30.
Enrichment (as tracer:tracee ratios) of d-[6,6-2H2] glucose was determined as the penta-acetate derivative( Reference Lobley, Holtrop and Bremner 50 ), whereas enrichments of l-[1-13C] leucine and l-[1-13C] 4-methyl-2-oxo pentanoic acid (MOP) were quantified as described previously( Reference Calder and Smith 51 ).
Calculations
Fasted endogenous glucose production (EGP) was calculated based on tracer dilution and a standard steady-state model( Reference Finegood, Bergman and Vranic 52 ), with values for the last 20 min of collection used, where a temporal change of only +1 % in glucose tracer:tracee was observed over this period (0·0316 v. 0·0319; P<0·001), with no significant effect of type of oil and month of oil×month interaction. During normal high-insulin-euglycaemic clamp procedures, plasma amino acid concentrations decline and this may induce confounding metabolic effects that are avoided by the HIEGAA procedure( Reference Barazzoni, Kiwanuka and Zanetti 53 ). In addition, the amount of amino acid infused to maintain euaminoacidaemia provides a measure of the sensitivity to the insulin challenge( Reference Smith, Atherton and Reeds 37 , Reference Gingras, White and Chouinard 39 , Reference Barazzoni, Kiwanuka and Zanetti 53 ), analogous to the situation with glucose. The dual clamp procedure requires separate calculations for glucose and amino acid (leucine) kinetics. During the last 60 min of the HIEGEAA clamp, glucose kinetics were determined based on Steele’s model( Reference Steele 54 ) for non-steady-state conditions with rate of appearance (Ra) in plasma calculated using a previously published model( Reference Finegood, Bergman and Vranic 52 ):
 $${\rm Ra}(t)={\equals}{I \over {{\rm SAp(}t{\rm )}}}{\minus}{{{\rm pVG}(t)} \over {{\rm SAp}(t)}}{{{\rm dSAp}(t)} \over {{\rm d}t}}{\plus}{\rm SAg}{{{\rm GINF}(t)} \over {{\rm SAp}(t)}}{\minus}{\rm GINF}(t)$$
where I is the rate of infusion of d-[6,6-2H2] glucose (mmol/min), pV is pool size=0·65×0·25×body weight based on analysis of similar subjects( Reference Lobley, Holtrop and Bremner 50 ), G(t) is the plasma glucose concentration (mmol/l), dSAp(t)/dt is the rate of change in plasma enrichment of d-[6,6-2H2] glucose (mmol/l per min), SAg is enrichment of infusate (d-[6,6-2H2] glucose mmol/l) and GINF(t) is the exogenous glucose infusion rate (mmol/min). Rates of disappearance (Rd) were calculated using the same model approach( Reference Finegood, Bergman and Vranic 52 ) with allowance for changes in pool sizes as follows:
 $${\rm Rd}\left( t \right)={\equals}{I \over {{\rm SAp}\left( t \right)}}{\minus}{{{\rm pV}\,{\rm G}(t)} \over {{\rm SAp}(t)}}{{{\rm dSAp(}t{\rm )}} \over {{\rm d}t}}{\plus}{\rm SAg}{{{\rm GINF}(t)} \over {{\rm SAp(}t{\rm )}}}{\minus}{\rm pV}{{{\rm dG}(t)} \over {{\rm d}t}}$$
where ${\rm pV}\,{\rm dG(}t{\rm )\,/\,d(}t{\rm )}$
is the rate of change in plasma glucose concentration (mmol/l per min). During the clamp procedure (insulin infusions), residual (non-suppressed) EGP was calculated as Ra minus infused glucose.
${\rm pV}\,{\rm dG(}t{\rm )\,/\,d(}t{\rm )}$
is the rate of change in plasma glucose concentration (mmol/l per min). During the clamp procedure (insulin infusions), residual (non-suppressed) EGP was calculated as Ra minus infused glucose.
Protein (leucine) dynamics were estimated using a steady-state stochastic model with MOP chosen as the precursor pool( Reference Matthews, Schwarz and Yang 55 ) by the following equation:
 $${\rm Rd{\equals}}={{{\rm Infusion}\,{\rm rate}\,{\rm of}\,{\rm labelled}\,{\rm leucine(\rmu mol\,/\,kg}\,{\rm FFM}\,{\rm per}\,{\rm min)}} \over {{\rm tracer\,\colon\,tracee}\,{\rm ratio}\,{\rm MOP}\,{\rm in}\,{\rm plasma}}}$$
In the fasted state, Rd represents whole-body protein breakdown (WBPB). During the HIEGEAA clamp, the Rd of leucine represents the sum of leucine infused (quantified from the vamin 14 infusion) plus endogenous WBPB as altered by the infused insulin. Although at steady state Rd equals the Ra, the latter could not be resolved into the two components of oxidative and non-oxidative (synthesis) rates. The homoeostatic model assessment of insulin resistance and β-cell reserve were calculated using an online calculator( 56 ).
Statistical analysis and power calculations
The primary outcome was altered insulin sensitivity and glycaemic control based on the HIEGEAA clamps. From literature sources, the between-subject spread was estimated as 15 %, so that a minimum of 12–16 volunteers were required per arm to detect an improvement of 18–20 % in insulin sensitivity for glucose metabolism at a power of 90 % for the 5 % significance level. The secondary outcome was change in whole-body leucine Rd, and based on our own and literature data the between-subject spread was 10 %, and thus to detect a 15 % change at a power of 90 % for the 5 % significance level would require only nine subjects per group. For the pilot study, to look at differences between muscle and erythrocyte phospholipid contents, a 20 % difference was detected at a power of 90 % for the 5 % significance level with four subjects based on 8 % within-subject spread. Following initial recruitment, thirty-six volunteers were selected and paired between treatment arms on the basis of the amount of glucose infused during the 3rd hour of the HIEGEAA clamp. Three volunteers did not complete the study, and thus the final data were analysed as sixteen pairings with one unpaired subject (blind allocation to MO).
Data were analysed by fitting a mixed model using residual maximal likelihood with the statistical package GenStat (13th edition release 13.1, VSN International Ltd). For pre-intervention (baseline) data, pair was treated as a random effect, whereas the fixed effects were type of oil, sex and their interaction, with age and BMI as covariates. For the main analysis – namely, to compare the effect of FO with that of MO – a random effects model was fitted with pair as a random effect, whereas sex, type of oil and their interaction were fitted as fixed effects. The pre-intervention value (month 0), age and BMI (both measured at month 0) were included as covariates. The effect of changes in body composition variables on markers of glycaemic control and insulin sensitivity were assessed by ANOVA through comparison of the differences between month 0 and 9 values with pair as the random effect, oil as the fixed effect and the difference in body composition change as a covariate. For all comparisons, P<0·05 was considered statistically significant; P<0·10 was considered as a tendency. Data are presented as arithmetic means with either standard deviation or standard errors of the difference between means as appropriate.
Results
Volunteers randomly assigned to receive FO or MO were similar in demographics, plasma lipid profiles and plasma inflammatory markers (all P>0·10; Table 1). Females had a higher body fat percentage than males (47·6 v. 32·3 %; sem 1·8 %; P<0·001). Females also had a greater hsCRP than males (6·1 v. 2·1 mg/l; sem 0·81; P=0·002). Compliance was checked during the study period by capsule usage each month. A further check was made retrospectively after final data analysis for the subjects allocated FO, based on the changes in phospholipid composition of erythrocyte membranes (see below).
Table 1 Baseline demographics of subjects allocated to receive either fish oil (FO) or maize oil (MO) supplements for 9 months (Arithmetic means and standard deviations)

M/F, male/female; sICAM, soluble intracellular cellular adhesion molecule-1; sVCAM-1, soluble vascular cellular adhesion molecule-1; hsCRP, high-sensitivity C-reactive peptide.
* P values for effect of allocation to type of oil from a random effects model with pairing as a random effect and sex×type of oil and their interaction as fixed effects.
† Sex effect P=0·037 (females younger than males with mean values 58·2 v. 60·0 years).
‡ Sex effect P<0·001 (greater for females than males 47·6 v. 32·2 %).
§ Sex effect P=0·002 (greater for females than males 6·1 v. 21·2 mg/l).
Membrane phospholipid contents
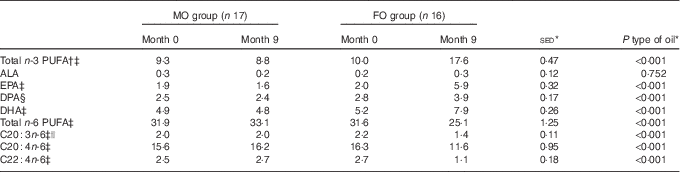
As expected, type of oil influenced the total n-3 PUFA content in erythrocyte membranes (P<0·001; Table 2), with an increase in response to FO (+76 %), whereas in the MO cohort it was unchanged (see below). These changes were also reflected in the increased composition of the individual n-3 PUFA (EPA, DPA and DHA; all P<0·001) for FO compared with MO. There was a corresponding decrease in both total and specific n-6 PUFA with FO compared with MO (all P<0·001; Table 2). The increase in n-3 PUFA and decrease in n-6 PUFA with FO balanced and, in consequence, the sum of n+3 and n+6 PUFA remained stable between FO and MO groups (online Supplementary Table S1). Total MUFA and SFA were both unchanged by supplementation with either oil (P>0·10; online Supplementary Table S1).
Table 2 Effect of 9-month intervention of fish oil (FO) or maize oil (MO) on percentage contribution of various PUFA to total phospholipids in erythrocyte membranes (Arithmetic means with their standard errors of the difference between means)
ALA, α-linolenic acid.
* For the main analysis, to compare the intervention of type of oil (FO v. MO), a random effects model was fitted with pair as a random effect, whereas sex, type of oil and their interaction were fitted as fixed effects. The pre-intervention value (month 0), age and BMI (both measured at month 0) were included as covariates. There were no significant differences for any variable at month 0 between the subjects allocated to either the FO or MO treatments, except for EPA where there was a sex-by-oil interaction (P=0·050), with values lower for males compared with females allocated to MO, but with the situation reversed for those allocated to FO.
† Total n-3 PUFA expressed as sum of EPA+DPA+DHA.
‡ Effect of age (P<0·05).
§ Effect of BMI (P=0·014).
|| Effect of sex (P=0·017) with average values for males greater than for females by 11 %.
Before supplementation, for all the volunteers, the sum of EPA and DHA represented, on average, 6·9 % (range 4·6–9·7 %) of erythrocyte membrane phospholipids and this increased to 9·4 % (range 6·5–12·6 %) when DPA was included. For those volunteers who then received FO, the combined EPA, DPA plus DHA attained >14 % n-3 PUFA enrichment in erythrocyte membrane phospholipids (range 14·7–20·3 %; Fig. 1) after 6 months of supplementation, but not when only EPA and DHA were combined (range 11·1–16·2 %). The proportion of n-3 PUFA in the erythrocyte membranes was greater in the FO group compared with the MO group from month 2 onwards (P<0·001; Fig. 1). The changes in phospholipid composition in the erythrocyte membranes for the volunteers allocated to FO were in agreement with the compliance information obtained from capsule usage for this group.

Fig. 1 Mean percentage, with their standard errors, of n-3 PUFA (EPA+DHA+DPA) in phospholipids from erythrocyte membranes over the 9-month intervention with either maize oil (○, n 17) or fish oil (●, n 16). Values at the various time points are arithmetic means, with their standard errors. *** Significant between oils within that month (standard errors of difference between type of oil within month 1·34), based on a random effects model analysis with volunteer and oil within volunteer as random effects and type of oil, month and their interaction as fixed effects (P<0·001).
For the pilot study, to compare phospholipid enrichments between membranes from erythrocytes and skeletal muscles, in the three volunteers who completed both muscle biopsies, the average n-3 PUFA in muscle membranes before FO supplementation was 2·4 % (range 1·8–3·4 %) for EPA plus DHA and 3·4 % (range 2·7–4·7 %) when DPA was included (Fig. 2). FO increased the proportion of muscle membrane phospholipids to 6·2 % (range 5·0–7·9 %) as EPA plus DHA or 7·8 % (range 6·0–9·7 %) when DPA was included. The muscle n-3 PUFA proportion as combined EPA, DHA and DPA was lower (28–59 %; SED 4·9 %; P<0·001) than that in erythrocytes before and after intervention (Fig. 2).

Fig. 2 Changes in the percentage of n-3 PUFA (EPA+DHA+DPA) in phospholipids from membranes of erythrocytes or muscle during the 9 months where three volunteers received fish oil (FO): pre-intervention (□, month 0), additional n-3 PUFA after 9 months of FO supplementation (![]() ).
).
Glucose metabolism
For the primary outcome – assessment of the impact of FO on aspects of glycaemic control – changes in variables were considered in both the overnight fasted state (i.e. non-insulin stimulated) and during the HIEGEAA clamp (insulin-stimulated). In the fasted state, neither type of oil nor study duration altered the concentrations of plasma glucose or EGP (Table 3). Fasting insulin levels before intervention tended (P=0·067) to be lower for those allocated to FO and over the period of FO supplementation tended (P=0·053) to increase, but only to values similar to those in the MO group, which remained unchanged over the study period. A similar trend was observed for fasting C-peptide, where concentrations also tended (P=0·093) to be lower for FO than MO before intervention, but during supplementation the 19 % increase (P=0·074) with FO raised values similar to those observed initially for the MO group (Table 3).
Table 3 Effect of 9-month supplementation with either fish oil (FO) or maize oil (MO) on fasting glucose or hormones and endogenous glucose production (EGP) (Arithmetic means with their standard errors of the difference between means)
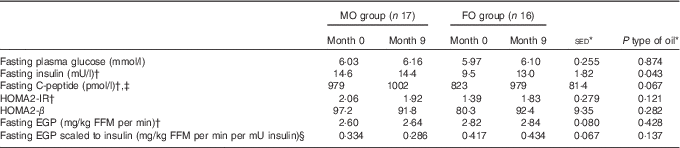
HOMA2-IR, homoeostatic model assessment-insulin resistance; HOMA2-β, homoeostatic model assessment-β cell function; FFM, fat-free mass.
* For the main analysis, to compare the intervention of type of oil (FO v. MO), a random effects model was fitted with pair as a random effect, whereas sex, type of oil and their interaction were fitted as fixed effects. The pre-intervention value (month 0), age and BMI (both measured at month 0) were included as covariates. For most variables, there were no significant differences at month 0 between the subjects allocated to either the FO or MO treatments.
† Tendency for effect of oil (P<0·10) at month 0 with greater values for the MO group, except for fasting EGP where values for FO were greater.
‡ Effect of sex (P=0·021) with values for males greater, on average, by 18 %.
§ Effect of age (P=0·026).
During the final hour of each HIEGEAA clamp, plasma glucose concentrations were maintained within 5 % of fasting values in sixty-four clamps (mean ±2·0 %; sd 1·9 %; online Supplementary Table S2). On two other occasions, in different subjects, glucose was maintained at 8·4 and 8·7 % of the target. In the insulin-stimulated state during the HIEGEAA clamp, neither total glucose disposal nor the amount of glucose (dextrose) infused differed between type of oil supplemented (Table 4), even when scaled against plasma insulin concentrations (Table 4). The residual (non-suppressed) EGP increased more for FO compared with MO (+40 % v. 8 %; P=0·050) during the 9 months of supplementation, with a similar tendency (P=0·063) when scaled against plasma insulin. Nonetheless, even with these increases, the residual EGP still only represented a small proportion (average 15–20 %) of fasting EGP (Table 4) for both groups.
Table 4 Effect of 9-month supplementation with either fish oil (FO) or maize oil (MO) on parameters of glucose metabolism during high-insulin–euglycaemic–euaminoacidaemic clamps (Arithmetic means with their standard errors of the difference between means)

FFM, fat-free mass; EGP, endogenous glucose production.
* For the main analysis, to compare the intervention of type of oil (FO v. MO), a random effects model was fitted with pair as a random effect, whereas sex, type of oil and their interaction were fitted as fixed effects. The pre-intervention value (month 0), age and BMI (both measured at month 0) were included as covariates. There were no significant differences for any variable at month 0 between the subjects allocated to either the FO or MO treatments.
Endogenous insulin release, as assessed by C-peptide concentrations, continued during the last hour of the HIEGEAA clamp but overall was less than pre-clamp values (812 v. 946; sed 26·4; P<0·001), with no difference in response for type of oil (see Tables 3 and 4). The C-peptide during the HIEGEAA clamp responded differently (P=0·028) between type of oil supplemented, with a slight decrease for MO (−5 %) over the 9 months while FO caused an increase (+18 %; Table 4). These subtle effects on endogenous insulin release were masked by the exogenous insulin infusion as this elevated plasma concentrations by 70 mU/l, a 10-fold increase (range 2–50-fold) on fasting values, but did not differ (P>0·10) between type of oil (online Supplementary Table S2).
Protein metabolism
For the secondary objective – examination of the effect of FO on whole-body protein metabolism – there were no differences in plasma total BCAA in the overnight fasted state in response to supplementation with either FO or MO (Table 5). Similarly, fasting protein breakdown scaled for lean body mass did not differ either between type of oil or over the study duration, but values were greater (+11 %; P=0·018) for females compared with males.
Table 5 Effect of 9-month supplementation with either fish oil (FO) or maize oil (MO) on infusion and plasma concentrations of branched-chain amino acids and estimates of protein metabolism based on leucine kinetics in either the fasting state or during hyperinsulinemic–euglycaemic–euaminoacidaemic (HIEGEAA) clamps (Arithmetic means with their standard errors of the difference between means)
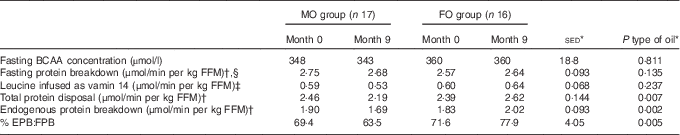
BCAA, combined branched-chain amino acids (isoleucine, leucine and valine); FFM, fat-free mass; EPB, endogenous protein breakdown during the HIEGEAA clamp; FBP, fasting protein breakdown.
* For the main analysis, to compare the intervention of type of oil (FO v. MO), a random effects model was fitted with pair as a random effect, whereas sex, type of oil and their interaction were fitted as fixed effects. The pre-intervention value (month 0), age and BMI (both measured at month 0) were included as covariates. There were no significant differences for any variable at month 0 between the subjects allocated to either the FO or MO treatments.
† Estimates of protein metabolism based on plasma enrichments of [1-13C 4-methyl-2-oxo pentanoic acid], the oxo-acid of leucine, as the precursor pool.
‡ Leucine present at 44·9 mmol/l in vamin 14 (total amino acids present at 694 mmol/l).
§ Effect of sex (P=0·018), females greater than males (2·83 v. 2·55 μmol/min per kg FFM, sed 0·125).
During the HIEGAA clamp, under the combined action of infused insulin, glucose and amino acids, the total amino acid disposal (based on MOP as precursor) differed between type of oil (P=0·007) with a 9 % increase for FO and a 10 % decrease for MO over the 9 months of supplementation. This difference between type of oil was mainly due to altered endogenous (non-suppressed) protein breakdown (P=0·001), with again an increase following FO (+10 %) compared with a decrease (−11 %) with MO (Table 5). In consequence, endogenous protein breakdown during the clamp expressed as a proportion of fasting protein breakdown differed (P<0·001) with type of oil used as supplement, with an increase when FO was supplied compared with a decrease with the MO intervention (Table 5).
Responses in body composition, plasma lipid profile and inflammatory and cardiovascular markers
Most of the body composition parameters were not altered by type of oil provided as supplement (online Supplementary Table S3), except that both groups showed a small increase over time in percent fat mass (+1·2 and +1·4 % for MO and FO, respectively, P trend=0·057 for month) and total fat mass (+1·9 kg for both MO and FO, P=0·014 for month). This probably relates to the additional energy provided as the oil supplements (59 MJ (14 Mcal) over study duration). In contrast, lean body mass (kg) was unaltered by intervention with either oil (online Supplementary Table S3). There were no impacts (P>0·05) of changes in either body weight or total body fat on the amount of glucose infused during the clamp, total glucose disposal (Rd) or residual (non-suppressed) EGP. HDL-cholesterol increased (17 %) with FO and decreased (−5 %) with MO (P=0·085 for type of oil; online Supplementary Table S4). Although TAG were unaffected by oil supplementation (online Supplementary Table S4), this may have been influenced by those volunteers on statin medication. For the volunteers who were not on statin medication, those in the FO group (n 10) had a percentage decrease during the supplementation while those on MO (n 10) increased (−17·4 v. +20·8 %; sed 16·6; P=0·043). There were no changes in inflammatory markers or the two adhesion molecules between the types of oil provided as the supplement (online Supplementary Table S5).
Discussion
Previous studies on the impact of FO supplements on insulin sensitivity and glycaemic control have produced inconsistent outcomes. A small number reported positive effects, for example( Reference Ramel, Martinez and Kiely 4 , Reference Rasic-Milutinovic, Perunicic and Pljesa 15 ), whereas a similar number showed a deterioration in glycaemic control, for example( Reference Glauber, Wallace and Griver 16 , Reference Schectman, Kaul and Kissebah 17 ). The majority of studies, however, reported either no or inconsistent responses, for example( Reference Krebs, Browning and McLean 5 , Reference Smith, Atherton and Reeds 37 ). This provides a dilemma for nutritionists as to whether to recommend FO as an effective dietary supplement to people with impaired glycaemic control or patients with type 2 diabetes controlled by diet and lifestyle changes( Reference Akinkuolie, Ngwa and Meigs 38 ). The various human studies involved a wide range of both dose of FO (1·8–7·5 g/d) and study duration (2–24 weeks), but data from piglets and steers have suggested that an enrichment of the muscle membrane phospholipid to 14 % of n-3 PUFA is required to effect a change in insulin sensitivity linked to glucose and protein metabolisms( Reference Bergeron, Julien and Davis 6 , Reference Fortin, Julien and Couture 40 ). Achievement of such membrane enrichments in humans would necessitate either a high dose of FO for moderate duration or a moderate dose for long duration, and few of the published studies have achieved these requirements. Therefore, the present study sought to determine whether a dose (3·9 g/d), between the upper limits recommended in the USA and Europe( 43 , 44 ), given over 9 months would change glycaemic control and (or) insulin sensitivity in humans with impaired glucose regulation.
Despite this dose and length of time of supplementation with n-3 PUFA, there was no improvement in either insulin sensitivity or regulation of glycaemia. The observed small increase in residual EGP following the FO intervention was insufficient to impact markedly on overall glucose disposal. This raises the following question: how can the present findings be reconciled with the epidemiological associations reported for the Inuit or with the animal studies where positive health benefits of FO are often reported?
The phospholipid content of erythrocyte membranes comprise 11 % n-3PUFA in Inuit who consume ≥32 % of their diet from traditional foods( Reference Bersamin, Luick and King 57 ) and reached 20 % in muscles from animal studies where improved insulin sensitivity was achieved( Reference Bergeron, Julien and Davis 6 , Reference Gingras, White and Chouinard 39 ). In the present study, the phospholipid content as combined EPA, DPA and DHA in erythrocyte membranes increased to a mean of 17 % after 9 months and all the subjects attained >14 % n-3 PUFA. Similar erythrocyte membrane enrichments were observed in the small biopsy cohort, but these subjects only achieved a maximum of 9·7 % (mean 7·8 %) in muscle membrane phospholipids, similar to values reported with just 8 weeks of supplementations( Reference Smith, Atherton and Reeds 37 , Reference Smith, Atherton and Reeds 42 ). These low values may partly explain why neither improved glycaemic control nor insulin sensitivity occurred after the FO intervention in the earlier( Reference Smith, Atherton and Reeds 37 , Reference Smith, Atherton and Reeds 42 ) and present studies. On the basis of the current findings, however, achievement in humans of muscle membrane n-3 PUFA enrichments postulated to result in improved insulin sensitivity in animal studies may be difficult under experimental, or normal lifestyle, conditions within the safe recommended intakes for the USA and Europe.
Furthermore, direct comparison with the original health-related findings from the Inuit population( Reference Mouratoff, Carroll and Scott 8 , Reference Mouratoff and Scott 9 ) is difficult because sources of n-3 PUFA in the Inuit diet include marine mammals, the oil of which differs in phospholipid composition to that of fish, but that has equal or superior health-related properties( Reference Zhu, Liu and Chen 7 , Reference Mann, O’Connell and Baldwin 58 ). An additional concern is that in animal studies, where improvements in either glucose and (or) protein metabolism have been reported, the doses of dietary n-3 PUFA (expressed as g/d per kg body weight) have been high – for example, in rats 0·75–2·7 g( Reference Kamolrat, Gray and Thivierge 59 , Reference Storlien, Jenkins and Chisholm 60 ), in piglets 5·2 g( Reference Bergeron, Julien and Davis 6 ) and in steers 0·20 g( Reference Gingras, White and Chouinard 39 ). In this study, the average dose of n-3 PUFA was 0·03 g/kg body weight, and thus whether 14 % n-3 PUFA in muscle membranes of human is possible under Western dietary conditions and recommended safety limits has yet to be determined. This may be further complicated if humans are similar to sea mammals and limit n-3 PUFA in muscle membranes to considerably below the amounts present in the diet( Reference Harris and Schmitt 61 ).
The aetiology of obesity and type 2 diabetes are thought to be due, in part, to inflammation( Reference Krebs, Browning and McLean 5 , Reference Rasic-Milutinovic, Perunicic and Pljesa 15 , Reference Muller, Martin and Koenig 62 , Reference Herder, Baumert and Thorand 63 ), and some of the beneficial effects of n-3 PUFA have been ascribed to anti-inflammatory properties( Reference Ramel, Martinez and Kiely 4 , Reference Krebs, Browning and McLean 5 , Reference Rasic-Milutinovic, Perunicic and Pljesa 15 , Reference Todoric, Loffler and Huber 64 , Reference Farzaneh-Far, Harris and Garg 65 ). Nonetheless, no changes in inflammatory markers were demonstrated in the present study. This may reflect the fact that, although the population studied were ‘at risk’ of type 2 diabetes, they were relatively healthy with a low status for baseline inflammatory markers. Other studies have also failed to demonstrate a clear association between n-3 PUFA intake or status and glycaemic control( Reference Smith, Atherton and Reeds 37 , Reference Smith, Atherton and Reeds 42 , Reference Mahendran, Agren and Uusitupa 66 ) or with inflammation in healthy subjects( Reference Smith, Atherton and Reeds 42 , Reference Mahendran, Agren and Uusitupa 66 ) but have done so for subjects with metabolic syndrome( Reference Robinson and Mazurak 67 ). The n-3 PUFA supplementation did not alter the concentration of LDL-cholesterol, which has been a concern in some studies( Reference Schectman, Kaul and Kissebah 17 , Reference Harris 68 ), whereas HDL-cholesterol concentration increased over the course of the study. Although n-3 PUFA has been demonstrated in the past to lower plasma triglyceride concentrations( Reference Sacks, Stone and Gibson 69 ), this only occurred for the current volunteers who were not on statin medication. Statins have been shown to lower triglyceride levels( Reference Jones, Davidson and Stein 70 ) and this may have restricted the ability to allow further reductions with FO.
In contrast to the findings for glucose metabolism, whole-body protein kinetics were altered as a result of the high-dose long-term n-3 PUFA supplementation, but this only occurred during the insulin-stimulated state, not the basal (fasting) condition. These data support the findings from a number of recent studies – for example, muscle protein synthesis in both young and middle-aged or elderly subjects was increased following FO supplementation( Reference Smith, Atherton and Reeds 42 , Reference Smith, Atherton and Reeds 42 ) in the insulin-stimulated, but not basal, state. This has parallels with the situation in both neonatal pigs( Reference El Kadi, Suryawan and Gazzaneo 71 ) and elderly humans( Reference Fujita, Glynn and Timmerman 72 ), where elevated insulin concentrations stimulated muscle protein gain at otherwise similar nutritional inputs. Furthermore, the increase in protein disposal during the HIEGEAA clamp in the current subjects who received FO agrees with findings in growing farm animals( Reference Bergeron, Julien and Davis 6 , Reference Gingras, White and Chouinard 39 , Reference Fortin, Julien and Couture 40 ). Nonetheless, changes in protein dynamics may not necessarily translate into improved net protein anabolism – for example, despite the observed increases in muscle protein synthesis and whole-body protein disposal in the insulin-stimulated state, FO supplementation did not improve growth rates or N retention in pigs( Reference Bergeron, Julien and Davis 6 ), steers( Reference Gingras, White and Chouinard 39 , Reference Fortin, Julien and Couture 40 ) or rats( Reference Kamolrat, Gray and Thivierge 59 ) compared with control animals. In addition, no changes in lean body mass were observed in the present study during the 9-month supplementation with FO. Such lack of responses in protein gain may relate to metabolism only being stimulated when insulin concentrations are elevated – for example, in the few hours after each large meal. For the rest of the day, effectively a basal state exists and this may mitigate, or even counterbalance, the transient effects of the insulin-stimulated condition. The situation may be different in net catabolic states, however, as reduced rate of loss of either body weight or lean mass have been reported for some patients newly diagnosed with various cancers when given EPA as a supplement( Reference Murphy, Yeung and Mazurak 73 ).
Limitations of the study include the small number of subjects. This was counterbalanced by the use of a pairing procedure to match specific initial metabolic parameters between the two groups. With the considerable number of measurements made, it was not possible to match all of them, however, and initial numerical differences between groups in fasting insulin and C-peptide existed. Total body fat also increased in both groups over the study duration and may have reduced any response in glycaemic control and insulin sensitivity as both parameters have been reported to correlate negatively with increased BMI( Reference Esteghamati, Khalilzadeh and Anvari 74 ), although not in all studies( Reference Vazquez, Rodriguez and Salvador 75 ). Although the volunteers exhibited impaired glycaemic control, their levels of inflammatory markers were similar to that reported for healthy subjects and the treatment outcome may be different in populations with elevated inflammatory status. No measures of tissue protein synthesis were performed, and thus it was not possible to confirm the increases in muscle protein synthesis following FO supplementation as reported by others( Reference Smith, Atherton and Reeds 37 , Reference Smith, Atherton and Reeds 42 ). The pilot study to compare phospholipid contents in erythrocyte and muscle membranes only had three volunteers who completed the study, but the difference in enrichments were large and statistically robust. Strengths of the study include the near-prescription dose used and the longer period of intervention than that reported for many studies. This allows for maximum increases in membrane phospholipid content under safe conditions. The use of HIEGEAA clamp procedures also provided a well-accepted measure of insulin sensitivity and glycaemic control. Measurement of lean body mass showed that the insulin-stimulated changes in whole-body protein metabolism may not necessarily translate into improved net anabolism, although this outcome may be different in net catabolic states, including age-related sarcopenia, or for intervention periods longer than 9 months.
In summary, this study has not established any change in glucose metabolism following prolonged FO supplementation. Although there were responses of FO supplementation on protein dynamics, whether this translates into improved protein anabolism in other populations remains unclear and requires further investigation.
Acknowledgements
The authors thank Vivien Buchan, Susan Anderson, Graham Calder, Susan Moir and David Bremner for their various analytical expertise. Lynn Walker, Norma Alexander and Frances Rentoul provided invaluable support during the HIEGEAA clamps. The authors also thank Lesley Hall for performing the muscle biopsies. Anne-Sophie DaCosta and KenWei Lee performed data analyses as part of student projects. The support of EPAX AS and their scientific advisor Morten Bryhn for the supply of the FO and MO capsules is gratefully recognised.
This work was funded as part of the core grant from Rural and Environment Science and Analytical Services Division of the Scottish Government to the Rowett Institute of Nutrition and Health, University of Aberdeen and to Biomathematics and Statistics Scotland, Aberdeen. Neither the funding body nor EPAX AS had any role in the design and conduct of the study; collection, management, analysis and interpretation of the data; or preparation, review and approval of the manuscript.
The author’s responsibilities were as follows: M. C. T., G. E. L. and L. F. C. designed the research and were involved in subject recruitment, data collection, data analyses and manuscript preparation; P. A. and D. W. M. P. supervised clinical aspects; S. C. M. was involved in subject recruitment and management; S. C. M. conducted the initial clamps; G. W. H. and G. H. provided statistical and modelling support and controlled the double-blind procedure; F. T. supervised lipid analyses and was involved in manuscript preparation.
The authors declare that there are no conflicts of interest.
Supplementary material
For supplementary material/s referred to in this article, please visit http://dx.doi.org/doi:10.1017/S0007114515004274


