


Vitamin D deficiency has increasingly been reported in many regions of the world in both adults and children( Reference Holick and Chen 1 – Reference van Schoor and Lips 6 ). In comparison to North America and Europe, Latin America is a region where vitamin D research has been under-represented, particularly in the paediatric population( Reference Palacios and Gonzalez 5 , Reference Brito, Cori and Olivares 7 , Reference Mokhtar, Brito and Holick 8 ). In young children (<5 years), data from the Patagonia region of Argentina( Reference Durán, Mangialavori and Biglieri 9 ) (6–23 months) and Mexico (2–5 years)( Reference Flores, Macias and Lozada 10 ) show a prevalence of vitamin D deficiency (<50 nmol/l) of nearly 24 %. However, there is limited knowledge of the prevalence of vitamin D status among young children living in the high-altitude Andean countries. One study published in the Andean capital of Bogota, Colombia among pre-adolescent girls (5–12 years) showed that 12 % of girls were vitamin D deficient (<50 nmol/l) and 51 % were insufficient (50–72·5 nmol/l)( Reference Villamor, Marin and Mora-Plazas 11 ).
Since exposure of skin to solar UVB radiation and cutaneous production is a major source of vitamin D, regions with low latitudes should theoretically have a low prevalence of vitamin D deficiency. With its equatorial latitude, the Ecuadorian capital Quito receives nearly 12 h of sunlight per day year-round, and has an altitude of 2800 m above sea level. Both conditions increase the solar UV radiation index( Reference Engelsen, Brustad and Aksnes 12 ) and are conducive to epidermal vitamin D synthesis( Reference Holick, Chen and Lu 13 ). However, previous studies in countries with low latitude( Reference Lips 4 , Reference Marwaha, Tandon and Reddy 14 , Reference Reesukumal, Manonukul and Jirapongsananuruk 15 ) and/or high altitude( Reference Hirschler, Maccallini and Molinari 16 – Reference Sud, Montenegro-Bethancourt and Bermúdez 18 ) show that this does not necessarily translate into a low population prevalence of vitamin D deficiency.
Vitamin D deficiency is of particular concern in growing children( Reference Rauch 19 , Reference Bachrach 20 ) and limited data are available on the association between vitamin D and nutritional status. The Generation R study, a large multi-ethnic cohort of 6-year-olds in the Netherlands, found that children who were underweight (defined by BMI Z-score) had a higher risk of vitamin D deficiency (<50 nmol/l) compared with normal-weight children( Reference Voortman, van den Hooven and Heijboer 21 ). Another study in a tertiary care centre in Tanzania found that 30·6 % (41/134) of children <5 years old had vitamin D deficiency (defined as <50 nmol/l) and that children with marasmus were more likely to have vitamin D deficiency compared with children with kwashiorkor or marasmic kwashiorkor( Reference Walli, Munubhi and Aboud 22 ).
Vitamin D status influences linear growth, even in children with no clinical signs of rickets. A study among South African children aged 2–5 years found that stunted children were less likely to consume vitamin D along with other key components of milk such as Ca, riboflavin and fat than non-stunted children( Reference van Stuijvenberg, Nel and Schoeman 23 ). In India, a randomized placebo-controlled trial with 2709 full-term, low-birth-weight infants found that infants randomized to a weekly cholecalciferol (vitamin D3) dose of 35 µg (1400 IU) from 7 d to 6 months of age had significant increases in length, weight and mid-upper arm circumference compared with infants given placebo( Reference Kumar, Sachdev and Chellani 24 ). However, the anthropometric gains from the short-term supplementation trial did not appear to be sustained when a sub-sample of these children had their anthropometrics remeasured at 3–6 years of age( Reference Trilok-Kumar, Kaur and Rehman 25 ). Each of these studies underlines the importance of vitamin D for normal growth of young children.
Given the lack of information on the vitamin D status among Ecuadorian children and its potentially important effects on growth, we performed a secondary analysis using a convenience sample of children participating in a clinical trial in Ecuador. The objectives of the current analysis were to: (i) measure the prevalence of vitamin D deficiency in a low socio-economic status (SES) weight-stratified sample of children aged 6–36 months residing in the Ecuadorian Andes; (ii) assess whether vitamin D status differs between underweight children and normal-weight children; and (iii) determine whether children with lower levels of vitamin D were more likely to be stunted than those with higher levels.
Methods
Study setting
The study setting was low-SES peri-urban neighbourhoods, called barrios, in Quito, Ecuador. The barrios are located on the hilly outskirts about 20 km north-west of downtown Quito with elevations greater than 2800 m above sea level. The study was carried out in five adjacent neighbourhoods: Atucucho, Caminos de la Libertad, Colinas del Norte, Pisuli and Roldos. These impoverished barrios had poor infrastructure and limited health-care facilities. In 2000, a baseline survey of the barrios showed that households had a mean monthly income of US $54, which was 50 % below the mean basic income in Ecuador. Only 52 % of households had a municipal source of potable water while 62 % had sewer access.
Study design
The current study was a cross-sectional analysis of subjects who participated in a larger randomized control trial, the Vitamin A, Zinc and Pneumonia (VAZPOP) study (clinicaltrial.gov identifier number NCT00228254). During 2000–2003, children were recruited in groups of 600 to 660 in four serial cohorts with each cohort beginning in July. Individual participation lasted one year. To be enrolled in the trial, children had to be 6–36 months old, have had no recent micronutrient supplementation, and have resided in one of the five study neighbourhoods for at least one year. After the initial baseline survey of the neighbourhoods, a site map with geographic divisions was developed which included all eligible children in each of the five neighbourhoods. Children were randomly chosen from geographic divisions in a proportional fashion. In households with two or more eligible children, the youngest child was considered eligible and older siblings were excluded from enrolment. Parents of eligible children were contacted and children were invited to participate in the study and attend an anthropometric measurement session.
Study enrolment was weight-stratified, with approximately 200–220 children selected (forty to forty-five children in each of the five study neighbourhoods) in each of the following weight-for-age Z-score (WAZ) strata: underweight (WAZ≤−2), mildly underweight (–1≤WAZ>−2) and well nourished (WAZ>−1) based on the National Institute of Child Health and Human Development reference growth curves (Epi-Info 2002 software; Centers for Disease Control, Atlanta, GA, USA). Severely malnourished children (weight <60 % of predicted) were excluded and their entry into nutritional rehabilitation centres was facilitated. The current cross-sectional study was limited to subjects from the last year of VAZPOP who had a minimum of 100 µl of serum from their baseline blood draw. A flowchart showing the selection of study participants is available in the online supplementary material, Supplemental Fig. 1.
Anthropometric measurements
Anthropometric measures were collected at baseline (conducted between 12 June and 2 July 2003). Trained study personnel performed height, length and weight measures. Length for children aged <24 months was measured using horizontal scales. Standing height was measured for children aged ≥24 months using non-distensible plastic tape fixed on to a vertical board. Height and length were measured to the nearest 0·1 cm. Weight was measured using Detecto® Health-o-meters balance scale (Webb City, IA, USA) to the nearest 0·1 kg. Anthropometric devices for weight and height measurements were calibrated annually for accuracy by the National Bureau of Standards of Ecuador. WAZ, height-for-age Z-score (HAZ) and weight-for-height Z-score (WHZ) were calculated using the 2007 WHO growth standards (WHO Anthro version 3.2.2, January 2011; WHO, http://www.who.int/childgrowth/software/en/). Children who had a height-for-age≤−2 sd below the median of the WHO child growth standards (i.e. HAZ≤−2) were categorized as stunted. Children who had a weight-for-age≤−1 sd below the median reference growth standards (i.e. WAZ≤−1) were categorized as underweight; this group included both mildly and significantly underweight children. We compared children having WAZ≤−1 (instead of children having WAZ≤−2) and children having WAZ>–1 in our models, since a stronger association between WAZ≤−1 and vitamin D status was observed in initial analyses.
Biochemical analysis
Venous blood was collected from children at baseline into trace-element-free tubes (Sarstedt AG, Nümbrecht, Germany). The blood samples were transported in a cooler with ice packs to the laboratory of Pontificia Universidad Católica del Ecuador, where they were stored in freezers at −80°C and subsequently shipped to Boston for vitamin D analyses.
Hb was measured at baseline with a finger prick sample using the HemaCue Hb 201+ assay. Serum 25-hydroxyvitamin D (25(OH)D) and intact parathyroid hormone (iPTH; amino acids 1–84) were measured at the Vitamin D Lab at the Boston University School of Medicine (BUSM, Boston, MA, USA) using an automated enzyme immunoassay (IDS-iSYS; Immunodiagnostic Systems Ltd, Boldon, UK) which uses an ester magnetic particle/chemiluminescence immunoassay technique. The assay for 25(OH)D was validated at the Vitamin D Lab against HPLC with tandem MS (LC/MS/MS), the gold standard for 25(OH)D determination, using additional samples not obtained for the study. A single determination of 25(OH)D and iPTH was measured. However, of those samples that had >400 µl of serum, a 20 % random sub-sample was used to measure 25(OH)D in duplicate.
The assay recognizes 25-hydroxycholecalciferol (25(OH)D3) and 25-hydroxyergocalciferol (25(OH)D2) equally well, with a dynamic range of 15–315 nmol/l. The lower limit of detection of the 25(OH)D assay was 15 nmol/l. Subjects below the detection limit of the assay were assigned a value of 15 nmol/l (n 2) for their 25(OH)D concentration. Subjects below the detection limit of the iPTH assay (<0·5 pmol/l) were assigned a value of 0·5 pmol/l (n 9) with a dynamic range of 0·5–10·5 pmol/l.
Control samples were inserted at periodic intervals for quality control purposes. The inter-class CV for serum 25(OH)D at the high, medium and low levels was 11·1, 5·7 and 6·0 %, respectively and for iPTH it was 7·4, 4·1 and 5·0 %, respectively. The intra-assay CV for the current analysis was 4·9 % for 25(OH)D.
Interpretation of vitamin D status
Existing recommendations for interpreting vitamin D status focus on bone metabolism( Reference Holick, Binkley and Bischoff-Ferrari 26 – 30 ) and no guidance exists for linking serum levels to undernutrition. We conducted a sensitivity analysis to ascertain the 25(OH)D concentration that showed the strongest associations between 25(OH)D, HAZ and WAZ (see online supplementary material, Supplemental Table 1). For the sensitivity analysis, a series of univariate logistic regression models was carried out with 25(OH)D cut-offs changing from 30 to 75 nmol/l in 2·5 nmol/l increments (e.g. 30, 32·5, 35 nmol/l, etc.). In these analyses, a cut-off value for serum 25(OH)D of 42·5 nmol/l was found to be most strongly associated with WAZ and very strongly associated with HAZ, and was therefore used in the current study. For comparison to other studies, we also used the Institute of Medicine definitions (at risk of classic vitamin D deficiency states such as rickets, <30 nmol/l (<12 ng/ml); risk of inadequacy, 30 to 47·5 nmol/l (12 to 19 ng/ml); sufficiency, ≥50 nmol/l (≥20 ng/ml)( 30 )) and the Endocrine Society Practice Guidelines (deficiency, <50 nmol/l (<20 ng/ml); insufficiency, 50 to 72·5 nmol/l (20 to 29 ng/ml); sufficiency, ≥75 nmol/l (≥30 ng/ml)( Reference Holick, Binkley and Bischoff-Ferrari 26 )).
Statistical analyses
Data analysis was performed using the statistical software package SAS release 9.3®. Results are presented as mean and standard deviation for continuous variables, or as number and percentage for categorical variables. The mean difference (MD) and 95 % confidence interval were calculated. Linear regression was performed to examine the relationship between 25(OH)D (continuous) and iPTH (continuous) concentrations.
Two analyses were performed. The first was to examine WAZ as a predictor of vitamin D status. We hypothesized that underweight children are at greater risk of lower serum 25(OH)D levels due to less dietary intake. The second analysis examined vitamin D status as a predictor of stunting since lower vitamin D levels may contribute to less than optimal bone growth.
Multiple logistic regression analyses were performed to examine the relationship between underweight as measured by WAZ (independent variable) and vitamin D status (dependent variable) as well as between vitamin D status (independent variable) and stunting (dependent variable). To control for confounding, each potential confounder was added individually to the model. Variables that changed the main exposure effect estimate by more than 10 % were included in the multivariate model. The following potential variables were considered for the model: height, weight, sex, age, SES variables, Hb concentration and iPTH. SES variables were available in a subset of children. These included maternal education and paternal education (illiterate, primary school, high school or higher education), access to sanitary facilities (household access to toilet v. non-toilet (field, latrine or well)), source of water supply (access to potable water v. no access to potable water), type of household construction (block construction v. other type of construction (e.g. wooden)), household ownership (own, rent, other), number of persons per household, number of rooms per household and a crowding index (calculated as the number of persons per household/number of rooms per household). To avoid multicollinearity, a Spearman correlation was calculated for binary and ordinal data while a Pearson correlation was calculated for continuous variables. Variables that were highly correlated were not included in the same model. The most parsimonious model which controlled for all known confounders was chosen for our final multivariate models. Since children were recruited from one of five neighbourhoods, additional cluster effects analyses were performed for comparison with our multivariate logistic regression models. The cluster effects analyses allowed us to account for the possibility that children residing in the same neighbourhood may exhibit similarities in characteristics. To do this, generalized estimating equation models were used and we adjusted for covariates obtained from the confounding analysis.
Sample size and power calculation
The study sample was obtained by convenience sampling. In total, 526 of the 645 children who participated in the final phase of VAZPOP had baseline serum 25(OH)D analysed. The remaining 119 subjects were excluded due to inadequate (n 76) or protein precipitation samples (n 43). A further ten subjects were also excluded for having missing measures of weight and/or height, leaving 516 for analysis.
Post hoc power calculations were based on the minimal detectable difference for the sample size of the study. This was performed using the ‘PS: Power and Sample Size’ program version 3.1.2 assuming a 5 % significance level and 80 % power and using an uncorrected χ 2 test. For the analysis examining WAZ as a predictor of vitamin D status, we were able to detect a difference in the OR of 1·7 with a sample size of 516. For the second analysis examining vitamin D status as a predictor of stunting, the minimal detectable difference was 1·3.
Ethical review
Parental informed consent was obtained for each child who participated in the study. The Boston University Institutional Review Board and the Ethical Committee of the Corporación Ecuatoriana de Biotecnología (CEB) approved this study.
Results
Subject characteristics
A similar number of males and females participated in the study (Table 1); their mean age was 17·9 (sd 8·0) months with >70 % of children being >12 months of age. Underweight and normal-weight children had similar age distributions. There were no important differences in household characteristics between the underweight and normal-weight groups. As expected for this weight-stratified sample, 65·3 % (337/516) were underweight (WAZ≤−1) and the rest were normal weight (WAZ>–1). About two-thirds (62·2 %, 321/516) of children were stunted (HAZ≤−2) and 3·1 % (16/516) were wasted (WHZ≤−2). Children who were underweight were shorter (MD=3·4 cm; 95 % CI 1·9, 4·8 cm) and had lower mean HAZ scores (MD=1·3; 95 % CI 1·2, 1·5) than children who were normal weight. The mean WHZ scores also differed between the two WAZ categories (MD=1·2; 95 % CI 1·1, 1·3).
Table 1 Baseline characteristics, stratified by weight status, among the study population of children aged 6–36 months (n 516) residing in five low-SES peri-urban neighbourhoods near Quito, Ecuador, June–July 2003

SES, socio-economic status; WAZ, weight-for-age Z-score; HAZ, height-for-age Z-score; WHZ, weight-for-height Z-score; WLZ, weight-for-length Z-score; 25(OH)D, 25-hydroxyvitamin D; iPTH, intact parathyroid hormone.
* Underweight (WAZ≤–1) includes both mildly underweight and moderately underweight children.
† To convert units of 25(OH)D from nmol/l to ng/ml divide by 2·496.
We explored potential confounding by a wide range of SES-related variables (shown in Table 1). Since many subjects had missing SES variables, we compared the SES-adjusted models with the SES-unadjusted models in the subset of subjects with non-missing data and the effect estimates were virtually identical. Therefore, we removed all SES variables from the final models. There was also no effect modification by SES or other variables. Subjects who had data on SES variables did not differ significantly from those subjects who did not have SES variables (see online supplementary material, Supplemental Table 2). This result is consistent with the objectives of the parent VAZPOP study, which sought to minimize SES effects by conducting the study in poor neighbourhoods.
Distribution of serum 25-hydroxyvitamin D concentrations among children
Figure 1 shows the distribution of serum 25(OH)D among study participants. The mean serum 25(OH)D concentration was 58·0 (sd 17·7) nmol/l. Using our study-specific cut-off of 42·5 nmol/l, 18·6 % of children had a serum 25(OH)D level <42·5 nmol/l (Table 2). According to the Institute of Medicine cut-offs( 30 ), only 3·5 % of children were at risk of deficiency (<30 nmol/l) and 31·6 % were at risk of inadequacy (30–47·5 nmol/l). Using the Endocrine Society Practice Guidelines definitions( Reference Holick, Binkley and Bischoff-Ferrari 26 ), 35·1 % were deficient (<50 nmol/l) and 44·4 % were insufficient (50–72·5 nmol/l). Overall, the mean 25(OH)D concentration was similar in children who were underweight and normal weight (MD=0·40 nmol/l; 95 % CI −2·7, 3·5 nmol/l), although the likelihood of being classified with 25(OH)D level <42·5 nmol/l was higher in underweight than normal-weight children (22·0 v. 12·3 %, respectively; Table 1). This is because the distribution of serum 25(OH)D differed between the two weight groups (Fig. 2). Children who were stunted had mean serum 25(OH)D concentration of 56·7 (sd 18·5) nmol/l and those who were not stunted had a mean of 60·0 (sd 16·0) nmol/l (MD=3·3 nmol/l; 95 % CI 0·32, 6·5 nmol/l). Mean 25(OH)D serum concentrations were highest in infants aged 6–12 months compared with older children (>12 months; MD=10·0 nmol/l; 95 % CI 6·7, 13·5 nmol/l) but did not differ by sex (MD=−0·60 nmol/l; 95 % CI −3·7, 2·4 nmol/l).

Fig. 1 Distribution of serum 25(OH)D levels in the study population of children aged 6–36 months (n 516) residing in five low-SES peri-urban neighbourhoods near Quito, Ecuador, June–July 2003 (25(OH)D, 25-hydroxyvitamin D; SES, socio-economic status)
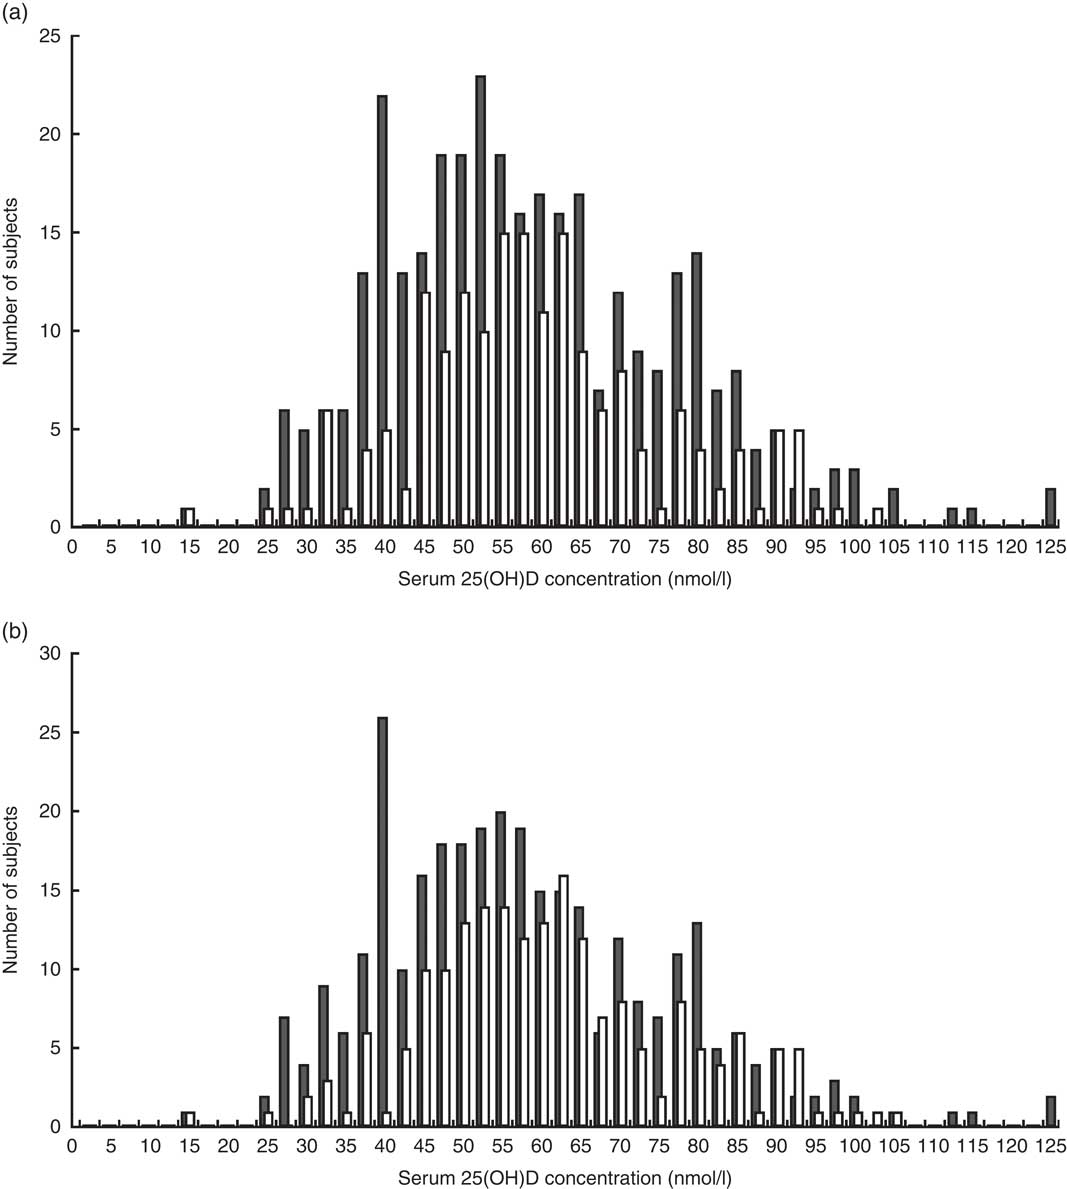
Fig. 2 Distribution of serum 25(OH)D by (a) WAZ group (![]() , underweight (WAZ≤−1), n 337;
, underweight (WAZ≤−1), n 337; ![]() , normal weight (WAZ>–1), n 179) and (b) HAZ group (
, normal weight (WAZ>–1), n 179) and (b) HAZ group (![]() , stunted (HAZ≤−2), n 321;
, stunted (HAZ≤−2), n 321; ![]() , not stunted (HAZ>–2), n 195) among children aged 6–36 months (n 516) residing in five low-SES peri-urban neighbourhoods near Quito, Ecuador, June–July 2003 (25(OH)D, 25-hydroxyvitamin D; WAZ, weight-for-age Z-score; HAZ, height-for-age Z-score; SES, socio-economic status)
, not stunted (HAZ>–2), n 195) among children aged 6–36 months (n 516) residing in five low-SES peri-urban neighbourhoods near Quito, Ecuador, June–July 2003 (25(OH)D, 25-hydroxyvitamin D; WAZ, weight-for-age Z-score; HAZ, height-for-age Z-score; SES, socio-economic status)
Table 2 Mean 25(OH)D levels, based on different cut-off points defined using a study-specific sensitivity analysis cut-off, the Institute of Medicine definitions and the Endocrine Society Practice Guidelines, among the study population of children aged 6–36 months (n 516) residing in five low-SES peri-urban neighbourhoods near Quito, Ecuador, June–July 2003

25(OH)D, 25-hydroxyvitamin D; SES, socio-economic status.
Weight and vitamin D status
Significantly, underweight children were twice as likely to have a serum 25(OH)D level <42·5 nmol/l compared with children who were normal weight (unadjusted OR=2·0; 95 % CI 1·2, 3·4; Table 3). After adjusting for age and sex, the association was unchanged (adjusted OR (aOR)=2·0; 95 % CI 1·2, 3·3). After accounting for the clustering of data by neighbourhood, the association remained the same although the 95 % CI were slightly wider (aOR=2·0; 95 % CI 1·2, 3·5). Further, sex (male v. female) was not a predictor of vitamin D status (OR=1·1; 95 % CI 0·69, 1·7). Older (>12 months) children had a non-statistically significant 50 % increased risk (OR=1·5; 95 % CI 0·87, 2·6) of serum 25(OH)D level <42·5 nmol/l compared with younger children (6–12 months).
Table 3 Multivariate models for predictors of vitamin D status (25(OH)D <42·5 v. ≥42·5 nmol/l) among the study population of children aged 6–36 months (n 516) residing in five low-SES peri-urban neighbourhoods near Quito, Ecuador, June–July 2003

25(OH)D, 25-hydroxyvitamin D; SES, socio-economic status; WAZ, weight-for-age Z-score.
Unadjusted model: vitamin D status (<42·5 v ≥42·5 nmol/l)=WAZ (≤−1 v. >–1).
Multivariable model: adjusted for age (dichotomous) and sex.
* Underweight (WAZ≤−1) includes both mildly underweight and moderately underweight children.
Stunting and vitamin D status
A significantly greater proportion of children who had serum 25(OH)D concentration <42·5 nmol/l were stunted than were children with 25(OH)D level ≥42·5 nmol/l (79·2 v. 58·3 %, respectively; Table 4). After adjusting for age and sex, children with 25(OH)D concentration <42·5 nmol/l were more likely to be stunted than children with higher serum concentration (≥42·5 nmol/l; aOR=2·8; 95 % CI 1·6, 4·7; Table 5). Nearly identical results were found when the analysis accounted for the clustering of data by neighbourhood (aOR=2·8; 95 % CI 1·6, 4·8). In addition, boys were 1·6 times (95 % CI 1·1, 2·3) more likely to be stunted than girls, but age was not associated with stunting (OR=0·9; 95 % CI 0·57, 1·3).
Table 4 Baseline characteristics, stratified by vitamin D status, of the study population of children aged 6–36 months (n 516) residing in five low-SES peri-urban neighbourhoods near Quito, Ecuador, June–July 2003

SES, socio-economic status; WAZ, weight-for-age Z-score; HAZ, height-for-age Z-score; WHZ, weight-for-height Z-score; WLZ, weight-for-length Z-score; 25(OH)D, 25-hydroxyvitamin D; iPTH, intact parathyroid hormone.
* To convert units of 25(OH)D from nmol/l to ng/ml divide by 2·496.
Table 5 Multivariate models for predictors of stunting (HAZ≤−2) among the study population of children aged 6–36 months (n 516) residing in five low-SES peri-urban neighbourhoods near Quito, Ecuador, June–July 2003

HAZ, height-for-age Z-score; SES, socio-economic status; 25(OH)D, 25-hydroxyvitamin D.
Unadjusted model: HAZ (≤−2 v. >−2)=vitamin D status (<42·5 v. ≥42·5 nmol/l).
Multivariate model: adjusted for age (dichotomous) and sex.
Serum 25-hydroxyvitamin D and parathyroid hormone
Intact PTH was measured in the subjects (n 396) who had sufficient serum to allow both 25(OH)D and iPTH assessment. Mean iPTH was similar in the two vitamin D status categories (Table 4; MD=0·17 pmol/l; 95 % CI −0·21, 0·55 pmol/l). Similarly, there was no difference in mean iPTH among children who were normal weight v. underweight (MD=−0·013 pmol/l; 95 % CI −0·33, 0·29 pmol/l; Table 1). The linear regression analysis showed an inverse relationship between 25(OH)D and iPTH, although this was not statistically significant (β=−0·20, P=0·062).
Discussion
To our knowledge, the present study is the first to measure vitamin D status in Ecuadorian children. Children who were underweight were 2·0 (95 % CI 1·2, 3·3) times more likely to have serum 25(OH)D level <42·5 nmol/l compared with normal-weight children. We report a novel association between lower vitamin D status and stunting (aOR=2·8; 95 % CI 1·6, 4·7). Accounting for clustering by site from which children were recruited did not alter these findings.
Reports on the association of vitamin D deficiency with stunting in young children not diagnosed with rickets are limited. There is evidence from studies in adolescents which supports an association between vitamin D deficiency and reduced linear growth( Reference Gilbert-Diamond, Baylin and Mora-Plazas 17 , Reference Hatun, Islam and Cizmecioglu 31 , Reference Kremer, Campbell and Reinhardt 32 ). Among older adolescent girls (16–22 years), Kremer et al. found a positive correlation between circulating 25(OH)D and height( Reference Kremer, Campbell and Reinhardt 32 ). In adolescents in Bogota, Colombia, a longitudinal study by Gilbert-Diamond et al.( Reference Gilbert-Diamond, Baylin and Mora-Plazas 17 ) found that vitamin D deficiency (<50 nmol/l) was associated with impaired growth in girls but not in boys. Infants whose mothers received vitamin D supplements during gestation showed improved birth weight and linear growth in the first year of life compared with infants born to non-supplemented mothers( Reference Brooke, Butters and Wood 33 – Reference Harvey, Holroyd and Ntani 37 ). Vitamin D may thus be an important modifiable nutritional factor to prevent stunting.
Defining low vitamin D status and which cut-off to use has been extensively debated, especially in the paediatric population( Reference Ross, Manson and Abrams 27 , Reference Rosen, Abrams and Aloia 28 ). Currently, there are insufficient data to support a specific cut-off in children. The definitions set forth by the Institute of Medicine relate to serum levels needed to prevent rickets and demonstrate optimal bone mineral density( Reference Ross, Manson and Abrams 27 , 30 ). The Endocrine Society Practice Guidelines definitions focus on levels associated with improved bone mineral density, muscle mass and plateauing of PTH levels( Reference Holick, Chen and Lu 13 , Reference Holick, Binkley and Bischoff-Ferrari 26 ). The validity of applying these traditional cut-offs to our endpoints of undernutrition was unclear. Thus, we chose to conduct a sensitivity analysis to examine the consistency of the effects across a wide range of serum 25(OH)D concentrations. These analyses suggested an optimum cut-off value for serum 25(OH)D of <42·5 nmol/l in this data set.
Overall, 18·6 % of children had a serum 25(OH)D level <42·5 nmol/l. By contrast, using the cut-offs from the Endocrine Society Practice Guidelines( Reference Holick, Binkley and Bischoff-Ferrari 26 ), we found that 35·0 % of children had serum 25(OH)D level <50 nmol/l and 46·1 % were vitamin D insufficient (50 to <75 nmol/l). This level of deficiency is slightly higher than in children (2–5 years) in Mexico (<50 nmol/l: 24 %)( Reference Flores, Macias and Lozada 10 ), infants (6–23 months) in the Patagonia region of Argentina (<50 nmol/l: 24 %)( Reference Durán, Mangialavori and Biglieri 9 ) and children (1–8 years) in the USA (<50 nmol/l: 9–11 %)( Reference Looker, Johnson and Lacher 38 ). However, it is similar to the deficiency level in children and adolescents (7–18 years) in Brazil (<50 nmol/l: 36·3 %)( Reference Santos, Mascarenhas and Satler 39 ). In comparison to findings from Colombia (5–12 years)( Reference Gilbert-Diamond, Baylin and Mora-Plazas 17 ), the prevalence of vitamin D deficiency (<50 nmol/l) in Ecuador is higher than in Colombian children (35·0 v. 10·2 %) but the level of insufficiency (50–72·5 nmol/l) is comparable (46·1 v. 46·4 %). These findings concur with studies which examined vitamin D status in low-SES children in the USA (1–5 years)( Reference Cole, Grant and Tangpricha 40 ) and the Netherlands (6 years)( Reference Voortman, van den Hooven and Heijboer 21 ). Severe deficiency, defined by the Institute of Medicine as serum 25(OH)D level <30 nmol/l, was present in only 3·5 % of the children we assessed. This is similar to rates found in the Patagonia region of Argentina( Reference Durán, Mangialavori and Biglieri 9 ) (<27·5 nmol/l: 2·8 %), Costa Rica( Reference Brehm, Celedón and Soto-Quiros 41 ) (<30 nmol/l: 3·5 %) and US children (<30 nmol/l: 1 %)( Reference Looker, Johnson and Lacher 38 ).
There may be several reasons for such a high level of vitamin D deficiency and insufficiency in Ecuadorian children. The oversampling of underweight children due to the weight-stratified sampling design of the original randomized controlled trial might have resulted in a selection bias in favour of a higher prevalence of vitamin D deficiency. In addition, the high altitude in Quito causes a cooler climate which leads to less skin exposure and cutaneous vitamin D synthesis. Further, in Ecuador, dairy products are not fortified with vitamin D, although there is a minor amount of vitamin D in margarine (50 µg (2000 IU)/kg). Alternative dietary sources of vitamin D (primarily oily fish, and to a minor extent beef liver, cheese and egg yolks) for children residing in the barrios were infrequently consumed. An evaluation of food intake of elderly living in the same neighbourhoods found minimal dietary sources of vitamin D in their diets( Reference Hamer, Sempértegui and Estrella 42 ).
Underweight children were twice as likely to have lower serum 25(OH)D concentration (<42·5 nmol/l) compared with normal-weight children (aOR=2·0; 95 % CI 1·2, 3·3). Studies of low-SES children in the Netherlands( Reference Voortman, van den Hooven and Heijboer 21 ), German adults( Reference Hintzpeter, Mensink and Thierfelder 43 ) and the elderly in England( Reference Hirani and Primatesta 44 ) found a similar risk of lower vitamin D status in underweight subjects compared with normal-weight subjects. The mechanism by which this occurs is unclear. A logical hypothesis is that being underweight is the result of reduced intake of both energy and micronutrients such as vitamin D. Our findings suggest that improved dietary vitamin D intake may have an important impact on vitamin D status in the underweight population.
In line with previous studies, we found that mean 25(OH)D serum concentration was higher in younger children (6–12 months) than older children (>12–36 months; MD=10·0 nmol/l; 95 % CI 6·7, 13·5 nmol/l)( Reference Voortman, van den Hooven and Heijboer 21 , Reference Looker, Johnson and Lacher 38 , Reference Absoud, Cummins and Lim 45 – Reference Weng, Shults and Leonard 48 ). However, in the logistic regression models this was not significant (OR=1·5; 95 % CI 0·87, 2·6). Sex was not associated with vitamin D status, which confirms findings in previous studies in young children( Reference Voortman, van den Hooven and Heijboer 21 , Reference Cole, Grant and Tangpricha 40 , Reference Gordon, Feldman and Sinclair 49 , Reference Sioen, Mouratidou and Kaufman 50 ).
Stunting has been repeatedly observed in the Andes( Reference Larrea and Freire 51 ). A report by the World Bank found that 23·2 % of Ecuadorian children under the age of 5 years are stunted( 52 ). We found much higher levels of stunting in our study population (62·2 %), which is partly due to sampling in a low-SES region of Quito as well as oversampling of underweight children. The study population resides in the Andean highlands of Ecuador, with topographically high altitudes. Prior studies have found that stunting is more common at high altitude( Reference Dang, Yan and Yamamoto 53 , Reference Román, Bejarano and Alfaro 54 ). National data show that children residing at 1500 m or higher above sea level are more likely to be stunted than those residing at lower altitudes( 52 ).
We also found that boys were more likely to be stunted than girls, which is consistent with the international literature( Reference Shrimpton, Victora and de Onis 55 , Reference Grantham-McGregor, Cheung and Cueto 56 ). Although improved access to sanitary facilities and potable water has been reported to reduce stunting( Reference Dangour, Watson and Cumming 57 – Reference Spears 59 ), we did not find any association between these household SES factors and stunting.
A strength of the current study is that children’s serum 25(OH)D concentrations were ascertained within a narrow time period (June–July). Thus, the effect of seasonality did not play a role in differences in vitamin D status. Other strengths include the large sample size and careful attention to anthropometric measurements. Furthermore, oversampling of undernourished children allowed us to assess differences between normal and undernourished groups more robustly than had we used a population-representative sampling strategy. We believe our empirical result of a cut-off of 42·5 nmol/l, which had the strongest statistical relationship to WAZ≤−1 and to HAZ≤−2 (online supplementary material, Supplemental Table 1), may be an important methodological finding.
It is important to note that our study has some inherent limitations. First, the findings may not be generalizable to all Ecuadorian children. The weight-stratified nature in which subjects were recruited into the original trial resulted in oversampling children in the underweight category. In addition, the study participants live in a specific peri-urban area of Quito with lower SES than other parts of Ecuador. A nationally representative study would better assess the vitamin D status in the country and is warranted based on our results.
Another limitation of the study is the lack of data on potential determinants of vitamin D status such as time spent outdoors, breast-feeding status, dietary sources, use of sunscreen and skin pigmentation( Reference Hossein-nezhad and Holick 60 ). Although cow’s milk is not fortified with vitamin D, several infant formula options are available in Ecuador and some are fortified with vitamin D. The duration of breast-feeding, whether infants were exclusively breast-fed and whether infant formula and/or cow’s milk were consumed once weaning occurred were not measured in this study population. This is a limitation in our study design as these would have been important variables to include in our analysis. Since breast-feeding and infant formula consumption were not assessed, it is not clear if differences in breast-feeding status or infant formula-feeding differed between malnourished and well-nourished children. Future studies should account for this in the study design.
Moreover, it is possible that genetic differences contribute to differences in vitamin D status and polymorphisms were not tested in the current study. There is a possibility that low vitamin D status could act as a marker for overall micronutrient deficiency. Due to limited serum volume, serum Zn levels could not be measured so we were unable to adjust for serum Zn levels, which may be a confounder in the observed association between low vitamin D levels and stunting, in our models. Finally, it is important to note that the cross-sectional design cannot ascertain causality between undernutrition and lower vitamin D status and cannot rule out reverse causation.
Conclusion
We empirically found that a cut-off of <42·5 nmol/l had the highest statistical association with underweight and stunting. In the current cross-sectional analysis of poor children residing in Quito which oversampled underweight children, we found 18·6 % of children had serum 25(OH)D level <42·5 nmol/l, 35·0 % of children with vitamin D level <50 nmol/l, and 46·1 % with serum level between 50 and 72·5 nmol/l. This is higher than expected given the equatorial latitude and high altitude. Since there are no nationally representative data on vitamin D deficiency in the Andes, studies evaluating other paediatric populations in Ecuador are warranted.
We found that children who were underweight were more likely to have lower level of serum 25(OH)D (<42·5 nmol/l) than normal-weight children. In addition, serum 25(OH)D level <42·5 nmol/l was strongly associated with stunting. These findings have important public health implications especially in low-SES populations. The role of vitamin D in stunting should be further evaluated. Our results suggest that strategies to improve vitamin D status in children through dietary diversification or food fortification could benefit the Ministry of Health’s efforts to reduce stunting in Ecuador.
Acknowledgements
Acknowledgements: The authors thank Danielle M. Enserro for her consultation with statistical analysis and Susan K. Fried for her thorough review of the manuscript. Financial support: This work was supported by the National Institutes of Health (grant number R01 HD038327); and a Sight and Life education grant. The funders had no role in the design, analysis or writing of this article. Conflict of interest: None. Authorship: R.R.M., F.S., J.K.G., B.E. and D.H.H. conceived this sub-study and study design; M.F.H. and D.H.H. had study oversight; F.S., J.K.G., B.E. and D.H.H. consulted for database clarification; R.R.M. and M.F.H. were responsible for laboratory analysis of assays and laboratory results; R.R.M., L.L.M. and M.P.F. designed the statistical analysis; R.R.M. analysed data; R.R.M. and D.H.H. drafted the manuscript; D.H.H. and M.F.H. had primary responsibility for final content of the manuscript; R.R.M., M.F.H., J.K.G., B.E., L.L.M., M.P.F. and D.H.H. revised the manuscript; and all authors read and approved the final version. Ethics of human subject participation: This study was conducted according to the guidelines laid down in the Declaration of Helsinki and all procedures involving human subjects/patients were approved by the Boston University Institutional Review Board and the Ethical Committee of the Corporación Ecuatoriana de Biotecnología (CEB). Written parental informed consent was obtained for each child who participated in the study.
Supplementary material
To view supplementary material for this article, please visit https://doi.org/10.1017/S1368980017002816


