


The UK government has slashed drinking guidelines, citing concerns about cancer, heart disease and other health risks( 1 ). Obesity is associated with cancer, heart disease and other health risks( Reference Di Angelantonio and Bhupathiraju Sh 2 ) and the government has also raised concerns about middle-aged people drinking too much and weighing too much( 3 ). Observational studies of alcohol consumption and obesity have produced conflicting findings( Reference Traversy and Chaput 4 , Reference Sayon-Orea, Martinez-Gonzalez and Bes-Rastrollo 5 ). There are many factors that make it difficult to determine the independent influence of alcohol on obesity( Reference Traversy and Chaput 4 ). It is particularly difficult to distinguish the influence of drinking frequency from drinking volume( Reference Traversy and Chaput 4 ). A frequent drinking pattern may go hand in hand with lifestyle choices that decrease the risk of obesity like taking exercise and eating fruits and vegetables( Reference Traversy and Chaput 4 , Reference French, Popovici and Maclean 6 ). Conversely, a high drinking volume may increase the risk of obesity( Reference Traversy and Chaput 4 ) and the risks of morbidity and mortality( 7 ). Socioeconomic factors may also confound the association between alcohol and obesity. Lower socioeconomic groups tend to make worse lifestyle choices than higher socioeconomic groups in the UK( Reference Newton, Briggs and Murray 8 , 9 ). At the same time, drinking volume tends to increase with socioeconomic status( 7 ). More research is required to clarify the link between alcohol intake and obesity and to explain the conflicting findings( Reference Traversy and Chaput 4 ). The objective of this cross-sectional study was to help clarify the association between alcohol and obesity using a pooled analysis of eleven population-based studies.
Methods
Participants
The Health Survey for England and the Scottish Health Survey are household-based surveillance studies that are described in detail elsewhere( Reference Craig, Deverill and Pickering 10 , Reference Craig, Mindell and Hirani 11 ). The present study included participants from the Health Survey for England in 1994, 1997, 1998, 1999, 2003, 2004, 2006 and 2008. The present study also included participants from the Scottish Health Survey in 1995, 1998 and 2003. The same organisation carried out the surveys using consistent methods( Reference Craig, Deverill and Pickering 10 , Reference Craig, Mindell and Hirani 11 ). The samples were selected using a multistage, stratified probability design to be representative of the target populations of the corresponding countries. Stratification was based on geographical areas and not on individual characteristics: postcode (zip code) sectors were selected at the first stage and household addresses selected at the second stage. Local research ethics committees approved all aspects of each survey and all participants gave written informed consent.
Independent variables
Trained interviewers asked participants about alcohol intake( Reference Craig, Mindell and Hirani 11 ). The interviewers could also ask those aged 18–24 years to fill in a booklet if they thought it would be difficult for them to give honest answers in front of other members of the household( Reference Craig, Mindell and Hirani 11 ). Participants were asked about whether they drank alcohol nowadays. Those who said not were asked whether they were always a non-drinker or whether they used to drink and had stopped. Drinkers were asked, ‘How often have you had an alcoholic drink of any kind during the last 12 months?’ And, ‘On how many days out of the last 7 did you have an alcoholic drink?’ Then, ‘Which day last week did you have the most to drink?’ Drinkers were also asked to describe the type or types of drink they had on that day. Total weekly alcohol units were calculated by summing the units of each type of beverage and multiplying by the frequency. In the UK, one unit is eight grams of alcohol, which roughly corresponds to a 25 ml measure of spirits or a half-pint of beer( 12 ); And, a 175 ml glass of wine contains two units of alcohol( 12 ). Alcohol drinking frequency was derived from six frequency categories: at least five times a week in the last 12 months; one to four times a week; one to two times a month; less than once every couple of months; former drinker of alcohol; and, never drinker of alcohol. Alcohol drinking volume was derived from six intake categories: harmful (≥49 units in men and ≥35 units in women); hazardous (21–48 units in men and 14–34 units in women), within guidelines (<21 units in men and <14 units in women); drinker, but not in last 7 d; former drinker of alcohol; and, never drinker of alcohol. The drinking guidelines used in the present study were those that existed in the UK at the same period of time as the surveys and binge drinking was defined as drinking double or more the limit on the heaviest day in past week (>8 units in men and >6 units in women)( 13 ).
Dependent variables
Trained interviewers measured weight and height( Reference Craig, Mindell and Hirani 11 ), and BMI was expressed as weight in kg divided by height in m2. Underweight was defined as BMI<18·5 kg/m2, normal weight as BMI 18·5–24·9 kg/m2, overweight as BMI 25–<30 kg/m2, and obesity as BMI≥30 kg/m2 ( 14 ). Weight was measured without shoes, heavy garments, heavy jewellery, loose change or keys. Height was measured with the participant in the Frankfort plane and without shoes. Trained nurses measured waist circumference at the midpoint of the iliac crest and costal margin (lower rib) and hip circumference at the widest point over the buttocks and below the iliac crest( Reference Craig, Mindell and Hirani 11 ). Waist and hip circumference were measured over light clothing. Abdominal obesity was defined as waist-hip ratio >0·90 in men and >0·85 in women( 15 ).
Potential confounders
The trained interviewers also asked about age, sex, smoking, physical activity, longstanding illness, psychological distress, occupation and fruit and vegetable intake( Reference Craig, Mindell and Hirani 11 ). Participants were asked, ‘Do you smoke cigarettes at all nowadays?’ Those who answered yes were regarded as current smokers. The questionnaires used to assess physical activity in the Health Survey for England and Scottish Health Survey are described in detail elsewhere( Reference Stamatakis, Hillsdon and Primatesta 16 ). Participants were regarded as physically active if they reported meeting current physical activity guidelines of at least 150 min/week of moderate-intensity physical activity, at least 75 min/week of vigorous-intensity physical activity, or equivalent combinations( 17 ). Longstanding illness was defined as any illness, disability or infirmity that had troubled the respondent over a period of time or was likely to affect them over a period of time. A longstanding illness was regarded as limiting if the respondent said that it limited their activities in any way. The twelve-item General Health Questionnaire was used to assess current mental health and a score of four or more was used to define psychological distress( Reference Goldberg, Gater and Sartorius 18 , Reference Goldberg and Williams 19 ). Socioeconomic status was assessed using the four-group version of the Registrar General’s classification: professional and managerial occupations; skilled, non-manual occupations; skilled manual occupations; and, routine and manual occupations. Participants in more recent surveys were asked how many fruit and vegetables they ate yesterday and whether it was more or less than usual.
Statistical analysis
Multinomial logistic regression was used to investigate associations between alcohol and BMI, a nominal dependent variable with more than two levels. Logistic regression was used to investigate associations between alcohol drinking and abdominal obesity, a dependent variable with two levels. The reference category for the dependent variable was normal BMI or normal waist-hip ratio. OR and 95 % CI were calculated for risk of obesity according to alcohol drinking with the reference group being those who reported drinking alcohol at least five times a week in the last 12 months. Regression models were adjusted for potential confounders, including age, sex, smoking, physical activity, longstanding illness, psychological distress and socioeconomic status. Cigarette smoking was categorised into five groups: never regular smoker; ex-smoker; less than ten per day; ten to nineteen per day; twenty or more per day. Physical activity was also categorised into two groups: meeting physical activity guidelines or not. Longstanding illness and psychological distress was also dichotomous variables: yes or no. Socioeconomic status was categorised into the four groups of the Register General’s classification. In secondary analyses, we investigated associations in the sub-samples of men and women and the subsample that reported fruit and vegetable intake. In sensitivity analyses, we excluded participants with diabetes or CVD. All analyses were performed using SPSS version 22 (IBM Inc.).
Results
Participant characteristics
The core samples of the Health Survey for England and the Scottish Health Survey are designed to be representative; however, missing data may introduce bias in sub-samples. BMI was not measured in 13 876 adults and BMI was the main cause of missing data. Those excluded because of missing BMI were older than those included in the present study (60 v. 47 years, P<0·001), were more often female (62 v. 53 %, P<0·001), and were of lower socioeconomic status (3·9 v. 4·9 % in professional and managerial occupations, P<0·01). There were 106 182 participants in the present study (46·7 % male; 53·3 % female; mean 46·9 (sd 16·9) years of age). Table 1 shows participants’ characteristics according to drinking frequency. Some 18 % of participants reported drinking alcohol at least five times a week in the last 12 months, 45·2 % reported drinking alcohol one to four times a week, 13 % reported drinking alcohol one to two times a month, 14 % reported drinking alcohol less than once every couple of months, 3·8 % reported being former drinkers of alcohol and 6·4 % reported never being drinkers of alcohol. Those who reported drinking alcohol at least five times a week in the last 12 months included a higher proportion of men, a higher proportion in professional and managerial occupations, and a higher proportion of binge drinkers than those who reported drinking alcohol less frequently. The proportion of obese individuals was lower in those who reported drinking alcohol at least five times a week and those who reported drinking alcohol one to four times a week than those who reported drinking alcohol less frequently. The proportion meeting physical activity guidelines was higher in those who reported drinking alcohol at least five times a week, those who reported drinking alcohol one to four times a week, and those who reported drinking alcohol one to two times a month than those who reported drinking alcohol less frequently. There were no obvious relationships between age and drinking frequency, smoking and drinking frequency or psychological distress and drinking frequency. Abdominal obesity was present in 60·7 % of men and only 26·4 % of women, which may explain why there was no obvious relationship between abdominal obesity and drinking frequency in the whole sample. Less than 10 % of participants were aged 18–24 years and were eligible to fill in a booklet if they wished; And, the removal of these individuals did not change the results.
Table 1 Participants’ characteristics according to drinking frequencyFootnote * (Percentages; mean values and standard deviations)
* Sample size is 106 182 except abdominal obesity, where sample size is 71 990. Obese is BMI≥30 kg/m2. Abdominally obese is waist:hip ratio >0·90 in men and >0·85 in women. Binge drinking is drinking double or more the limit on heaviest day in past week (>8 units in men and >6 units in women). Physically active is meeting current physical activity guidelines of at least 150 min/week of moderate-intensity physical activity, at least 75 min/week of vigorous-intensity physical activity or equivalent combinations. Longstanding illness is any illness, disability or infirmity that troubled the participant over a period of time. Psychological distress is a General Health Questionnaire score of four or more. Professional occupation is professional or managerial occupation according to the Register General’s classification.
Primary analyses
Some 39 % of participants were overweight and 21·6 % obese. Fig. 1, top, shows the association between drinking frequency and obesity in 106 182 participants. Compared with those who reported drinking alcohol at least five times a week in the last 12 months, the risk of obesity rose in those who reported drinking alcohol less frequently before falling in those who reported being former drinkers of alcohol and falling again in those who reported never being drinkers of alcohol (a bell-shaped association). Fig. 1, middle, shows the association between alcohol volume and obesity in 49 073 participants. Compared with those who reported drinking a harmful volume of alcohol in the last 7 d, the risk of obesity was not significantly different in those who reported drinking a hazardous volume of alcohol in the last 7 d, was lower in those who reported drinking a volume of alcohol that was within the guidelines, and was lower in those who reported being former drinkers of alcohol and those who reported never being drinkers of alcohol (a linear association). Fig. 1, bottom, shows the association between drinking frequency and obesity after adjustment for drinking volume. Drinking volume had a positive confounding effect on the association between drinking frequency and obesity (the observed association was biased away from the null) (online Supplementary Table S1 shows the numbers in each group, the OR and the 95 % CI). The online Supplementary Table S2 shows the associations of drinking frequency and drinking volume with overweight. Abdominal obesity was present in 42·5 % of the present sample. Fig. 2 shows the association between drinking frequency and abdominal obesity in 71 990 participants. Compared with those who reported drinking alcohol at least five times a week in the last 12 months, the risk of abdominal obesity was not significantly different in those who reported drinking one to four times a week or one to two times a month; however, the risk of abdominal obesity was higher in those who reported drinking less than once every couple of months, those who reported being former drinkers of alcohol, and those who reported never being drinkers of alcohol.
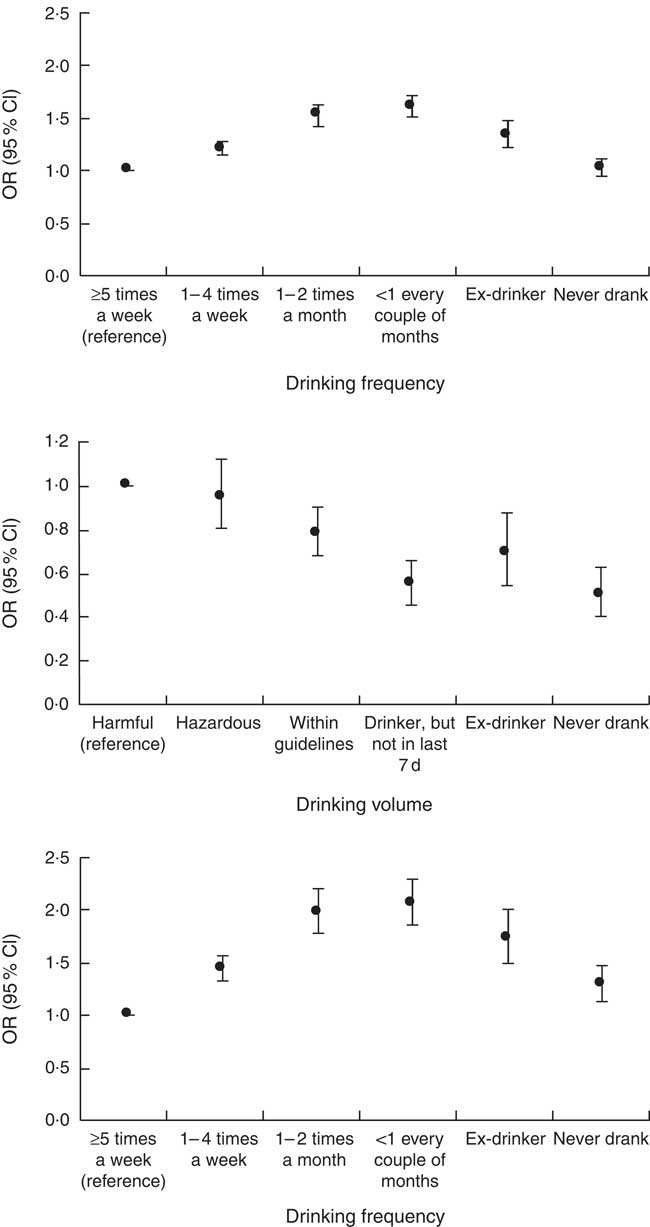
Fig. 1 Associations of drinking frequency and drinking volume with obesity. Top: association between drinking frequency and obesity in 106 182 adults. Middle: association between drinking volume and obesity in 49 073 adults. Bottom: association between drinking frequency and obesity after adjustment for drinking volume in 48 905 adults. The reference category for the dependent variable was normal BMI. Multinomial regression models were adjusted for age, sex, smoking, physical activity, longstanding illness, psychological distress and socioeconomic status. Underweight individuals were removed. Normal weight was defined as BMI 18·5–24·9 kg/m2, obesity as BMI≥30 kg/m2, overweight as BMI 25–<30 kg/m2 and underweight as BMI <18·5 kg/m2. The numbers in each group, the OR and the 95 % CI are reported in the online Supplementary Table S1.
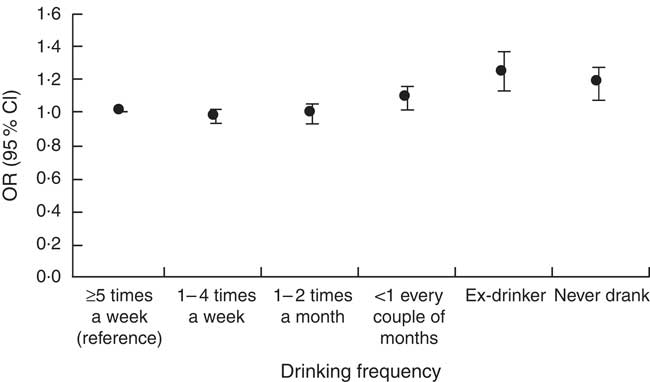
Fig. 2 Association between drinking frequency and abdominal obesity in 71 990 adults. The reference category for the dependent variable was normal waist:hip ratio. Logistic regression models were adjusted for age, sex, smoking, physical activity, longstanding illness, psychological distress and socioeconomic status. Abdominal obesity was defined as a waist:hip ratio >0·90 in men and >0·85 in women. The numbers in each group, the OR and the 95 % CI are reported in the online Supplementary Table S4.
Secondary analyses
The online Supplementary Table S3 shows the associations of drinking frequency with overweight and obesity in 49 530 men and 56 526 women. In men, the association between drinking frequency and obesity was bell-shaped, with obesity risk not significantly different between those who drank most often and those who were ex-drinkers or had never drunk. In women, compared with those who reported drinking alcohol at least five times a week in the last 12 months, the risk of obesity rose in those who reported drinking one to four times a week (OR 1·36; 95 % CI 1·26, 1·46), rose again in those who reported drinking alcohol one to two times a month (OR 1·89; 95 % CI 1·73, 2·06), and rose still in those who reported drinking alcohol less than once every couple of months (OR 2·03; 95 % CI 1·87, 2·20); the risk of obesity fell but remained significantly different in women who reported being former drinkers of alcohol (OR 1·76; 95 % CI 1·56, 1·99) and women who reported never being drinkers of alcohol (OR 1·47; 95 % CI 1·33, 1·64). The online Supplementary Table S4 shows the association between drinking frequency and abdominal obesity in 33 803 men and 38 187 women. The associations were similar in the entire sample and the sub-samples. The online Supplementary Table S5 shows that the associations between drinking frequency and overweight and obesity were similar with adjustment for fruit and vegetable consumption (n 48 905). The online Supplementary Table S6 shows that the associations between drinking frequency and overweigh and obesity were similar after excluding those with diabetes or CVD (n 93 542).
Discussion
The objective of this cross-sectional study was to help clarify the association between alcohol and obesity. The association between drinking frequency and obesity was bell-shaped, with obesity risk not significantly different between those who drank most often and those who had never drunk. The association between drinking volume and obesity was linear, with obesity risk lowest in those who had never drunk. Drinking volume had a positive confounding effect on the association between drinking frequency and obesity, which may help explain the conflicting findings of other studies.
This study has some notable strengths but also some limitations. The main strengths are the large sample size, the detailed characterisation of drinking frequency, the detailed characterisation of drinking volume, and the adjustment for several potential confounders. The main limitation is the cross-sectional design, where independent and dependent variables are assessed at the same time. Alcohol intake, fruit and vegetable intake and physical activity were self-reported. Participants were asked about their mental health in the last 4 weeks, their drinking frequency in the last 12 months, and their drinking volume in the last 7 d and we cannot exclude the possibility that those with a long-term history of depression drink less alcohol( Reference Touvier, Druesne-Pecollo and Kesse-Guyot 20 ). Beer is carbohydrate rich and provides more energy than wine per standard drink( 21 ). No adjustment for alcohol type was made in the present study; however, men are more likely to drink beer and women are more likely to drink wine( Reference Traversy and Chaput 4 ); and, associations between alcohol and obesity were investigated separately in men and women. Beer and spirit drinkers appear to have poorer diets than wine drinkers( Reference Traversy and Chaput 4 ) and an adjustment for fruit and vegetable intake was also made. No adjustment was made for sleeping habit (insufficient sleep may be associated with greater alcohol consumption and excess body weight( Reference Traversy and Chaput 4 )). Data from sub-samples of the Health Survey for England and the Scottish Health Survey may not be representative of the target populations.
Observational studies of alcohol consumption and obesity have produced conflicting findings: some show a positive association, some show a negative association and some show no association( Reference Traversy and Chaput 4 , Reference Sayon-Orea, Martinez-Gonzalez and Bes-Rastrollo 5 ). Many factors are thought to explain these conflicting findings and a better characterisation of those more likely to be obese with alcohol has been called for( Reference Traversy and Chaput 4 ). It has been suggested that individuals who frequently drink moderate amounts of alcohol may enjoy a healthier lifestyle in general that may protect them from weight gain( Reference Traversy and Chaput 4 ). In a sample of 230 856 adults representative of the US population, it was found that men and women who frequently drank were far more likely to exercise vigorously than abstainers( Reference French, Popovici and Maclean 6 ). Those who drank most often in the present study were more physically active and were less likely to be obese than those who drank less than once every couple of months and those who were ex-drinkers. The detailed characterisation of drinking in the present study may explain the conflicting findings of other studies. The association between drinking frequency and obesity was bell-shaped, with obesity risk not significantly different between those who drank most often and those who had never drunk. Drinking volume had a positive confounding effect on the association between drinking frequency and obesity; that is, the observed association was biased away from the null.
Compared with women who reported drinking alcohol at least five times a week in the present study, the risk of obesity was higher in women who reported being former drinkers of alcohol and women who reported never being drinkers of alcohol. These data suggest that abstinence increases the risk of obesity in women. Although there is conflicting evidence( Reference Topiwala, Allan and Valkanova 22 ), a frequent but moderate drinking pattern may be part of a healthy lifestyle( Reference Traversy and Chaput 4 , Reference French, Popovici and Maclean 6 ) and longitudinal data from the Health Survey for England and the Scottish Health Survey suggest that there may be safe limits in relation to mortality risk( Reference Knott, Coombs and Stamatakis 23 , Reference Perreault, Bauman and Johnson 24 ). For example, Perreault et al.( Reference Perreault, Bauman and Johnson 24 ) investigated the joint association of alcohol and physical activity with mortality in 36 370 adults followed for 9·7 (sd 4·3) years and found that all-cause mortality risk was considerably attenuated and cancer mortality risk was nearly nullified in those who met physical activity guidelines. In the same study, CVD mortality risk was lower in occasional drinkers than never drinkers (occasional drinkers were those who declared being drinkers but reported not drinking in the last 7 d; never drinkers were those who reported never having consumed alcohol)( Reference Perreault, Bauman and Johnson 24 ).
The present study may help to clarify the association between alcohol and obesity. The present study suggests that the association between drinking frequency and obesity is bell-shaped, with obesity risk not significantly different between those who drink most often and those who have never drunk. The present study also suggests that drinking volume has a positive confounding effect on the association between drinking frequency and obesity. More longitudinal research is required to clarify the independent associations of drinking frequency and drinking volume with obesity.
Acknowledgements
G. O. and M. H. acknowledge support from the National Institute for Health Research (NIHR) Leicester Biomedical Research Centre, which is a partnership between University Hospitals of Leicester National Health Service (NHS) Trust, Loughborough University and the University of Leicester.
E. S. is funded by the National Health and Medical Research Council through a Senior Research Fellowship. The views expressed are those of the authors and not necessarily those of the NHS, the NIHR or the Department of Health. The present study received no specific funding.
G. O. conceived the study. E. S. acquired the data and harmonised the data sets. M. H. carried out the statistical analysis. All authors contributed substantially to the study design, data interpretation and writing of the manuscript. M. H. is the guarantor and takes responsibility for the content of the manuscript, including the data and the analysis.
None of the authors has any conflicts of interest to declare.
Supplementary Material
For supplementary material/s referred to in this article, please visit https://doi.org/10.1017/S000711451700352X


