


Introduction
Most of our understanding of the evolution and early history of life on Earth comes from the fossilized remains of microorganisms. As one goes back in time, however, microorganisms take on more simple morphologies, and are often more poorly preserved, so it becomes extremely difficult to differentiate signs of life from co-occurring mineral artifacts. The most famous case in point is that of filamentous microstructures in 3.46 billion-year-old rocks (the “Apex chert”) from Western Australia. These filaments have been claimed to represent the oldest morphological evidence of life on Earth [Reference Schopf and Packer1–Reference Schopf3], but their biological nature has been questioned on numerous occasions [Reference Brasier4–Reference Marshall8], and this has led to one of the longest running and most controversial debates in palaeontology.
The Apex chert “microfossils” first entered the literature in 1987 [Reference Schopf and Packer1] and were described in detail in the early 1990s [Reference Schopf2, Reference Schopf3], where it was claimed that they were the remains of at least eleven different species of filamentous prokaryotes. During the 1990s these objects became entrenched in textbooks as the earliest evidence of life on Earth, were taken by many to signal an early evolution of cyanobacteria [Reference Dalton9], and were used as classic examples of what ancient microfossils should look like when claims of life in the Martian meteorite ALH 84001 [Reference McKay10] were being rejected. With the technology available in the late 1980s, an interpretation of the filaments being the remains of primitive bacteria was reasonable; after all, the filaments are carbonaceous and appear to be segmented in a way that resembles chains of cells (Figure 1).
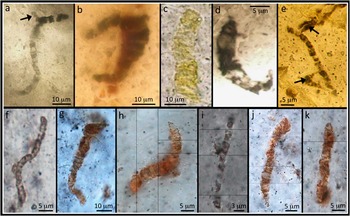
Figure 1 (a-e) Microfossil-type specimens from the 3.46 billion-year-old Apex chert. Note the wide variation in color and the presence of branching structures (arrows) that cast doubt on their interpretation as primitive bacterial microfossils. (f–k) Selection of filaments closely comparable to the type specimens, from new material studied here using electron microscopy.
In 2002 the authenticity of the Apex chert microfossils was seriously challenged [Reference Brasier4]. New geological mapping showed that the geological context of the microfossils had been misinterpreted. They do not occur in a sedimentary unit as previously claimed but within hydrothermal veins, a high-temperature environment much less conducive (but not impossible) for life. In addition, computer-aided montage images of the type microfossils showed clear evidence of branching (a trait not present in very primitive bacteria) and distribution of carbon around the margins of mineral crystals (Figures 1a and 1e) [Reference Brasier4]. It was also noted that the filaments do not exhibit biological behavior; instead they are solitary, irregular, and randomly orientated. A number of the filaments are rather light in color, with yellow, orange, and light brown examples [Reference Brasier5–Reference Brasier6]. This is in contrast to other reports of early Archean carbon that illustrate a dark brown to black color, perhaps casting doubt on their age. Furthermore, the claimed diversity of species is particularly vast, with comparable diversity not seen in the geological record until some 1.5 billion years later [e.g., Reference Barghoorn and Tyler11], which makes it difficult to reconcile the microfossils with accepted evolutionary theory.
The combined evidence led to a new hypothesis that the microfossils had a geological rather than biological origin, that is, they were in fact carbonaceous mineral rims that formed around recrystallizing grain margins during a complex series of hydrothermal events [Reference Brasier4]. For the past 13 years, the debate over these microfossils has been vigorous. Additional petrographic and geological mapping appears to support a mineral rim [Reference Brasier5–Reference Brasier6] or related non-biological [Reference Pinti7–Reference Marshall8] hypothesis, whereas more sophisticated analyses of the carbon in the microfossils using confocal laser Raman microspectroscopy and confocal laser scanning microscopy have produced data consistent with (but not uniquely attributable to) a biological formation mechanism [Reference Schopf and Kudryavtsev12–Reference Schopf and Kudryavtsev13].
The main analysis problem has been one of a lack of spatial resolution. Previously it has not been possible to really get to the bottom of what these microstructures are made of, in particular how the carbon is distributed at the sub-micrometer scale, and whether this is compatible with cellular life. In this article we use a combination of focused ion beam (FIB) milling, transmission electron microscopy (TEM), and scanning electron microscopy (SEM) to decode the nano-scale morphology and chemistry of the Apex filaments and determine their origin (also see [Reference Wacey14–Reference Brasier15]).
Materials and Methods
The material studied here comes from the original “microfossil” locality described in [Reference Schopf2, Reference Brasier4–Reference Brasier6]. Analysis of the original “microfossil” type specimens (Figures 1a–1e) was compromised by the 193–380 μm thick preparations [Reference Brasier5] making optical petrography difficult. There is also an understandable prohibition (by the Natural History Museum, London) on destructive or intrusive techniques, meaning, for example, that high spatial resolution EM approaches cannot be performed on the original type specimens. The materials studied here are therefore standard (~30 μm thick) polished geological thin sections (Figures 1f–1k), making light optical characterization more straightforward and allowing the application of a range of high spatial resolution analytical techniques. Light microscopy shows that the filamentous microstructures found in our material are identical to the original type specimens, in terms of their morphology, abundance, and petrographic distribution.
Focussed ion beam (FIB) preparation of TEM thin specimens
Prior to FIB milling the thin sections were examined by light microscopy, 2D and 3D laser Raman, and SEM to gain an understanding of the filament distributions and morphologies and to select the most appropriate targets for detailed study. The TEM specimens were prepared using two dual-beam FIB systems (FEI Nova NanoLab and FEI Helios NanoLab G3) located respectively at the Electron Microscopy Unit (EMU), University of New South Wales, and the FEI factory, Brno, Czech Republic. Thin specimens were, on average, 15 μm × 8 μm × 100 nm and were attached to Omniprobe® copper TEM holders using platinum connector strips or deposited on continuous carbon TEM grids.
TEM analysis of FIB-milled thin specimens
TEM data were obtained using a FEI Titan G2 80-200 TEM/STEM with ChemiSTEM elemental X-ray mapping technology operating at 200 kV, located in the Centre for Microscopy, Characterisation and Analysis (CMCA) at The University of Western Australia. Data included high-angle annular dark-field (HAADF) scanning transmission electrom microscopy (STEM) images, EDS (ChemiSTEM) maps, and electron diffraction for mineral phase identification.
FIB-SEM 3D nano-tomography
FIB milling and SEM imaging were performed on a Zeiss Auriga Crossbeam dual-beam instrument at EMU. The protocol was a modified version of that described in [Reference Wacey16], with milling and imaging parameters optimized to suit the type of sample (that is, carbon, iron oxides, and phyllosilicates within a silica matrix). Regions of interest (ROI) were covered with a protective (about 1μm thick) platinum layer, then front and side trenches were milled with a 10 nA Ga+ ion beam. An additional gold coat was then applied, and the sample was heated in an oven at ~50 °C overnight to minimize any instability caused by degassing during the opening of the trenches. The front face of the ROI was then cleaned and polished using a 2 nA beam current. Imaging was performed at 5 kV using the backscattered electron (BSE) detector in order to minimize charging effects and maximize the contrast between mineral phases of differing masses. Sequential slices were milled with a 2 nA Ga+ beam current, and the slice spacing was 200 nm. Each newly milled face was imaged (2048 × 1536 pixels) with an image capture time of ~80 seconds to obtain images of high enough quality for subsequent 3D reconstruction. Qualitative elemental mapping of selected FIB-milled faces was performed using an Oxford X-max SDD energy dispersive X-ray spectrometry (EDS) system, with detection limits of about 1 atomic % to confirm that the chemistry correlated with the morphological features observed.
3D reconstruction and visualization
Sequential FIB-SEM nano-tomography images were stacked, aligned, and cropped using SPIERSalign [Reference Sutton17]. The resultant stacks were imported into AVIZO 8.0 where carbonaceous material was segmented allowing 3D models of the carbon associated with the filaments to be produced. The models were visualized and rendered in AVIZO 8.0, and images were captured from multiple orientations in 3D space.
Results
TEM analyses of ultrathin specimens through Apex filaments reveal filament morphologies at the sub-micrometer scale that are characteristic of a mineralic origin, with complex intergrowths of mineral phases (Figures 2 and 3). Each filament is made up of multiple plate- or sheet-like grains of phyllosilicate (Figures 2b and 3b, green), located within a matrix of microcrystalline quartz. Occasionally quartz is also seen inter-grown with the phyllosilicate within a filament (Figure 3b). ChemiSTEM mapping shows that the phyllosilicate mineral(s) contain the elements K, Al, Si, and O, plus variable amounts of Ba and minor Mg. Electron diffraction patterns of this mineral obtained in the TEM possess d-spacings consistent with a 2:1 layered phyllosilicate crystal lattice structure (Figures 3d–3e). This structure is found in micas such as muscovite and in some clay minerals [Reference Deer18]. The nano-morphology of the phyllosilicate, appearing as a worm-like stack of crystals, closely resembles vermiculite, a common alteration product of mica. However, the chemical composition is spatially heterogenous on the nano- to micro-scale. This, together with the presence of barium, suggests that the phyllosilicate is likely a complex hydrothermal association of mica alteration products that are best termed vermiculite-like.
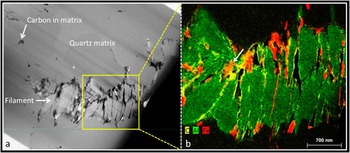
Figure 2 (a) HAADF-STEM image of a filament from the 3.46 billion-year-old Apex chert. b) False color ChemiSTEM three-element overlay X-ray emission map of area boxed in (a). The filament comprises stacks of sheet-like phyllosilicate grains (green) with carbon (yellow) and iron (red) interleaved between some of the sheets and around some of the filament margins. This distribution of phases is incompatible with a biological origin for the filament. In places, carbon completely coats the iron phase (arrow) suggesting carbon is the last phase to become associated with the filaments, again incompatible with a biological origin.
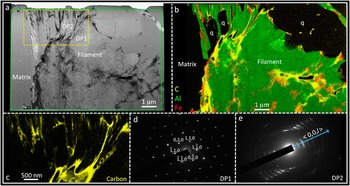
Figure 3 (a) HAADF-STEM image of a second filament from the Apex chert. (b) ChemiSTEM elemental X-ray emission map of the area indicated by the green box in (a) where green is aluminium from phyllosilicate, red is iron from iron oxide, and yellow is carbon. A number of quartz grains (q) are also intermixed with the phyllosilicate sheets within the filament. (c) Higher-magnification ChemiSTEM carbon map of the region indicated by the yellow box in (a), emphasizing how narrow strings or sheets of carbon (yellow) are interleaved with phyllosilicate and quartz grains (black). (d–e) Selected area electron diffraction patterns from the regions of the TEM wafer indicated in (a). DP1 is consistent with the [001] zone axis pattern from a 2:1 phyllosilicate. DP2 shows a pattern of ring arcs, representative of a set of closely aligned grains of a 2:1 phyllosilicate with the incident beam parallel to the {00l} plane (adapted with permission from [Reference Wacey14]).
Further ChemiSTEM mapping shows that carbon (Figures 2b, and 3b–3c, yellow) and iron (Figures 2b and 3b, red) are closely associated with the phyllosilicate filaments. Both carbon and iron are seen interleaved between sheets of phyllosilicates within the body of the filaments; these elements also coat the outer margins of some parts of the filaments. In addition, carbon occurs away from the filaments within the quartz matrix where it forms a boundary phase between quartz grains (Figure 2a). These data indicate significant redistribution of carbon both within and around the Apex filaments, in marked contrast to patterns found by us in bona fide fossil microbes from younger rocks [Reference Wacey16, Reference Wacey19]. Carbon interleaved between phyllosilicates within the filaments may resemble “cellular compartment walls” when investigated with lower spatial resolution (for example, in light microscopy or Raman work [Reference Schopf and Kudryavtsev12–Reference Schopf and Kudryavtsev13]). Our higher spatial resolution analysis of supposed “cellular compartments” instead reveals very inconsistent compartment lengths (from <50 nm up to about 1 μm), with length/width ratios that match crystal growth patterns and are unlike any known microbial cells.
Three-dimensional FIB-SEM data reveal further complexities to the filaments and additional insights into carbon distribution in their vicinity (Figure 4). These data demonstrate how the morphology of the filaments changes quite significantly over spatial scales of only a few micrometers along the length of a filament. In some FIB slices, their filamentous nature is clear, and books of phyllosilicate crystals appear neatly stacked, whereas in other slices the filaments are seen to branch or suddenly thicken (Figure 4). Furthermore, SEM highlights a number of nano-cracks within the chert matrix; these often feed right into the filaments and are filled with black material. This black material was identified as carbon from X-ray maps, but the raw data for Figure 5 comes from SEM morphology images, which can be acquired much more quickly than X-ray maps. The 3D reconstruction and visualization of the carbon from Apex filaments (Figure 5) reveals additional features that are essentially hidden in 2D images. These include branches extending below the main body of filaments (Figure 5c) and patches of carbon outside the main body of filaments (Figure 5e), as well as emphasizing the rather linear, sheet-like nature of much of the carbon sandwiched between the phyllosilicate grains (Figure 5f). Like the TEM data, the 2D and 3D SEM data are incompatible with these filaments being fossils of filamentous organisms.
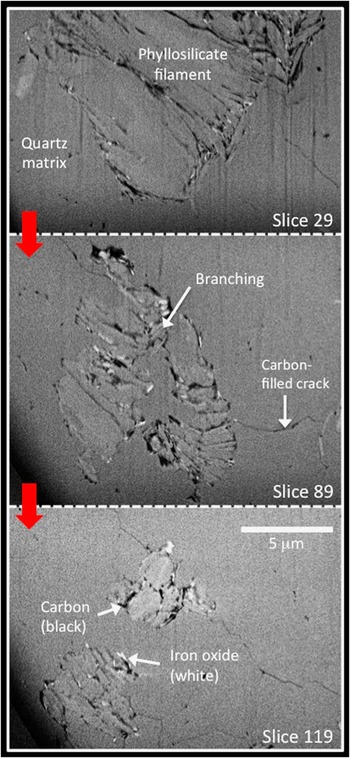
Figure 4 Variation in morphology of an Apex filament. BSE SEM images of 3 out of 200 successive FIB-milled slices through a filament. The space between individual slices is 200 nm, hence slice 89 is 12 μm further along the filament from slice 29, and slice 119 is 6 μm further along from slice 89. Uniform mid-gray is the quartz matrix, slightly lighter gray sheet-like material stacked together in complex book-like patterns is the phyllosilicates, black is carbon, and the brightest white is an Fe-rich mineral. Carbon coats many of the individual phyllosilicate sheets in the book-like stacks. Carbon also occurs in a number of nano-cracks that, in places, join the filaments. The morphology of the filament changes considerably along its length, and it branches at depth below the surface of the thin section (see slice 89). The morphology and distribution of carbon are incompatible with a biological origin for the filament.
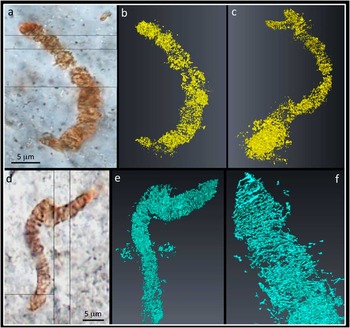
Figure 5 3D reconstruction of Apex filaments. (a) Transmitted light photomicrograph of a filament. (b) 3D visualization of carbon from FIB-SEM images through the filament, shown in the same orientation as (a). (c) 3D model rotated to show small branch extending down below the main body of the filament, not seen in (a–b). (d) Transmitted light photomicrograph of a second filament. (e) 3D visualization of carbon from FIB-SEM images through the filament, shown in the same orientation as (d). Note patches of carbon outside the main body of the filament. (f) 3D model rotated and enlarged to highlight the linear nature of much of the carbon coating the phyllosilicate grains.
Discussion
These new electron microscopy data clearly show that the carbon distribution in the Apex filaments is not comparable with true cellular morphology. This means that an alternative explanation must be sought for the origin of these filaments. Our explanation builds upon previous theories of a non-biological mineral origin [Reference Brasier4–Reference Brasier6], but we are now able to be much more specific with our model. A three-stage model is now put forward: (1) hydration of mica flakes (abundant in the surrounding rocks) during widespread hydrothermal activity resulting in vermiculite-like phyllosilicate formation; (2) continued heating plus expulsion of water from phyllosilicate crystal lattices, causing exfoliation (i.e., accordion-like expansion at right angles to the cleavage plane) and creating the initial worm-like filamentous morphological expression of microfossil-like artifacts; and (3) adsorption of later hydrocarbons (and locally additional iron) onto the phyllosilicate grains, mimicking cell walls. It is notable that exfoliated vermiculite has high adsorption capacity for hydrocarbons resulting from the strong capillary action of slit-like pores between plate-like grains. Today vermiculite is used extensively for cleaning up oil spills [Reference Medeiros20].
This work has important implications for the evaluation of primitive life on Earth and, by extension, in extraterrestrial settings. Herein, candidate microfossils that appear to pass most currently accepted biogenicity criteria when examined at the micrometer scale have been shown to fail several criteria when examined at the sub-micrometer scale. Hence, future work should focus on the refinement of biogenicity criteria using bone-fide microfossils and definitive non-biological microfossil-like artifacts examined at the sub-micrometer scale.
Conclusion
Analysis of new material from the Apex chert “microfossil locality” using high spatial resolution electron microscopy has demonstrated that filamentous microstructures, previously thought to be Earth’s oldest microfossils, are in fact mineral artifacts comprising stacks of phyllosilicate grains onto which later carbon adsorbed. Rather than being fossilised microorganisms, we interpret the filaments as resulting from the alteration and exfoliation of flakes of mica, plus the redistribution of barium, iron, and carbon during repeated episodes of fluid movement within a hydrothermal system.
Acknowledgements
We acknowledge the facilities and scientific and technical assistance of the Australian Microscopy & Microanalysis Research Facilities at: Centre for Microscopy Characterisation and Analysis, The University of Western Australia; Electron Microscopy Unit, The University of New South Wales. These facilities are funded by the Universities, State, and Commonwealth Governments. David Wacey acknowledges funding from the European Commission and the Australian Research Council. Anthony Burgess from FEI is thanked for the preparation of one of the TEM wafers.


