
INTRODUCTION
It is rare for most people in the United States to think about the water that comes out of their tap in the morning as they brush their teeth, fill the coffee maker, or take a shower. They even think less about the sanitation system into which they flush their toilet. In spite of this, it is estimated that more than 540,000 households reported lack of access to complete plumbing facilities in 2012. Footnote 1 If we assume that there are two to three people present per household, Footnote 2 this means that between 1.4 to 1.7 million people lacked access to a tub or shower, hot and cold water pipes, and/or a flushing toilet. This is not just an anomalous population. Lack of access to water is typically seen as an outcome of poverty (Brown and Ingram, Reference Brown and Ingram1987; Wescoat et al., Reference Wescoat, Halvorson, Headington, Replogle, Mutz, Bryner and Kenney2002; Wescoat et al., Reference Wescoat, Headington and Theobald2007), but at the same time, it is also regarded as a significant cause of poverty (Kulindwa Reference Kulindwa and Øyen2005). Although poverty exists in both developing and developed nations, lack of water and sanitation is overwhelmingly viewed as an issue only associated with the developing world (Wescoat et al., Reference Wescoat, Headington and Theobald2007). Given the racialization of poverty in the United States (Harris and Wilkins, Reference Harris and Wilkins1988), the lack of attention to this issue is significant.
Yet what might be even more significant is how two predominantly African-American cities in the United States “rust belt” (the iconic auto-manufacturing hubs of Detroit and Flint, Michigan) helped thrust the issue of access to water into the national news in 2015. This attention came about because of the outcry over high water rates, aggressive water shutoffs for tens of thousands of households, and a disastrous mandated switch of water sources that left the nearly 100,000 residents in the city of Flint, Michigan with water that had dangerously high lead levels, among other toxins. Footnote 3 Thus, the question this paper explores is whether these particular cases are anomalous or whether these cases are indicative of a larger national trend of disproportionate problems with lack of access to complete and reliable basic services in non-White communities. We situate this question within a larger discussion of structural racism in order to understand the variability of water access throughout the country.
In this paper, we use spatial and social statistics to analyze the extent to which access to water and sanitation is associated with race. In particular, we examine the relationship between race and access to complete plumbing facilities, given available data sources. The implications of the findings from this analysis point to a legacy of structural racism, where investments were not made for those pushed to marginal places in society, be they Indian reservations, counties with migrant farmworkers, or postindustrial “rust belt” cities. But there is another key point: this analysis is limited by lack of available data that would help us tease out the full scope of the problem and the mechanisms that have jeopardized access to plumbing. While this is a limitation to our paper, we emphasize the lack of data collection and precision as a key concern in addressing equitable access to basic services in the future.
THE HUMAN RIGHT TO WATER AND SANITATION
A distinguishing feature of the media coverage of the water crises in Flint and Detroit, Michigan has been the linking of those incidents by activists to calls for respect of the human right to water and sanitation (HRWS) (Chapman Reference Chapman2014; Southhall Reference Southall2016). Long fought for by anti-water privatization and other water activists, this right was finally recognized by United Nations General Assembly (UNGA) and the UN Human Rights Council (OHCHR) Footnote 4 in 2010 (Bakker Reference Bakker and Mansfield2008; Barlow Reference Barlow2011; Gleick Reference Gleick1999; MacDonald Reference MacDonald2005). There are three important features of the UN resolutions:
-
1. the resolutions recognize water and sanitation explicitly as basic human rights, meaning that nation-states and powerful non-state actors have duties and obligations to ensure those rights on the basis of established human rights principles—nondiscrimination being critical in our case;
-
2. this means that all members of society are entitled to these rights, a change from the development discourse about water and sanitation coverage as a question of proportional targets;
-
3. the establishment of an OHCHR Special Rapporteur on Water and Sanitation to monitor implementation (see de Albuquerque Reference de Albuquerque2012; Lukacs Reference Lukacs2014; Winkler Reference Winkler2012).
While much of the work of the Special Rapporteur has been in developing countries like Bolivia, Botswana, India, and South Africa, the Special Rapporteur has also reported on wealthy nations, including two fact-finding “missions” to the United States at the invitation of activists and through the intervention of sympathetic U.S. government agents. The first mission (from February 22 - March 4, 2011) resulted in a report that described cases of marginalized communities that lacked access to water and sanitation (de Albuquerque Reference de Albuquerque2011). Based on gathered evidence, the report noted that discrimination on the basis of race associated with lack of access to water and sanitation was a possibility. The second mission, which occurred in July 2014 and was carried out jointly with special rapporteurs on adequate housing and extreme poverty was conducted specifically to investigate massive water shutoffs in Detroit, and resulted in an official statement condemning the water shutoffs (United Nations 2014). Activists, who view the ongoing water crisis in Flint as documentation of potential racial discrimination in water and sanitation services, refer to this report (Lukacs Reference Lukacs2014).
The international acceptance of HRWS as an analytical frame for grievances opens opportunities for consideration of possible discrimination in access to water and sanitation even in places like the United States, where a very small portion of the overall population lack access. However, some scholars, such as Leila Harris et al. (Reference Harris, Rodina and Morinville2015), have argued that the HRWS frame is analytically insufficient and should instead be combined with the conceptual lens of environmental justice to more clearly identify the patterns and mechanisms of discrimination.
RACE AND THE ENVIRONMENT
The scholarship on race and economic inequality has had a long history within sociology. While early theories of race focused on biological differences, by the beginning of the twentieth century, sociologists such as W. E. B. Du Bois (Reference Du Bois1903) and “Chicago School” scholars William Thomas and Florian Znaniecki (Reference Thomas and Zmeniecki1918) started to lay the groundwork for understanding race as a social construction (Winant Reference Winant2000). In its contemporary use, the social construction of race emphasizes systems of domination that produce racialized bodies and racialized politics, resulting in ongoing and everyday reinforcement of systems of domination and the continuation of structures of inequality.
For Joe Feagin and Sean Elias (Reference Feagin and Elias2013), structural racism was foundational to the organization and development of the United States, and remains persistent in its continued maintenance of social inequalities. Structural racism refers to the institutional structures that define the social hierarchies and power of White populations over populations of color. It perpetuates differential access to resources. Whites are explicitly complicit in this social organization, either through direct acts of racism, or through passive and colorblind acts that accept and thereby reinforce their privileged dominance. Scholars such as Douglas Massey (Reference Massey1990), George Lipsitz (Reference Lipsitz2007), and William Rohe and Leslie Stewart (Reference Rohe and Stewart2010) have documented how structural racism around access to mortgage lending, for instance, has led to spatial concentrations of poverty, community vulnerability to economic downturn, neighborhood blight, limitation on intergenerational wealth transfer, and suppressed property values. Structural racism has been shown to impact basic public health and other services to communities of color (Jones Reference Jones2000).
Environmental justice scholars critiqued earlier work on race and the environment for drawing a connection between the two. While many in the environmental movement viewed issues of the environment as not of interest to non-White minorities, environmental justice activists expanded the definition of environment from a space “out there,” far away from people, to “where we live[d], we work[ed], we play[ed]” (Gottlieb Reference Gottlieb2005). As such, early environmental justice scholarship focused on documenting disproportionate exposure to environmental toxins and polluting industries for particular groups (Bullard et al., Reference Bullard, Mohai, Saha and Wright2007). Bullard’s research on environmentally polluting industries in Louisiana and Texas demonstrated that race, rather than socioeconomic status, was the critical issue in determining where these industries and industrial waste plants were located (Bullard Reference Bullard1994).
Bullard’s more recent insight that “the dominant environmental protection paradigm reinforces instead of challenges the stratification of people…places…and types of work” (Bullard Reference Bullard2005, p. 29 ) has sparked new work on the mechanisms through which disproportionate exposure is implemented. Following this lead, new research is focused not only on the relative exposure to environmental risk by minorities and the economically disadvantaged, but also on how White and economically advantaged people systematically avoid exposure to toxics by, for example, moving away from polluted urban centers out to less polluted suburban spaces (Pulido Reference Pulido2000). Laura Pulido’s work further highlights the increasingly recognized spatial inequality in the United States—which, specifically for our purposes can also be described in terms of environmental conditions, protection, and services (e.g., Florida Reference Florida2015; Lobao et al., Reference Lobao, Michael Hooks and Tickamyer2007).
While there is a vast literature on environmental justice that looks at disproportionate exposures to environmental contaminants and the implications for people of color (Brown Reference Brown2007; Pellow Reference Pellow2007; Taylor Reference Taylor2014), there has been less environmental justice work on water and wastewater. What work has been done has tended to treat issues around access to safe drinking water and the avoidance of exposure to the hazards associated with sewerage systems as related, but distinct issues (Wescoat et al., Reference Wescoat, Halvorson, Headington, Replogle, Mutz, Bryner and Kenney2002). Most of the associated research has either focused on community mobilization aimed at redressing unjust siting of “toxic” wastewater treatment plants in already marginalized communities, predominantly women, people of color, and the poor (Di Chiro Reference Di Chiro2004; Litt et al., Reference Litt, Tran, Nga and Burke2002; Pezzoli et al., Reference Pezzoli, Tukey, Sarabia, Zaslavsky, Lynn Miranda, Suk, Lin and Ellisman2007; Ringquist and Clark, Reference Ringquist and Clark1999), or the failure to install or upgrade access to drinking water in a particular political-economic context (Brown and Ingram, Reference Brown and Ingram1987; Wilson et al., Reference Wilson, Heaney, Cooper and Wilson2008).
Some analyses of water and sanitation services access do exist, however. For example, James Wescoat et al. (Reference Wescoat, Headington and Theobald2007) found a connection between water access and poverty in analysis of incomplete plumbing facilities in Colorado. Wescoat et al. (Reference Wescoat, Headington and Theobald2007) not only debunked the myth of universal access to water in the United States, but also demonstrated that low-income water problems occurred beyond “pockets” of impoverishment; instead, scenarios of water and poverty were diverse, and thus deserved diverse solutions. Likewise, Sacoby Wilson et al. (Reference Wilson, Heaney, Cooper and Wilson2008) documented explicit zoning practices in the small town of Mebane, North Carolina that systematically excluded African-American neighborhoods from the development of water and sanitation infrastructure services. Wilson (Reference Wilson2009) then built upon the work of Pulido (Reference Pulido2000) and Juliana Maantay (Reference Maantay2001) in arguing that zoning and structural inequality among places of residence could be correlated not only to exposure to toxins, but also with access to environmental assets, such as access to parks and other green spaces.
Case studies by Jennifer Carrera and Stephen Gasteyer (Reference Carrera and Gasteyer2008) and Carrera (Reference Carrera2014) documented systemic exclusion of Black residents from water and wastewater services in Alabama, Illinois, Mississippi, Michigan, and Ohio. The cases demonstrate processes of structural racism (Bonilla-Silva Reference Bonilla-Silva1997), or what Dennis Rogers and Bruce O’Neil (Reference Rodgers and O’Neill2012) have termed “passive infrastructural violence” (p. 402), the subjugation of non-White populations through the inertia of infrastructure design and planning. Gasteyer and Rahul Vaswani (Reference Gasteyer and Vaswani2004) provided evidence of the extent and variation of lack of access to plumbing through a county-level national analysis. After compiling similar data from the 2000 U.S. Census “long form” (SF3), Footnote 5 they found that racial and ethnic categories, as well as the urban-rural divide, were significant indicators for lack of access. Specifically, rural areas were up to three times as likely to lack complete plumbing facilities, with rural American Indians and Alaskan Native (AIAN) populations representing the greatest percentage of households nationwide that demonstrated a lack of access.
Gregory Pierce and Silvia Jimenez (Reference Pierce and Jimenez2015) used American Housing Survey data to document greater unreliability of water services in mobile homes in the United States. Using county-level data on household expenditures also from the 2000 U.S. Census, Rachel Butts and Gasteyer (Reference Butts and Gasteyer2011) found that the average amount that households paid for water and sanitation in Michigan were higher not only in urban areas, but in areas with greater populations of minority residents. The finding was unexpected, as utility rate theories tended to predict lower water and wastewater service rates in urban areas due to the fixed costs of underlying infrastructure being spread across a larger, and more concentrated population.
Given the unique context of race and racism in the United States (Wacquant Reference Wacquant2008), and using the combined frames of the HRWS, environmental justice, and structural racism, our research therefore asks, do the estimated 540,000 households lacking access to complete plumbing facilities occur in patterns that might indicate discrimination? Based upon this literature, we presume these patterns, should they exist, to be maintained through colorblind laws and legacy conditions that disproportionately increase cost and accessibility of basic infrastructure services for particular places and people.
METHODS
We answer the question, “What is the relationship between race and access to water and sanitation in the United States?” by analyzing U.S. Census housing data from the 2013 American Community Survey (ACS). Beginning in 1940, it was decided that the U.S. Census Bureau would collect data to help inform and assess the design and impacts of a growing number of federal programs. This was done through the “long form” version of the U.S. Census survey, which went to one in six households and contained questions on everything from income to housing tenure and housing conditions. In the early 2000s, the U.S. Census Bureau decided to replace the “long form” that would have accompanied the 2010 decennial census with the ACS. The ACS is currently administered on an annual basis to approximately two to three million households across the United States, using a sampling frame that is intended to adequately represent housing conditions. To correct for the high level of probability sampling error resulting from the reduced sample population (about 123 million American households in 2014), the U.S. Census Bureau produces a weighted average using data from ACS surveys delivered over five years at a time. Footnote 6
For our analysis, we pulled two subsets of this data. First, we obtained data from the housing section of ACS on household “access to complete plumbing facilities” for all counties in the United States. While variability in size and demographic characteristics is an issue, the county is widely used and accepted as a comparable unit of analysis within the United States (Lobao et al., Reference Lobao, Michael Hooks and Tickamyer2007). We gathered the county-level statistics for income, age, employment, gender, education, and race. To measure the extent to which a county was considered urban or rural, we merged the ACS data with the 2013 Urban Influence Codes generated by the United States Department of Agriculture Economic Research Service (USDA ERS). Footnote 7 The USDA scale for “urbanicity” goes from a highly “urban” value of 1 to a “completely rural, in a community of less than 2,500” represented by a value of 9. As incomplete plumbing is expected to be associated with rurality and a larger number within the “urbanicity” scale indicates a more rural place, this variable will be referred to as “rurality” for the remainder of this paper. Taking the percentage of lack of complete plumbing facilities per county as our dependent variable, we conducted ordinary-least-squares (OLS) linear regressions to clarify its relationship with our chosen independent variables taken from the ACS and USDA-ERS data (Parker Reference Parker2013).
We recognize that by using aggregated data at the county level, we run the risk of analyzing and interpreting an “ecological fallacy,” (Vogt 2003, p. 78) wherein interpretations of the aggregate statistics (in this case, county-level) are falsely inferred upon the individual (household) level (e.g., Schwartz Reference Schwartz1994). To protect the privacy of U.S. Census survey participants, potentially sensitive U.S. Census data is not available at the household level, since having data for households on their race, income, and complete plumbing status may make them uniquely identifiable particularly in rural areas. While county as the unit of analysis is perhaps more vulnerable to an ecological fallacy than smaller geographical areas such as the U.S. Census tract or block group, it has analytical advantages, including: 1) the relative stability of the county-level data over time, given the small number of households in rural areas, and 2) the comparability of our data with previous studies that have used county-level data. Analysis is already underway to examine the issue of complete plumbing at the block group level, which will reduce the probability of falling prey to an ecological fallacy, but it will not completely prevent it. Nevertheless, the use of U.S. Census data limits our interpretation to only identifying potential correlations between the percentage of households that lack access to complete plumbing and the percentage of the selected independent variables.
Before performing the statistics, we also confirmed the variability of percentage of households lacking complete plumbing through a spatial analysis. We did this by using ESRI’s ArcMap GIS software to compose a visual map of the distribution of incomplete plumbing by county and to calculate a global Moran’s I (ESRI 2011; Moran Reference Moran1950) to check for spatial autocorrelation. This allowed us to identify “hot spots,” or areas that had greater proportions of lack of access to complete plumbing facilities within the United States. In other words, by producing a visual representation of the U.S. Census data, this analysis showed us where lack of access had a tendency to cluster and also helped us determine whether this clustering had a nonrandom distribution.
Based on preliminary findings from our spatial analysis, we also decided to include regional effects in our regression model. Regional effects were completed by coding counties according to U.S. Census-defined divisions, which included the Pacific, Mountain, West North Central, West South Central, East North Central, East South Central, Mid Atlantic, South Atlantic, and New England regions. These divisions were then added as dummy variables to the statistical runs.
Finally, we used ordinary-least-squares (OLS) linear regression (Agresti and Findlay, Reference Agresti and Finlay2009) to better understand the effect of each independent variable on the percentage of lack of access to complete plumbing per county. The regression analysis was completed in two stages. It was necessary to break up the analysis when we realized that the percentage White and percentage Black per county—two of our most important independent variables—would be highly correlated with each other. Therefore, in the first stage of our analysis, we completed a regression that included the independent variables pulled from the U.S. Census and USDA-ERS data, except for percentage White per county. This allowed us to see what effect percentage Black would have on the percentage of lack of access to complete plumbing per county. The second stage of our analysis acted as a check upon the first; we conducted another regression where we ran percentage White as the sole independent variable to determine its direct effect on the percentage of lack of complete plumbing facilities per county. Doing this allowed us to confirm the effect that percentage Black per county had produced during the first stage, when we had tested the full model.
FINDINGS
Overview
We started our analysis by looking at the population lacking plumbing from a historical perspective. Table 1 adds our ACS 2008–2013 data to a table from Gasteyer and Vaswani (Reference Gasteyer and Vaswani2004) to show the estimated percentage of households lacking access to complete plumbing nationally from 1960 to 2012. From this table, we can see that the United States has improved significantly in terms of aggregate statistics.
Table 1. Percent of Households Lacking Complete Plumbing (1960–2012) Footnote 8
We found a significant association between lack of access to complete plumbing and region, specifically a positive association with the U.S. Census-defined Pacific, West North Central, and West South Central divisions. Counties which were classified as more rural were also positively correlated with lack of complete plumbing per county. Furthermore, the following social attributes of people were positively correlated with lack of access to complete plumbing by county: percentage of AIAN, percentage of high school graduates, percentage unemployed, and degree of rurality. We found an unexpected weak, but statistically significant, positive relationship with income. Descriptive statistics and both regression results are presented in Table 2 and Table 3. We describe these findings in more depth below.
Table 2. Descriptive Statistics of Socioeconomic Variables
Table 3. Regression of Income, Unemployment, Gender, Race, Age, Education, Urbanicity, and Regional Effects on Lack of Access to Complete Plumbing Facilities in the United States
Regional Effects
The Moran’s I value of 0.016 confirmed that there was indeed clustering within the data, as a significant p-value (p < 0.00) and a positive z-value (z = 15.55) indicated that the observed clustering patterns were not due to random chance. In other words, the raw data demonstrated a tendency for counties with high levels of incomplete plumbing to be clustered near other counties with high levels of incomplete plumbing. Figure 2 shows the percentage of lack of access to complete plumbing facilities by county. Clearly identifiable hot spots include regions in the Southwest, Alaska, the borderlands between the United States and Mexico, and the United States and Canada. This distribution bears a striking similarity to the distribution of hot spots depicted in Gasteyer and Vaswani (Reference Gasteyer and Vaswani2004) (See Figure 1). As mentioned above, when the U.S. Census-defined divisions were included in the model as dummy variables, the Pacific, West North Central, and West South Central divisions produced significant correlations.
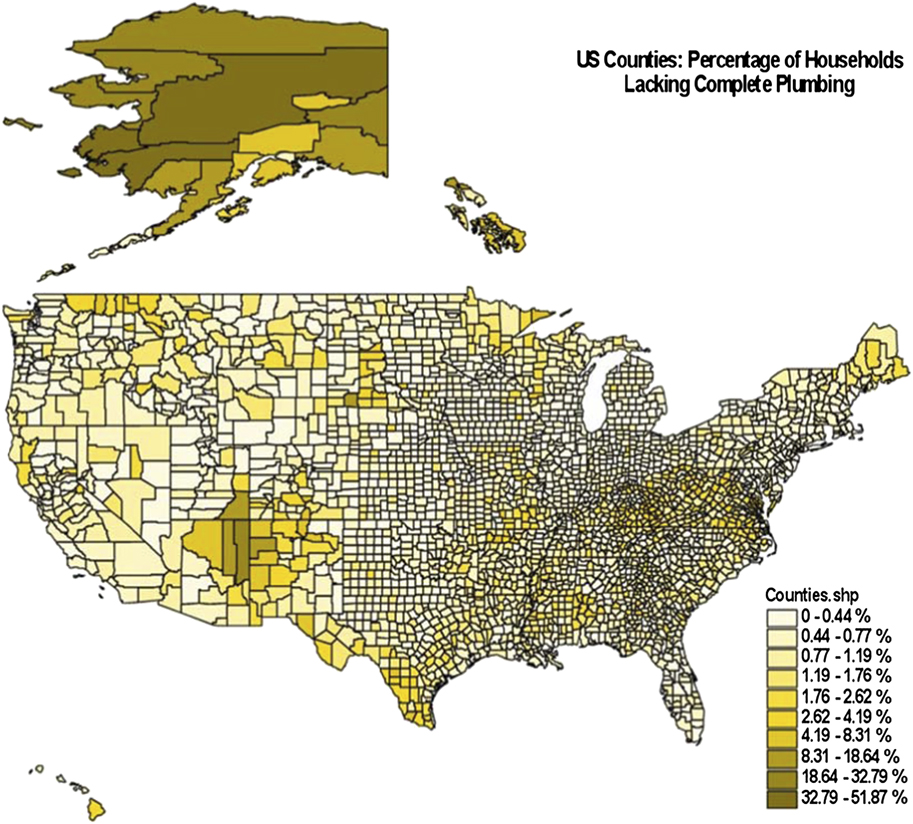
Fig. 1. Percentage lacking access to complete plumbing facilities by county (Gasteyer and Vaswani, Reference Gasteyer and Vaswani2004).
Rurality
Rurality was statistically significant (p < 0.00, t = 3.73), with a positive unstandardized coefficient. This relationship was weak, but it confirms what has been found by previous research (Gasteyer and Vaswani, Reference Gasteyer and Vaswani2004). For every increase in rurality according to the USDA-ERS 2013 Urban Influence Codes, a 0.0005% increase in the percent of the population in the county that lacks access to complete plumbing facilities was expected. Counties considered more rural are thus more likely to have a larger proportion of households without access to complete plumbing facilities.
Race
Creating a precise update of the 2000 U.S. Census statistics proved significantly challenging, as the U.S. Census Bureau had changed the way it reported race and income statistics in reference to plumbing. It is no longer possible to look at the cross-tabulation of race and access to plumbing directly at the county level. However, Table 4 shows that just by comparing aggregate frequencies by racial group, we can see that while the percentages lacking complete plumbing have fallen across the board, the percentages still vary by racial category: Whites and Asians have the lowest percent lacking complete plumbing, followed by Some Other Race (SOR), Blacks, Hispanic or Latino, and AIAN. What is most striking about this comparison is that the ranking among races has remained remarkably similar.
Table 4. Percent lacking plumbing by race 2000 and 2010 compared
We found a statistically significant relationship between race and plumbing, indicating that counties with a higher percentage of non-White households were more likely to report lack of access to complete plumbing in the 2008–2013 ACS. We performed a second regression to check the results of our first regression; the second regression tested the direct effect of percentage White on the percentage of lack of access to complete plumbing by county. As we anticipated, the second regression showed that the percentage of White per county was significant (p < 0.00, t = -12.38) and negatively correlated with the percentage of households with incomplete plumbing and that for every percentage increase in the White population per county, there was a -0.02% decrease in the likelihood of lack of access to complete plumbing. In other words, counties with larger White populations were more likely to have complete plumbing.
Across all races, we found that AIAN households were by far the population that was most likely to lack complete plumbing by county, followed by Hispanics, Native Hawai’ian Oceanic Pacific Islanders, and Black/African American, although the latter three variables did not produce significant p-values within the regression analyses. Indeed, our regression results show that only AIAN, and SOR populations were significantly associated with lack of complete plumbing per county; however, the direction of their individual effects varied.
The percentage of AIAN households per county produced the strongest effect on percentage of inadequate plumbing; for every percent increase in AIAN households within the county, the percent lacking access to complete plumbing would increase by 10% (p < 0.001, t = 28.54). Conversely, Asian-identified households were negatively correlated with lack of access to complete plumbing facilities: a 1% increase of the Asian population per county generated a 0.04% increase in likelihood of access (p < 0.003, t = -3.01). Therefore, counties with higher Asian populations were more likely to have lower rates of lack of access to complete plumbing facilities. Likewise, as the percent of households that reported being SOR increased in a county, lack of access to complete plumbing facilities per county decreased by 0.04% (p < 0.00, t = -4.30). In other words, the negative correlation with lack of access to complete plumbing also indicated that counties with higher populations of SOR were more likely to enjoy access to plumbing. A county-level spatial analysis likewise revealed that the lack of access to complete plumbing was spatially concentrated in Alaska and the “four corners” (i.e. New Mexico, Arizona, Utah, Nevada) region of the United States—areas with significant AIAN populations, as well as the Texas borderlands region, which are heavily populated by Hispanics and Latinos.
Proxy Indicators of Influence of Income
Unemployment resulted in a positive unstandardized coefficient; increasing unemployment at the county level shows an increase in the proportion of those who lack access to complete plumbing facilities. For each percentage increase in the county unemployment rate, the likelihood of lack of access to complete plumbing facilities increases by 0.03% (p < 0.05, t = 1.91). Percent of high school graduates had a negative unstandardized coefficient; a 1% increase in the proportion of high school graduates shows a decrease of 0.03% of lack of access to complete plumbing facilities (p < 0.00, t = -4.61).
Overall Model
The F-test calculated whether our chosen predictors had non-zero effects on lack of access to complete plumbing; indeed, our chosen predictors were shown to be significant (p < 0.00). The R2 value, which describes the extent to which the selected predictors have the ability to explain the variability in lack of access to complete plumbing facilities at the county level, had a value of 0.3423. Approximately 34% of the variance for lack of access to complete plumbing facilities can be predicted using proportional descriptions of income, unemployment, racial categories, education, rurality, and regional effects.
DISCUSSION
News articles from 2014 to early 2016 provided anecdotal evidence that people of color were disproportionally burdened by a lack of basic water services. In addition to reporting on water shutoffs and poisonings in Detroit and Flint, Michigan, journalists also uncovered case studies of communities in Tulare County, California, the Navajo Reservation in New Mexico and Arizona, and the Black Belt region of Alabama Footnote 9 —all places where substantial numbers of households lacked running water and/or working sanitation systems.
These anecdotes are a telling counternarrative to the common perception of universal water and sanitation coverage (Wescoat et al., Reference Wescoat, Headington and Theobald2007), with the exception of those who have chosen to live “off the grid.” The findings of our statistical county-level analysis provide more systematic empirical evidence to add to the counternarrative.
Our findings show that counties with a higher percentage of AIAN are significantly more likely to have a higher percentage of households that lack complete plumbing facilities. As shown in Table 5, a clear pattern emerges when the top twenty counties in the United States are arranged from greatest to least percentage lacking complete plumbing facilities. AIAN make up less than 2% of the population of the United States, yet thirteen of the top twenty counties with impaired plumbing access are populated by more than 50% AIAN, while eighteen counties are 15% or above.
Table 5. Top Twenty Counties with Highest Percentage of Lack of Access to Complete Plumbing Facilities and Percentage American Indian and Alaskan Native
These findings are similar to what Gasteyer and Vaswani (Reference Gasteyer and Vaswani2004) found. Even as the data indicates some progress in addressing lack of access to complete plumbing—specifically for Hispanics and SOR (see Table 4)—eleven years later, the AIAN population remains the most disproportionately affected in terms of lack of access to complete plumbing facilities. The finding that counties with higher percentages of Asian identified persons have lower rates of incomplete plumbing is consistent with other health equity research, which has found that Asian Americans have comparably better health outcomes than other racial groups in the United States (Murray et al., Reference Murray, Kulkarni, Michaud, Tomijima, Bulzacchelli and Iandiorio2006).
It is often presumed that lack of access to complete plumbing in the United States can be explained by economic class (Wescoat et al., Reference Wescoat, Headington and Theobald2007). Unexpectedly, median household income (MHI) had a positive unstandardized coefficient, indicating that increasing the median income by county was related to an increase in lack of access to complete plumbing facilities. The magnitude of this relationship was very small (7.15e-08), and could be a false positive finding given the size of the dataset analyzed. In future research, we plan to explore this relationship further by looking at county inequality using the GINI coefficient. We expect that if there is indeed a positive relationship with income in certain counties, we would also find that these counties have higher levels of inequality.
Other proxy indicators of income—unemployment and educational attainment (Table 2)—were more clearly correlated with lack of access to complete plumbing. Unemployment was associated with higher rates of incomplete plumbing. This is not surprising, given that high levels of unemployment are associated with persistent poverty, including isolation from the infrastructure associated with employment centers (USDA 2015). Similarly, while there was a weak relationship, we found that counties with higher rates of high school graduates were more likely to have higher percentages of access to complete plumbing facilities. Likewise, high school graduates are more likely to be employed. Likewise, the finding of a positive relationship between high school attainment and complete plumbing access makes sense given public health scholarship, which has found a strong association between educational attainment and positive health outcomes (e.g., Braveman et al., Reference Braveman, Egerter and Mockenhaupt2011).
Our findings show that higher rates of incomplete plumbing are associated with racial composition as well as region, unemployment, and educational attainment. Contrary to the commonly stated assumption by some that residents choose to live without complete plumbing, we draw from a frame of structural racism that argues that there has been a systemic failure to provide basic and essential services for all Americans regardless of race or income status.
For reasons we have mentioned, our results are limited in their ability to explain anecdotes cited in the media and collected by water rights advocates. For example, anecdotally we understand how Hispanic/Latino communities were systematically excluded from water and sanitation infrastructure initiatives from 1950–2000 in California because such programs targeted incorporated communities (Carillo Reference Carillo2014). Since the state had discouraged the incorporation of Hispanic/Latino (and largely farm worker) communities in the first part of the twentieth century, these communities were then excluded from consideration for infrastructure funding in a later, less overtly racist period. This left communities on decentralized water and sanitation sources vulnerable to losing service when the drought dried up wells (Carillo Reference Carillo2014; Medina Reference Medina2014).
Likewise, Cornelia Flora et al. (Reference Flora, Flora and Gasteyer2015) described how U.S. government policy systematically moved American Indians into rural and isolated reservations prior to the 1930s, where it was simultaneously difficult to develop water and sanitation infrastructure, as well as to develop economically viable activities. This was then compounded by laws and regulations that complicated local governance and disenfranchised the population. This provides the backdrop to Laurel Morales’s (Reference Morales2015) story about “the Water Lady” and lack of access to water on the Navajo Reservation.
Our data can only show the correlation between estimated percent of households lacking complete plumbing and percent racial group at the county level. More research and better data would be needed to better analyze the dynamics and drivers of the observations outlined above.
CONCLUSION
This paper has attempted to use county-level U.S. Census data to investigate a national pattern connected to the increasing media accounts of water and sanitation issues in communities of color in the United States. While the aggregate percentages are small, we indeed find that higher percentages of races other than White and Asian—specifically AIAN—are statistically associated with lack of access to complete plumbing.
The theoretical frames of the human right to water and sanitation, environmental justice, and structural racism guided our analysis, highlighting the question of whether or not a pattern of discrimination existed in analysis of the less than 1% of the U.S. households that reported lacking complete plumbing facilities. Using the methods indicated through this literature led us to identify temporal and spatial patterns (Table 5, Figure 1, and Figure 2) that indicated places with persistent lack of access to plumbing. These findings could be interpreted as evidence of legacies of inadequate investment in particular marginalized communities—predominately communities of color. In other words, our results could be interpreted as evidence of structural racism.
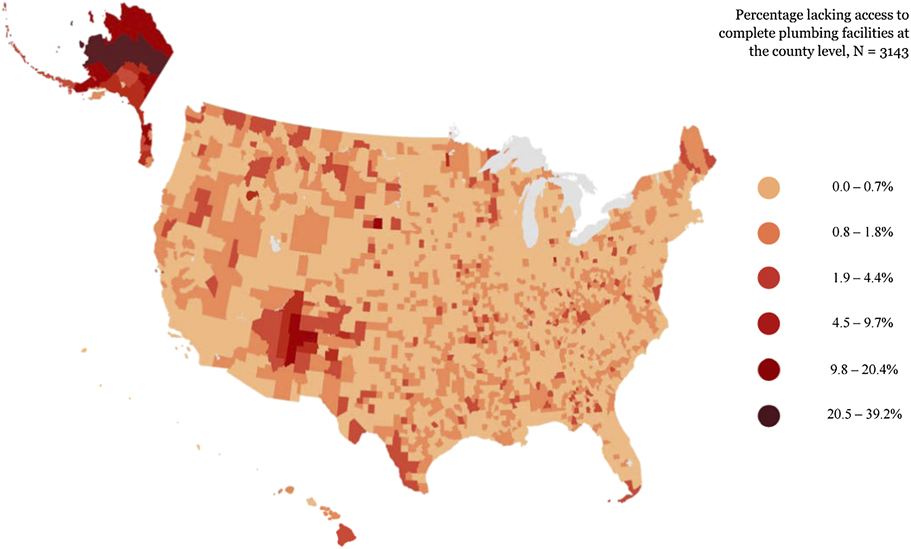
Fig. 2. Percentage lacking access to complete plumbing facilities by county (2008–2013).
Such a conclusion could also be supported by results from our spatial analysis, where we found that households living with incomplete plumbing had a tendency to be near other households with incomplete plumbing; in other words, lack of access to complete plumbing had a tendency to cluster. As such, in extremely impacted counties, the majority of households were without complete plumbing access. Conversely, for areas in which incomplete plumbing was not widespread, the issue was effectively rendered invisible. The spatial analysis also showed that a disproportionately high percentage of households lacking complete plumbing in counties with a high percentage of AIAN households.
These findings benefit environmental justice literature in proposing that lack of investment in water and sanitation infrastructure might well pose an environmental injustice due to unequal distribution. The structural racism perspective frames our results as indicating sins of “inaction” (Jones Reference Jones2000; Rogers and O’Neill, Reference Rodgers and O’Neill2012). Fixing the uneven distribution of lack of access will require revised policies and further research in order to break free of the current status quo.
We acknowledge, however, that more research will be needed to better document the number, conditions, drivers, and implications of lacking access to water and sanitation in twenty-first-century United States, along with what can be done to address this issue. We remain cognizant that there were some serious weaknesses to our analyses, and we point these out now as a way of making a policy recommendation.
ACS data is itself flawed in that it is restricted so that the percent of households of a given race within a county is unavailable to the public. As researchers, we used the next best approach—correlated percentages of race and other attributes and percent lacking plumbing. Beyond the inherent risk of “ecological fallacy” mentioned above, this analysis could well have missed important patterns. Indeed, given the way we did this analysis, we could have missed marginalized minority populations without complete plumbing in a given set of counties. Further, even if we could have accessed data on the percent of households lacking complete plumbing by racial group in a county, this indicator alone falls short of what would be ideal for analysis of the issues around household water and sanitation access.
In addition, there is good reason to believe that official water and sanitation statistics for the United States captured by the decennial census—and now, the ACS—underestimate the true scope of water and sanitation challenges in the United States. While ACS asks people to self-report whether they have sinks, bath/shower facilities, and indoor toilets, this measure may not capture households where water and sanitation services are functionally unavailable, even if these facilities are present. Such functional inaccessibility could be due to homelessness, affordability of water services and water shutoffs (such as the case of thousands of water shutoffs in Detroit), whether the water is potable (such as in Flint, Michigan) or the lack of a municipal network to protect against drought or groundwater quality problems (such as in the Central Valley of California).
Better measures of water access are necessary in order to more accurately assess the true scope of the challenges of access to water and sanitation in the United States, and how the effects of these challenges disproportionately burden marginalized communities. We get an inkling of what is missed in current data sources by looking at the top twenty counties arranged by the total number lacking complete plumbing, rather than percent (Table 6). These are large urban counties, with high percentages of non-White or Hispanic populations (such as Hidalgo County, Texas and Maricopa County, Arizona). Future research should explore this and other data. Our analysis provides an important indication of the problem, and as such, a basis for an appeal to the U.S. government to conduct, and facilitate collection and analysis of more, rather than less, data on this critical issue of basic rights. Footnote 10
Table 6. Top twenty counties with highest number of households lacking access to complete plumbing facilities