INTRODUCTION
Out-of-hospital cardiac arrest (OHCA) is a leading cause of mortality in Canada.Reference Nichol, Thomas and Callaway 1 The probability of survival decreases by up to 10% with each minute between collapse and treatment.Reference Larsen, Eisenberg and Cummins 2 , Reference Valenzuela, Roe and Cretin 3 The overall chance of favourable neurological survival for all patients is between 8.2% and 10.4%.Reference Daya, Schmicker and Zive 4 As a result, the latest resuscitation guidelines from the American Heart Association place a strong emphasis on early CPR and defibrillation to maximize patients’ chance of survival.Reference Field, Hazinski and Sayre 5 Despite public education campaigns to improve rates of bystander CPR, and the deployment of automatic external defibrillators (AEDs) in communities, the survival rate from OHCA remains poor.Reference Daya, Schmicker and Zive 4
Prior work has demonstrated that neighbourhoods with poor bystander CPR rates have lower rates of survival for OHCA compared to those neighbourhoods with higher rates of bystander CPR.Reference Semple, Cudnik and Sayre 6 In addition, neighbourhoods with lower population densities have lower rates of bystander CPR, longer times for emergency health services to respond, and subsequently poor rates of survival for OHCA.Reference Yasunaga, Miyata and Horiguchi 7 As a result, the geographic information system (GIS) has been used in other jurisdictions to plan the placement of AEDs to maximize their use and promote OHCA survival.Reference Ong, Tan and Yan 8
No prior work exists examining the geographic distribution of OHCA in the greater Vancouver area and the potential clustering of cases. Furthermore, no prior work has examined the rates of bystander CPR by neighbourhood or socioeconomic variables associated with favourable neurological survival (Cerebral Performance Category [CPC] 1 or 2).
The primary objective of this study was to describe the distribution of OHCA within the southern portion of the Vancouver Coastal Health region using GIS and appropriate statistical analyses. Secondary objectives included 1) a description of bystander CPR rates by neighbourhood; 2) an examination of the association between socioeconomic status and rates of bystander CPR; 3) an exploration of OHCA mortality by neighbourhood; and 4) an analysis of the association between socioeconomic variables and favourable neurological outcomes.
METHODS
This study was a post-hoc, GIS-based analysis of consecutive nontraumatic OHCA patients in the city of Vancouver and surrounding areas, prospectively identified by the Resuscitation Outcomes Consortium (ROC)Reference Morrison, Nichol and Rea 9 , Reference Lerner, Fairbanks and Shah 10 between September 2007 and December 2011. Patients were excluded if there was no attempt at professional resuscitation or if the patient’s age was under 18 years. The geographical area of this study included the cities of Vancouver, Richmond, and North Vancouver, and the municipal districts of North and West Vancouver, which contains four OHCA-receiving hospitals (two have coronary angiography capacity). The total population of this area in 2011 was 988,476, of whom 51.6% were female, and 14.2% were over age 65 (http://dc.chass.utoronto.ca/census/).
Trained research assistants prospectively extracted prehospital data from standardized emergency medical services (EMS) charts and hospital-level data from a hospital chart review, with CPC ascertained from chart review at the time of hospital discharge. Descriptive variables included age, known comorbidities, location of arrest, bystander CPR and AED application status, initial rhythm, mortality, and CPC score at discharge. Missing or conflicting data prompted a full chart review by a second investigator. In order to ensure spatial anonymity (patient confidentiality was protected by the inability to identify a specific case or patient by the location that his or her arrest occurred), the arrest locations were first geocoded and then generalized to the nearest 0.01 degree.
The primary end point of interest was favourable neurological status (FNS) at hospital discharge, defined as a CPC of 1 or 2.Reference Edgren, Hedstrand and Kelsey 11
Statistical analysis
GIS was used to examine the links between the density of OHCA events and neighbourhoods, and their socioeconomic characteristics. Using the kernel density (KD) methods, we transformed the generalized point data into continuous surfaces whose values could then be aggregated into neighbourhoods. The use of KD analysis is a well-established means of accomplishing this transformation.Reference Semple, Cudnik and Sayre 6 , Reference Lerner, Fairbanks and Shah 10 Given the spatial generalization of the cases, the use of clustering methodsReference Warden, Daya and LeGrady 12 or more sophisticated statistical methodsReference Ong, Wah and Hsu 13 would not be appropriate, because, for example, the gridded nature of the data would bias the results of spatial clustering (i.e., the clusters would reflect the [arbitrary] locations of the gridded data).
In producing KD surfaces, one of the important parameters is the search radius or bandwidth. Increasing the radius will not greatly change the calculated density values, more points will fall inside of the larger neighbourhood; however, this number will be divided by a larger area when calculating density. The main effect of a larger radius is that density is calculated considering a larger number of points, which can be further from the centre, and this results in a more generalized output. It was felt that selecting a value that lay between the shortest bandwidth associated with all of the events (1227 m), and a value that was identified as being optimum for only those events with a bystander present (1802 m), would be appropriate. As such, the KD bandwidth was set to 1500 m for all analyses. Given the generally systematic layout of the anonymized events, this distance ensures that, in most cases, nine discrete event locations would be within the search radius.
Once the single-variable KD surfaces were created, normalized difference images were created for selected pairings of KD surfaces. Normalized difference surfaces were created by normalizing each KD surface (i.e., dividing the KD surface by the maximum KD value for that surface) and then by subtracting the second surface from the first. Through this process, the effects of a variable population density on the results are implicitly accounted for; population density would affect both KD surfaces, and therefore that effect is mostly removed through the normalizing and differencing processes. If the two KD event surfaces share similar geographies (regardless of the absolute numbers), then the subtraction of the normalized surfaces should result in a difference surface of 0.0. If there are negative values that indicate that the first surface had fewer events in that area than expected (relative to the second surface), then positive values indicate that the first surface had more events than expected. In order to be able to explore some of the reasons why the KD surfaces vary, the KD (difference) values were linked with census tracts (CT). For the purposes of our analysis, we used the CTs as surrogates for neighbourhoods within the Vancouver Coastal Health region. A program called Geospatial Modelling Environment (GME)Reference Beyer 14 was used to extract the average KD value for each CT in the study area from the KD surfaces. The statistical package R was used to perform all of the statistical analyses. 15 Selected 2011 National Household Survey variables (i.e., census variables) that have been used in previous OHCA analysesReference Lyon, Cobbe and Bradley 16 - Reference Reinier, Thomas and Andrusiek 18 (Table 1) were downloaded from CHASS (http://dc.chass.utoronto.ca/census/), and CT boundaries were downloaded from the UBC Library Abacus website (http://dvn.library.ubc.ca/dvn/). Because population density is known to be a factor in OHCA outcomes,Reference Yasunaga, Miyata and Horiguchi 7 the true residential population density was determined for each CT, using the CT total population as of 2011, and the area of land zoned as residential within each CT. The population densities reported by Statistics Canada underestimate the actual population densities because they use the total CT area in their calculation, an area that includes parks, commercial, and industrial lands.
Table 1 Neighbourhood variables used as potential explanatory variables

An additional explanatory variable used in the analyses was the straight-line distance from the CT centroid to the municipality’s closest hospitals: SPH, VGH, LGH, RGH (e.g., residents in South Vancouver, although they may be physically closer to RGH, would normally be transported to VGH). Given the spatially generalized nature of the data, it was felt that using the straight-line distance was sufficient to capture the effect of transport time for each CT.
Rather than using multiple regression analyses or spatial cluster analysesReference Nassel, Root and Haukoos 19 to look for relations between the KD surfaces, in particular, the KD difference surfaces and the explanatory variables, regression tree analysis was used. Given the exploratory nature of this analysis, it was felt that the models produced by a regression tree analysis would be easier to interpret than the results of standard regression analyses. The RPART routineReference Kaji, Hanif and Bosson 20 - Reference Therneau, Atkinson and Ripley 22 was used to produce the regression trees in this study. The RPART routine determines which single explanatory variable best splits the response variable, and then for each split data set determines the best single explanatory variable to split that set, and so on. The RPART routine also effectively performs a stepwise regression – only those independent variables that produce statistically significant splits are used. In all cases, the same set of independent variables was used (the exploratory socioeconomic variables and the rationale behind their individual inclusion can be found in Table 1). The RPART routine determines which of those variables was most important (i.e., used to produce the first split), second-most important, and so on (similar to a stepwise regression). Splitting continues until the terminal nodes are too small or too few to be split. A tenfold cross-validation process is used to validate the results.Reference Therneau and Atkinson 21 , Reference Therneau, Atkinson and Ripley 22
RESULTS
There were 2419 OHCA cases within the study region; we excluded those not treated by EMS (n=775), those ages<18 years (n=17), and those in whom outcomes were unavailable due to missing identifiers (n=10). This study examined 1617 cases of OHCA with an overall mortality rate of 86.5% (95% CI 84.8-88.2). The mean age of OHCA cases was 66.6 years (95% CI 65.7-67.5), and 33.6% (95% CI 31.3-35.9) were female (Table 2). The proportion of patients with an initial shockable rhythm (ventricular fibrillation or pulseless ventricular tachycardia) was 22.2% (95% CI 20.2-24.2), and 42.3% (95% CI 39.9-44.7) of all cases received CPR. A total of 49.7% (n=803 [95% CI 47.3-52.1]) were transported to the hospital by paramedics. Of all cases in our study population, 98.1% were attended by Advanced Life Support paramedics. The rate of survival to hospital discharge with FNS (CPC 1 or 2) was 10.4% (95% CI 8.9-11.9). The mean population density for the study area is 10,117 people/km2. Refer to Appendix 1 for the regression tree diagrams for the analyses.
Table 2 Descriptive Characteristics of the Study Population
ALS=Advanced Life Support; CABG=coronary artery bypass grafting; CPR=cardiopulmonary resuscitation; EMS=emergency medical services; TOR=termination of resuscitation.
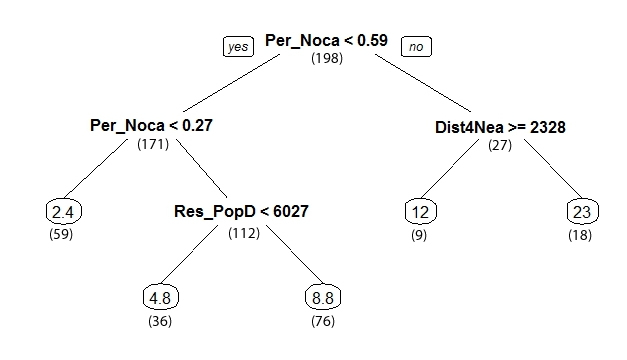
The KD surface derived from all of the 1617 events illustrates heterogeneity in the distribution of OHCA events among study neighbourhoods (Figure 1). The highest density of events occurred in the Downtown, Hastings and Mount Pleasant neighbourhoods of Vancouver, where the density ranges from 20 events/km2 to the maximum density of 51 events/km2 (Figure 2). In considering the relationships between the density of OHCA events within a CT and the exploratory variables (see Appendix 1), the RPART analysis found that 46% of the total sum of squares in the data could be explained by splitting the events into two groups on the basis of the percentage of people within a CT who do not use a car to commute to work (Per_Nocar<0.59). Altogether, the four splits shown account for 69% of the variance in the data (see Appendix 1). The greatest densities of events are associated with CTs that have more than 59% of the people not using a car to commute, are less than 2.3 km away from a hospital, and, lesser so, have higher population densities (>6027 people/km2) (Figure 3). The lowest densities of events are associated with CTs that have fewer than 27% of the people not using a car to commute and lower population density.
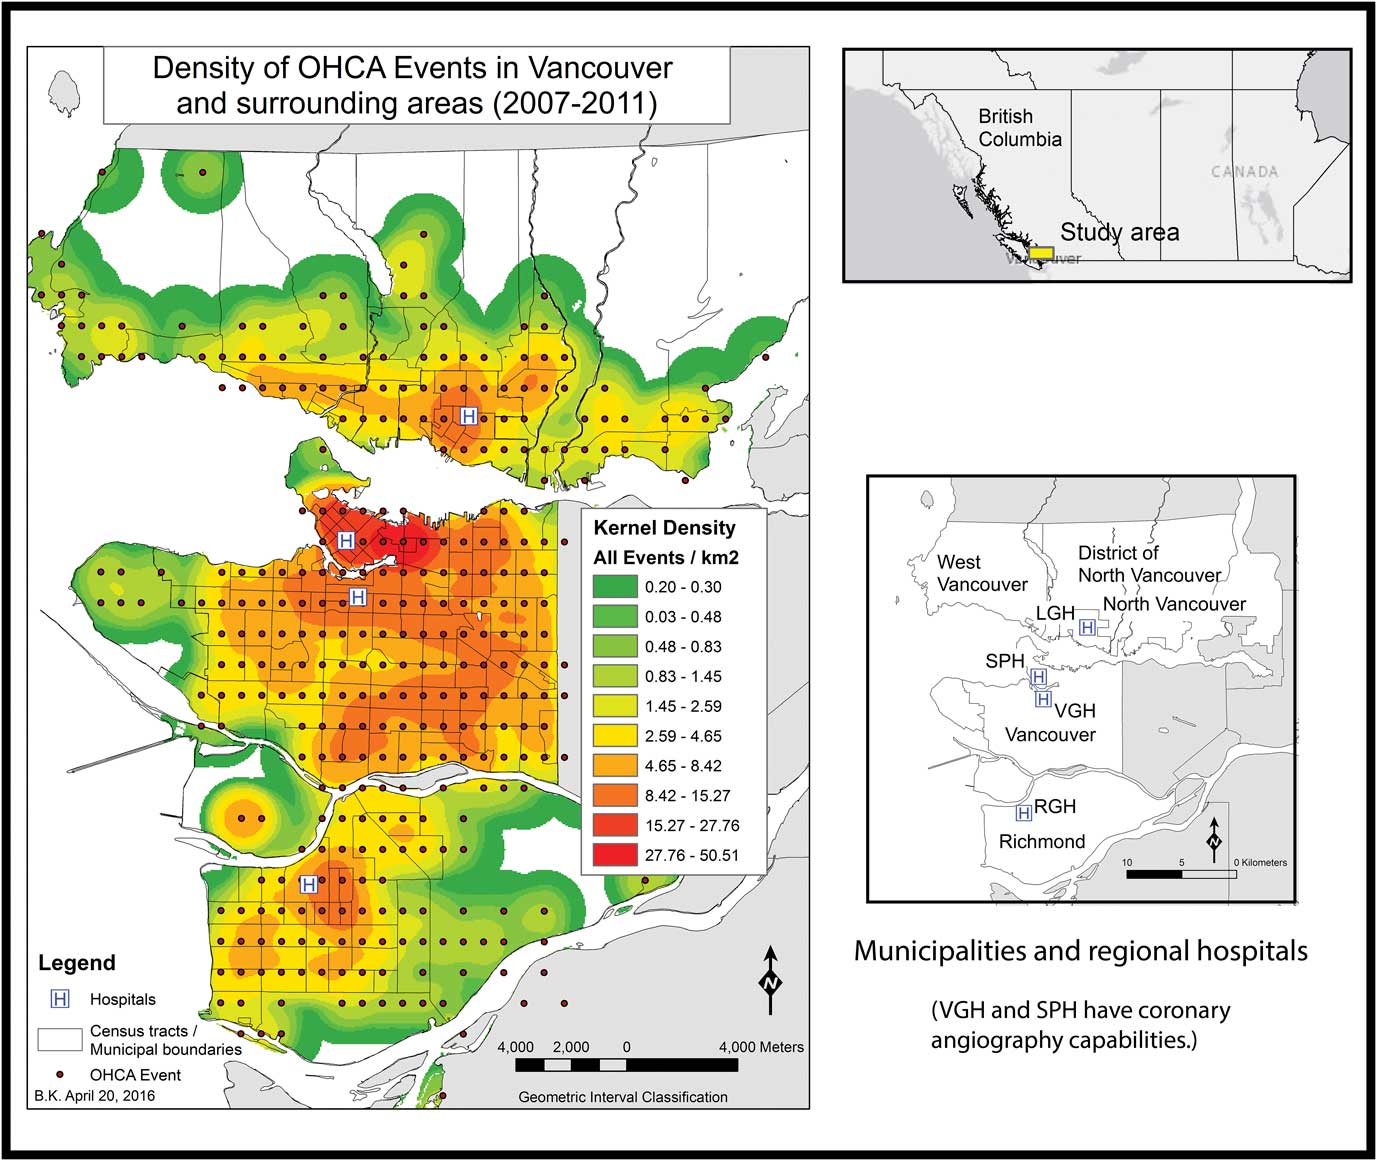
Figure 1 Density of OHCA events in Vancouver and surrounding areas (2007–2011).
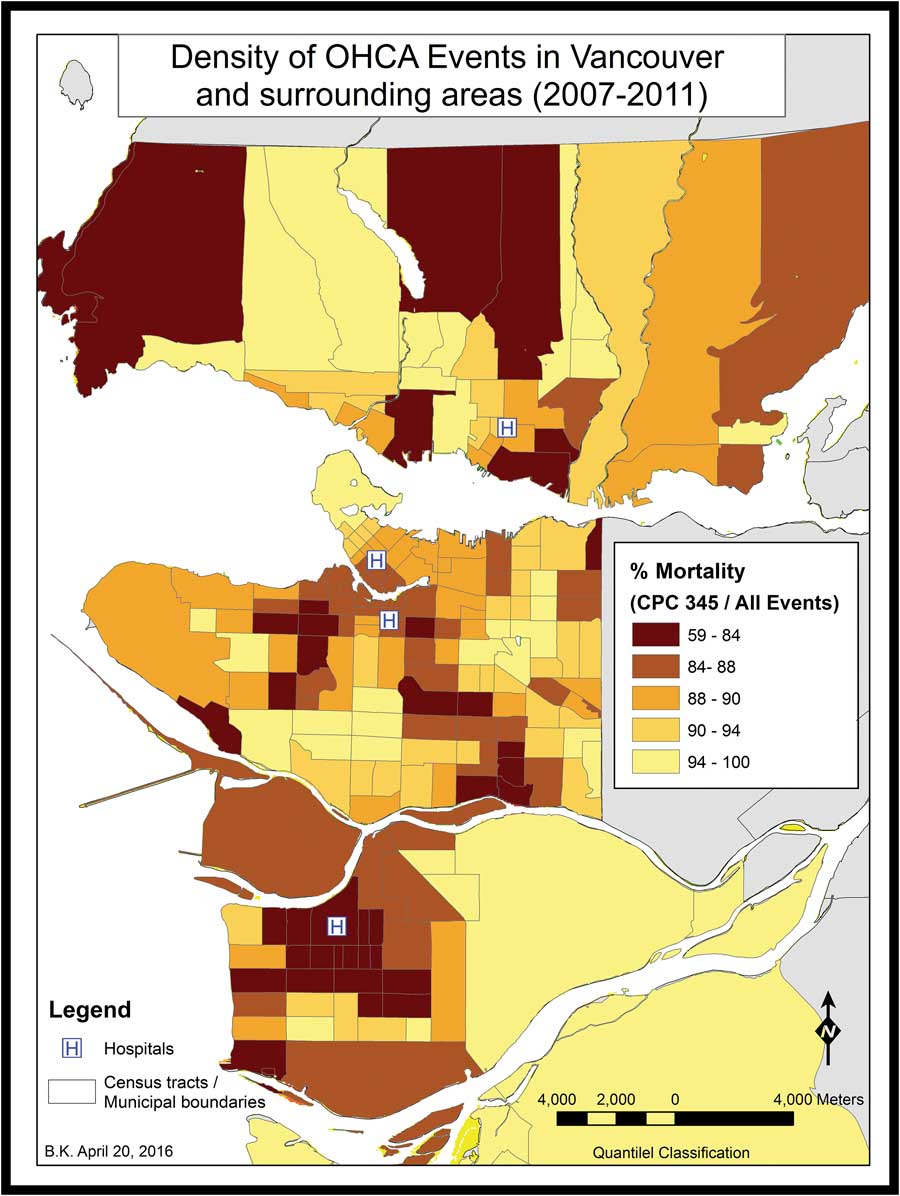
Figure 2 Percent mortality for OHCA events in Vancouver and surrounding areas (2007–2011).
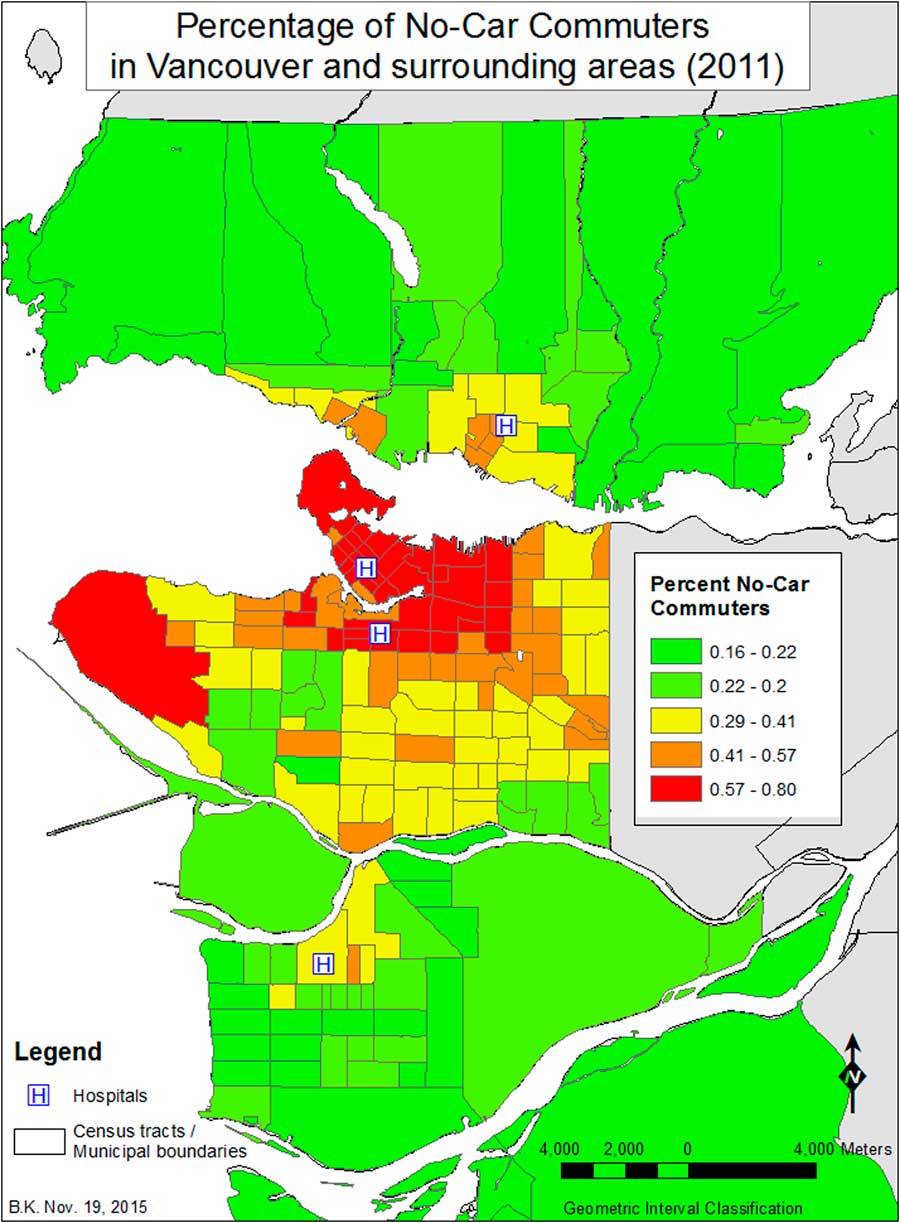
Figure 3 Percent No-Car Commuters in Vancouver and surrounding areas (2007–2011).
The KD analysis and regression tree derived from the difference surface of all OHCA events where CPR occurred (n=685) minus all OHCA events (Figure 4) identifies 16 CTs with very high percentages of people who do not use a car to commute to work (≥64%) that have low rates of bystander CPR relative to the rest of the study area. Conversely, in CTs with high levels of visible minority Chinese (39 CTs with>48% percentages), higher rates of bystander CPR relative to the rest of the study area are observed (see Appendix 1).
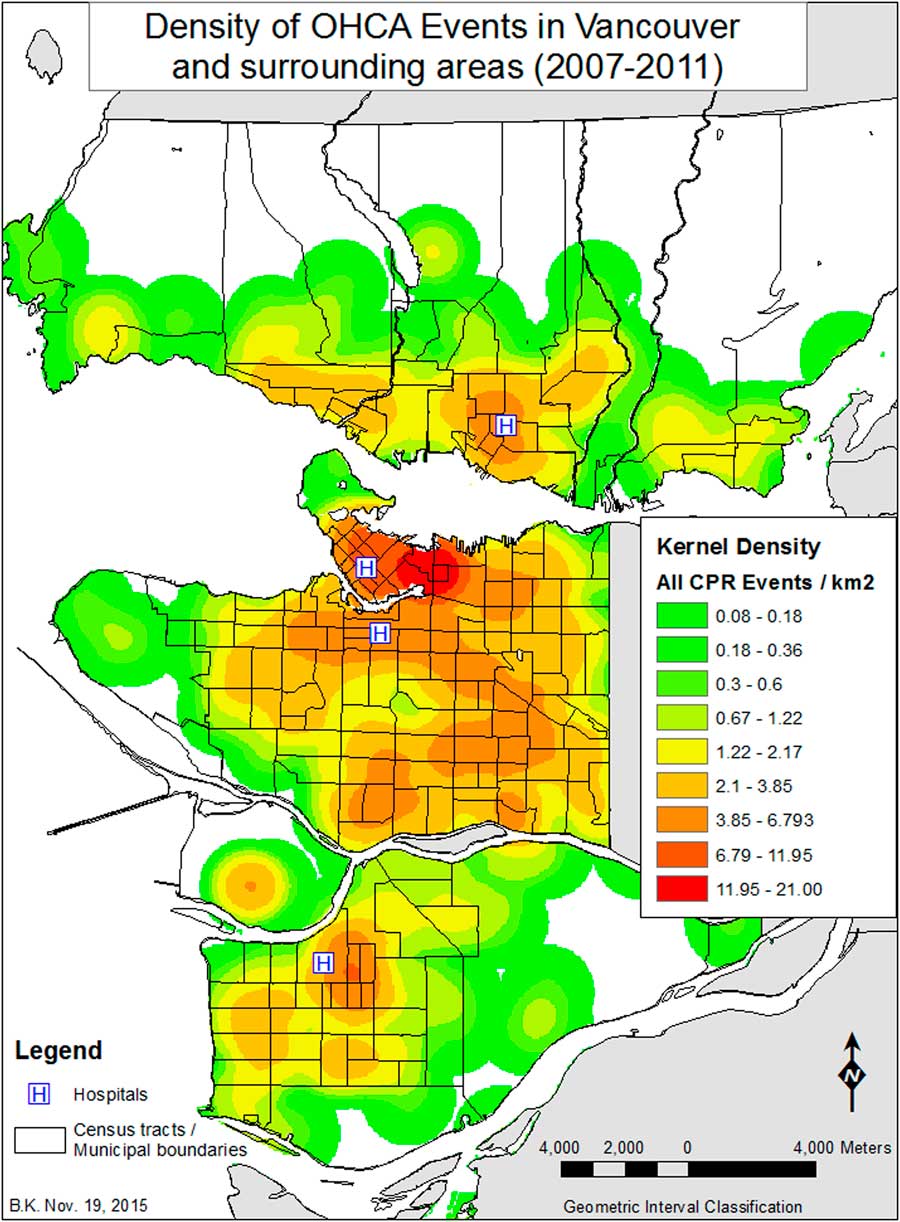
Figure 4 Kernel Density of all CPR events Vancouver and surrounding areas (2007–2011).
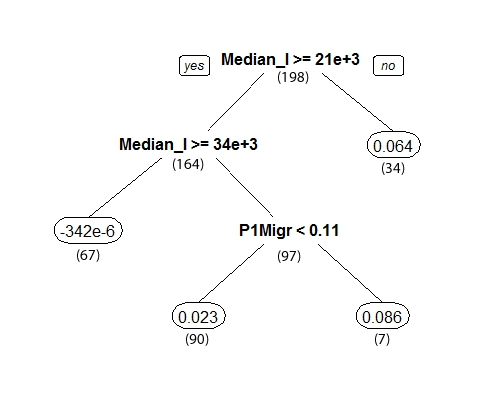
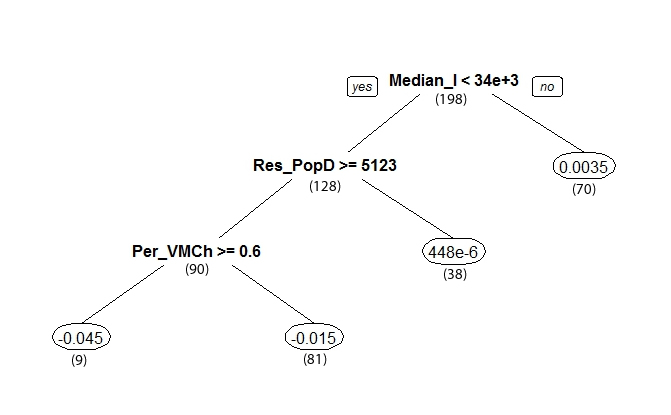
While 22% of all OHCA events occurred in a public venue, 31% of all bystander CPR interventions occurred in public venues. A public venue was defined as any area that was not a private residence (i.e., street, park, shopping mall, community centre). Looking at the difference between public bystander CPR events (n=213) and all public events (n=361), we observed that, in CTs with median incomes greater than $34,000, there are fewer cases with public bystander CPR than one would anticipate, relative to the number of public events that occur in those areas (Figure 5). More public bystander CPR occurs in CTs with median incomes less than $21,000 (34 CTs), as well as in those CTs with median incomes less than $34,000 (97 CTs). In those CTs with relatively high numbers of recent migrants (1 year or less), the level of public bystander CPR is higher than in those CTs with fewer numbers of recent migrants, relative to the geography of all public OHCA events. When contrasting all public CPR interventions to all CPR interventions (Figure 6), it is observed that nine CTs with a very high percentage of visible minority Chinese (>60%) have the highest rates of public bystander CPR, relative to where all CPR interventions occurred in the study region (see Appendix 1). Of note, there are only 14 CTs in the study region with a percentage of Chinese greater than 60%. The fewest public CPR interventions – contrasted against the geography of all CPR interventions – were associated with higher median income areas (70 CTs with a median income>$34,000).
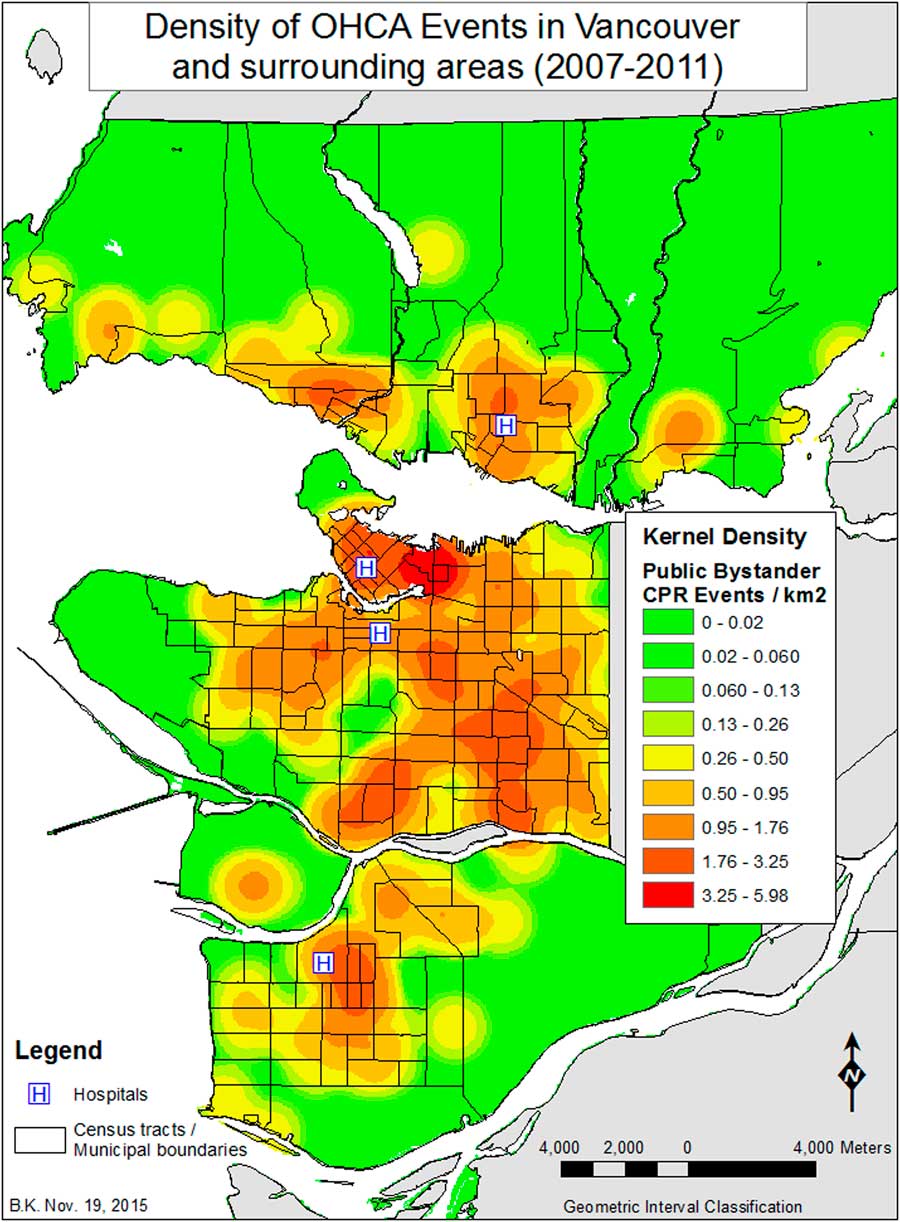
Figure 5 Kernel Density of public bystander CPR events in Vancouver and surrounding areas (2007–2011).
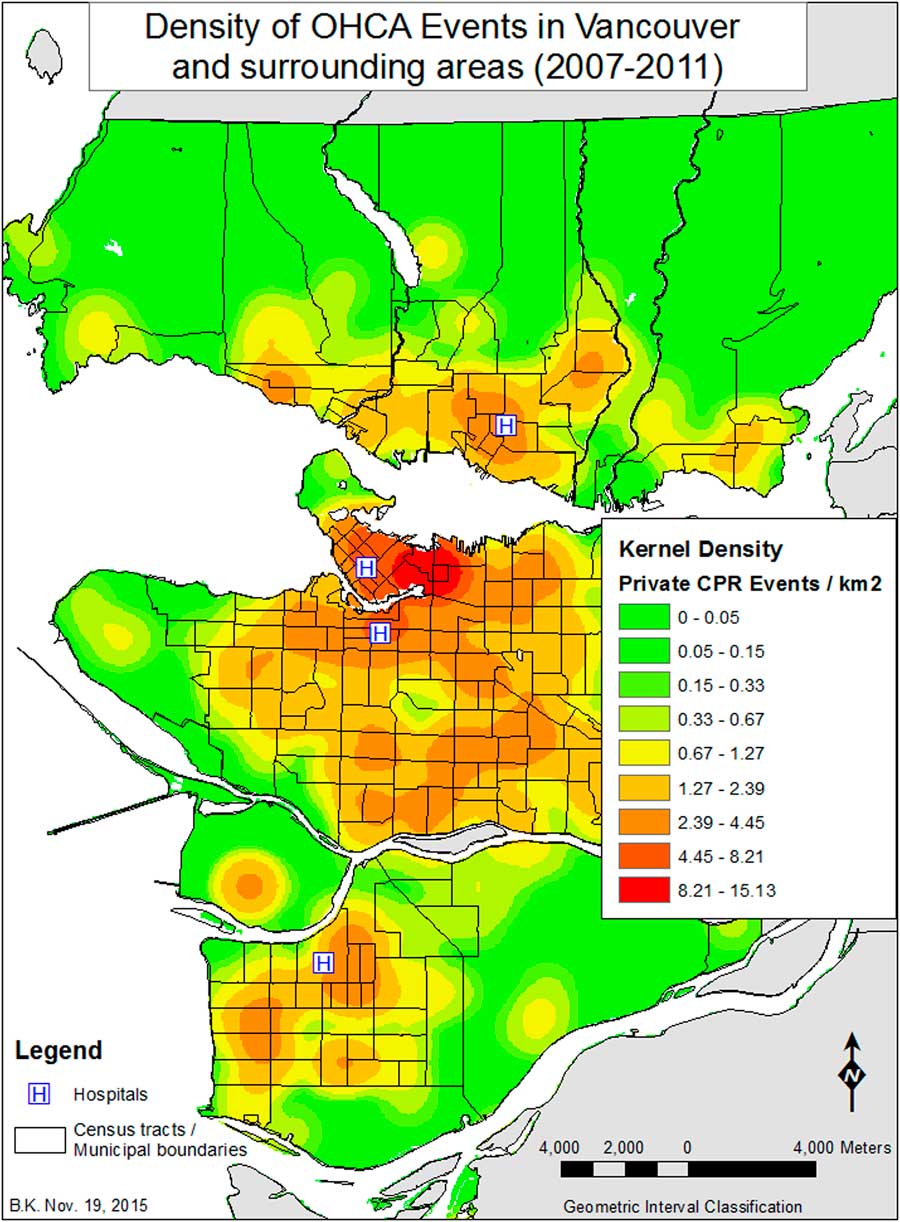
Figure 6 Kernel Density of private CPR events in Vancouver and surrounding areas (2007–2011).
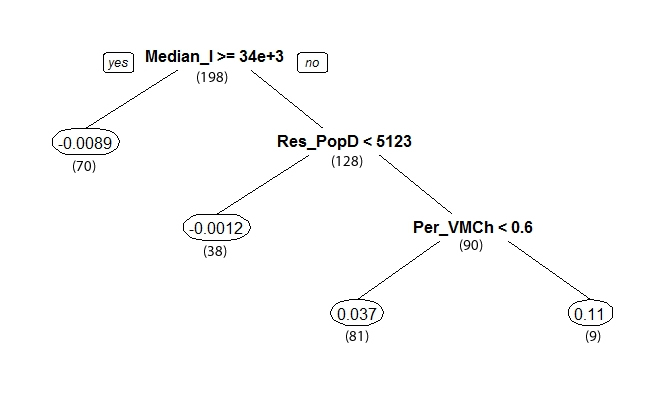
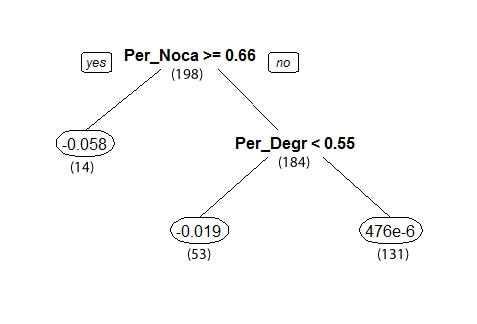
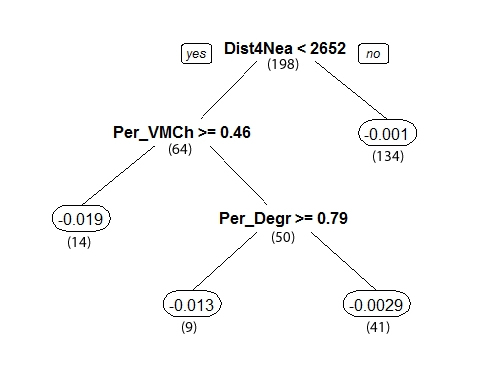
When looking at where private CPR events (n=472) occur relative to all private events (1261 cases), in CTs where the percentage of people who do not use a car to commute to work is greater than 66%, there are fewer cases of private CPR than would be expected (Figure 7). Outside of those areas, CTs with a low percentage of people with a degree (<55%) also exhibit fewer incidents of private CPR than would be expected. When we examined the relationship between private CPR events (n=472) to that of all CPR events (see Figure 6), more private CPR events occur in higher income areas (median income greater than $34,000), relative to the overall distribution of all CPR cases (n=1617), and the fewest in areas with higher population density and with a high percentage of visible minority Chinese.

Figure 7 Percent No-Car Commuters in Vancouver and surrounding areas (2007–2011).
To test whether distance to hospital had an impact on discharge with FNS, we should look at those events that had a CPC 1 or 2, of which there were only 169 cases (10.4% of all cases). The map (Figure 8) shows the distribution of the percentage of FNS events relative to all OHCA events and reflects, in part, the effects of low numbers on the results (i.e., the outlying areas often have only one to two cases), but also reflects the underlying socioeconomic factors identified in this study. Because we would have more confidence in a KD surface created with a greater number of cases, we used the complement of FNS cases (1443 cases with a CPC of 3, 4, or 5 [10 cases had an unknown CPC status]) to develop the difference surface (CPC 3, 4, or 5 minus all events). The results (see Figure 7) indicate that there were fewer CPC 3, 4, or 5 events (i.e., greater negative values) in CTs where the distance to the nearest hospital was less than 2.7 km or, conversely, there were more cases with a discharge of a CPC 1 or 2 if the distance from the CT to the nearest hospital is less than 2.7 km, where the geography of FNS events is contrasted to that of all OHCA events.
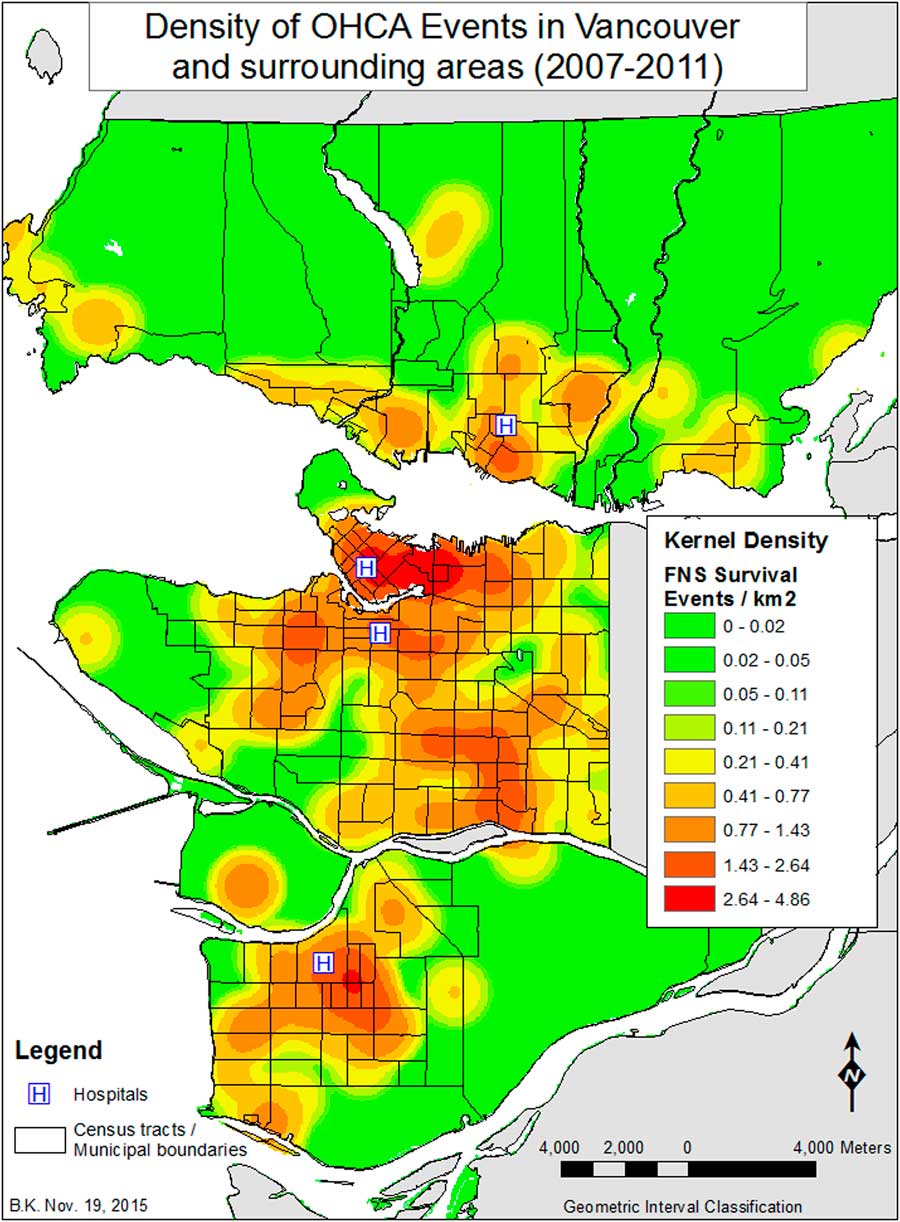
Figure 8 Kernel Density of Favourable Neurological Survival (FNS) events in Vancouver and surrounding areas (2007–2011).
DISCUSSION
This study is the first to explore the potential clustering of OHCA cases, using GIS analyses, at the individual city or health region level, and the potential explanatory variables (Table 1) associated with OHCA cases in Canada. Our study demonstrates important neighbourhood clustering of cases of OHCA in Vancouver and surrounding areas. Median income alone was not a significant predictor of survival with CPC 1 or 2, and OHCA cases occurring in low median income CTs were more likely to receive public bystander CPR than arrests occurring in high median income CTs. In addition, our study demonstrates that in the city of Vancouver and surrounding areas, distance to transport to one of four regional cardiac arrest centres (less than 2.7 km) was independently associated with survival to discharge with FNS (CPC 1 or 2).
Clustering of OHCA cases has been demonstrated in other large urban centres in North America.Reference Semple, Cudnik and Sayre 6 , Reference Nassel, Root and Haukoos 19 , Reference Root, Gonzales and Persse 23 Other studies have demonstrated that neighbourhoods with higher population densities demonstrate higher overall rates of OHCA,Reference Yasunaga, Miyata and Horiguchi 7 and our study shows a similar trend in the city of Vancouver and surrounding areas (see Figure 1); however, in this study population, density per se was not the dominant factor but rather the related factor percentage of non-car commuters (which correlates with population density at 42%) (see Figure 3). To our knowledge, our study is the first to explore this association in a single large urban Canadian centre. Our findings may help guide policy and resource planning for EMS, AED placement, and targeted public education campaigns.Reference Ong, Wah and Hsu 13
Our finding that distance of transport is a predictor of survival with FNS (CPC 1 or 2) differs from the majority of the prior work on this topic (see Figure 8). Two independent groups have demonstrated that transport distance to hospital is not a predictive factor for survival with FNS (CPC 1 or 2).Reference Cudnik, Schmicker and Vaillancourt 24 , Reference Spaite, Stiell and Bobrow 25 These two prior studies each recruited patients from multiple cities with varying demographics and population density characteristics, and with multiple, non-integrated EMS providers. However, although our study has smaller numbers of OHCA than these two studies, our study is from a single region with a single integrated EMS system. Prior work from a single region in Scotland demonstrates similar results to ours.Reference Lyon, Cobbe and Bradley 16 As a result, our study may be more applicable to the Canadian context of OHCA in large urban centres with a single EMS provider, predictable demographics, and population density. Further research in other major urban Canadian centres is warranted to further explore this trend.
Rates of OHCA have been demonstrated to be higher in areas of low socioeconomic status,Reference Reinier, Thomas and Andrusiek 18 whereas rates of public bystander CPR have previously been demonstrated to be lowest in areas of low socioeconomic status.Reference Vaillancourt, Lui and De Maio 17 , Reference Nassel, Root and Haukoos 19 , Reference Root, Gonzales and Persse 23 In our study, OHCA cases occurring in low median income CTs were more likely to receive public bystander CPR than arrests occurring in high median income CTs, whereas income was not found to be a factor in the geography of OHCA events. This variation from prior findings may be partially attributable to recent public education efforts and the rapid proliferation of public access AEDs.
A notable finding of our study is that, in CTs with high proportions of visible minority ethnic Chinese, we observed higher rates of public bystander CPR relative to the rest of the study area, but lower rates of private CPR intervention. In particular, in 9 of the 14 CTs with a very high percentage of visible minority Chinese (>60%), the highest rates of public bystander CPR in the entire study area were observed. To our knowledge, our study is the first in the OHCA literature to describe this phenomenon. Prior work from the United States and the United Kingdom has focused on bystander CPR rates of people of black, Hispanic, and South Asian (India, Pakistan, and Bangladesh) heritage.Reference Sasson, Magid and Chan 26 - Reference Moon, Bobrow and Vadeboncoeur 29 In addition, our study is the first to explore the demographic variable of commuter status as a descriptive and possible predictive variable for OHCA in Canada and internationally.Reference Flint and Cummins 30 , Reference Flint, Cummins and Sacker 31 In CTs with high proportions of citizens not using a car to commute to work (greater than 66%), rates of private CPR were lower than expected (see Figure 6). This finding was independent of income and may be explained by two possible mechanisms. Citizens in these CTs may be making a lifestyle choice to walk, ride bicycles, or use public transportation to commute to work on a regular basis. An alternative explanation is that this finding may reflect an economic reality of high housing prices that preclude car ownership that is most pronounced, but not unique to, Vancouver. Further work on this topic in Canada using the Ontario Marginalization Index is planned to explore the links between socioeconomic variables and survival from OHCA.Reference Buick, Allan and Ray 32
Our study has important implications for the clinical care of Canadians with OHCA. Specifically, nihilism in the prehospital and emergency department resuscitation of OHCA patients should be avoided because our study demonstrates that a substantial portion (10.4%) will survive with FNS (CPC 1 or 2). In addition, our study has important implications for health policy in Vancouver and surrounding areas. Prior studies using geospatial analysis and mathematical modelling have been used to target urban areas with low rates of bystander CPR for education campaigns and the optimal placement of AEDs.Reference Raun, Jefferson and Persse 33 , Reference Chan, Li and Lebovic 34 Our work may guide local efforts to improve survival from OHCA. Finally, our study has described two novel socioeconomic variables, which may predict survival from OHCA in Canada: neighbourhoods with high proportions of visible minority ethnic Chinese and no-car commuter status. Further work in other large urban Canadian centres is warranted to explore these variables as possible predictors of survival from OHCA.
STRENGTHS AND LIMITATIONS
Our study has two important strengths. The data were prospectively collected by trained research assistants, abstracting prehospital data from standardized template charting. This particular cohort of OHCA patients has been described previously.Reference Grunau, Reynolds and Scheuermeyer 35 We used recognized and validated GIS techniques to explore the relationships and predictors of survival with FNS.
Our study has two important limitations. The overall number of cases in our study limited our ability to conduct exploratory analyses and test various hypotheses. Another important limitation is the moderate degree of geographic accuracy available. To maintain patient confidentiality, ROC positional data are truncated at the second decimal place.
CONCLUSION
This is the first GIS-based study to examine OHCA in a single large Canadian centre, and clustering of OHCA consistent with areas of high population density and non-car commuters was observed. Our observed rates of public bystander public CPR were higher in low median income CTs, and the rates of CPR in private settings were higher in high median income CTs. In our study, distance of transport (less than 2.7 km to the nearest hospital) was associated with survival with favourable neurological survival for patients with OHCA. Our results may be more valid for moderate to large Canadian cities compared to prior work on this topic.
Acknowledgements
The authors wish to thank Dr. Chris Cheung and Dr. Mona Habibi from the Internal Medicine residency program at the University of British Columbia for their assistance with data collection, and the St Paul’s Emergency Physicians group for their support during this project.
Competing interests: None declared.
SUPPLEMENTARY MATERIALS
To view supplementary material for this article, please visit http://dx.doi.org/10.1017/cem.2016.384