1. Introduction
Recent observations have revealed an apparent high sensitivity of the dynamics of Greenland’s fast-flowing, marine-terminating outlet glaciers to environmental forcing (Reference Holland, Thomas, de Young, Ribergaard and LyberthHolland and others, 2008; Reference Howat, Joughin, Fahnestock, Smith and ScambosHowat and others, 2008; Reference Rignot, Koppes and VelicognaRignot and others, 2010; Reference StraneoStraneo and others, 2010), with the implication that short-term changes at glacier margins can result in substantial, long-term changes in ice-sheet dynamics and mass balance (Reference Rignot and KanagaratnamRignot and Kanagaratnam, 2006; Reference Bamber, Alley and JoughinBamber and others, 2007; Reference Howat, Joughin and ScambosHowat and others, 2007; Reference Nick, Vieli, Howat and JoughinNick and others, 2009). The external environment appears to impact outlet glacier dynamics through two primary mechanisms: by forcing changes in the position of the calving front through increased calving and melt (e.g. Reference Nick, Vieli, Howat and JoughinNick and others, 2009) and by varying the supply of meltwater into the subglacial drainage system (e.g. Reference Joughin, Tulaczyk, Fahnestock and KwokJoughin and others, 1996).
It has been demonstrated that the balance of glacier stresses controlling ice flow is highly responsive to changes in the position and thickness of the calving front (Reference ThomasThomas, 2004; Reference Howat, Joughin, Tulaczyk and GogineniHowat and others, 2005; Reference Joughin, Das, King, Smith, Howat and MoonJoughin and others, 2008c; Reference Nick, Vieli, Howat and JoughinNick and others, 2009). Thus, relatively brief periods of increased calving and retreat, lasting days or less, can result in acceleration of ice flow that is sustained over much longer periods as the glacier evolves following the perturbation at the front (Reference JoughinJoughin and others, 2008a). Furthermore, this acceleration results in dynamic thinning, due to ice stretching, which can promote further retreat (Reference Meier and PostMeier and Post, 1987; Reference PfefferPfeffer, 2007). Thus, increases in the calving rate can trigger long-term changes in glacier dynamics, providing a direct and rapid link between environmental forcing and ice-sheet mass balance.
The actual processes linking variations in climate and ocean conditions to calving of the ice front, however, remain poorly understood. Previous studies point to variations in sub-ice-shelf melt rates and the seasonal formation of a dense mix of icebergs and sea ice within the fjord, termed a melange, as the most important controls on temporal variations in calving rate (Reference Sohn, Jezek and van der VeenSohn and others, 1998; Reference Reeh, Thomsen, Higgins and WeidickReeh and others, 2001; Reference Holland, Thomas, de Young, Ribergaard and LyberthHolland and others, 2008; Reference JoughinJoughin and others, 2008a; Reference Amundson, Fahnestock, Truffer, Brown, Lüthi and MotykaAmundson and others, 2010). Reference Rignot, Koppes and VelicognaRignot and others (2010) measured melt rates at the fronts of West Greenland glaciers reaching several m d−1, suggesting that approximately half of the ice flux through the front was lost directly to melting, with the remainder due to calving of icebergs. Reference StraneoStraneo and others (2010) found evidence of similarly high melt in southeast Greenland due to the penetration of subtropical ocean waters deep into a glaciated fjord. These results support the conclusions of Reference Holland, Thomas, de Young, Ribergaard and LyberthHolland and others (2008) and Reference Howat, Joughin, Fahnestock, Smith and ScambosHowat and others (2008) that large-scale retreat of Jakobshavn Isbræ and numerous glaciers in the southeast was primarily driven by ocean warming and increased melting at the ice/ocean boundary.
The formation of a seasonal ice melange at the glacier front may also control calving, possibly through mechanical buttressing as the melange is compressed and sheared along the fjord walls (Reference Sohn, Jezek and van der VeenSohn and others, 1998; Reference Reeh, Thomsen, Higgins and WeidickReeh and others, 2001; Reference JoughinJoughin and others, 2008a,Reference Joughinb). Reference Amundson, Fahnestock, Truffer, Brown, Lüthi and MotykaAmundson and others (2010) found that the melange at Jakobshavn Isbræ exerts a back-pressure that slows the calving rate by preventing the capsizing of large icebergs, thereby regulating seasonal advances of the ice front, and therefore its speed and discharge. However, Jakobshavn Isbræ’s melange may be exceptional in both its extent and its persistence. It is unclear whether a more typical melange that disintegrates in late spring is as important in controlling ice dynamics. If so, a possible future reduction in melange thickness and seasonal duration, through ocean and/or atmospheric warming, could contribute to further retreat and acceleration.
In addition to forcing at the glacier front, the subglacial drainage of meltwater may also result in significant changes in flow speed over short timescales. Ryder Glacier, North Greenland, accelerated by 300% over a 7 week period following drainage of a supraglacial lake (Reference Joughin, Tulaczyk, Fahnestock and KwokJoughin and others, 1996). It remains unknown, however, how widespread and frequent such events are, or whether or not they will increase in frequency and extent under climate warming, preventing an assessment of their importance to ice-sheet mass balance.
Seasonal drainage of meltwater to the glacier bed induces a uniform acceleration of 50–150 m a−1 over a ∼300 km long section of the West Greenland margin, causing a large fractional acceleration of the interior ice sheet but a small fractional change in the speed of fast-moving outlet glaciers (Reference JoughinJoughin and others, 2008b). One possible explanation for this apparent low sensitivity of fast-moving outlet glaciers to changes in subglacial meltwater discharge is that these glaciers sustain high basal water pressures (i.e. effective pressures near flotation) year-round. Fast basal ice motion may lead to rapid collapse of subglacial drainage conduits, preventing the formation of tunnels (i.e. R channels; Reference RöthlisbergerRöthlisberger, 1972) that would otherwise reduce water pressures. High subglacial water pressures may also be maintained by the continuous supply of basal melt due to frictional heating (Reference JoughinJoughin and others, 2008b). In contrast, the flow speed of land-terminating glaciers in Greenland does appear to decrease in mid-summer, following acceleration at the onset of melt, reflecting the seasonal evolution of the subglacial drainage system towards increased efficiency (Reference Van de WalVan de Wal and others, 2008; Reference Shepherd, Hubbard, Nienow, McMillan and JoughinShepherd and others, 2009). Observations of glacier flow speed with the duration and resolution needed to resolve hydrologically related signals are limited to a few glaciers, however, and the general importance of seasonal fluctuations in meltwater to outlet glacier dynamics and mass balance remains unclear.
Comparisons between changes in glacier front position and speed and seasonal variability in likely forcing parameters (e.g. ocean conditions, melange presence and air temperature) can provide insight into the processes controlling the sensitivity of these glaciers to short-term environmental changes. In this study, we investigate seasonal and multi-year variations in ice speed and front position on several marine-terminating outlet glaciers in a region that has undergone substantial warming over the past decade, to infer (1) the role of subglacial hydrology in controlling outlet glacier motion and (2) the effect of air and ocean conditions, including ice-melange formation and disappearance, on glacier front position and speed.
1.1. Study area
The Uummannaq district on the central coast of West Greenland (Fig. 1) encompasses 11 marine-terminating ice-sheet outlet glaciers draining into a common fjord system, linked to Baffin Bay by a 50 km wide channel. We examine data from six glaciers with ice fronts wider than 3 km. This area was chosen because (1) it has undergone an annual surface air-temperature warming of nearly 2°C over the past decade with high variability in interannual temperature and sea-ice conditions (section 3), (2) it represents many different glacier morphologies sharing one fjord system, and therefore presumably shares similar environmental forcing, allowing for the examination of the role of glacier geometry in regulating response, (3) visual inspection between recent and older imagery suggested that some glaciers had retreated substantially over the past decade while others had remained stable, allowing for a basis of comparison, and (4) shielding from the high Nussuaq peninsula to the south and strong, anticyclonic katabatic outflows from the ice sheet result in more cloud-free imagery and more complete time series than are available for other regions with numerous outlet glaciers (e.g. the southeast and northwest coasts).

Fig. 1. Satellite image of Uummannaq district, Greenland, labeled with the six observed outlet glaciers and the Uummannaq (UMD) weather station. Red dots indicate the location of the speed observations shown in Figure 4 and the UMD weather station. Red box shows the positions of the sea-surface temperature data shown in Figures 2 and 3.
Little is documented about the recent behavior of the Uummannaq glaciers. Reference Moon and JoughinMoon and Joughin (2008) observed retreats of 400–800 m a−1 between 1992 and 2000. Fewer glaciers had a sustained retreat between 2000 and 2006. Reference Rignot and KanagaratnamRignot and Kanagaratnam (2006) measured stable discharge rates between November 2000 and April 2005 at Umiámáko and Rink Isbræ, and a more than doubling of speed on Kangerdlugssûp sermerssua over that time. These measurements were made tens of km inland of the ice front. Reference JoughinJoughin and others (2008b) observed little or no seasonal variation in speed at a point ∼30 km inland of the front at Store Gletscher between 2004 and 2007. Ice-thickness data are not available for any of the glacier trunks, but ice fluxes and calving-front freeboard heights imply thicknesses greater than 500 m for all the glaciers studied.
2. Datasets and Methods
2.1. AWS data
We present daily average air-temperature data collected from the Asiaq (Greenland Survey) network automatic weather station (AWS) No. 512 in Uummannaq township (UMD in Fig. 1; 70°40′45.6″ N, 52°07′39.3″ W; 48 m a.s.l.). The sensor is 2 m above bedrock and is shielded and ventilated. This station has been in operation since August 1990, although data are only currently available from 1 January 2000 onward. The data are quality-controlled by Asiaq.
2.2. Satellite imagery
This study uses imagery from two different satellites. Firstly, we use Level 1T 15 m resolution Landsat 7 Enhanced Thematic Mapper Plus (ETM+) panchromatic images distributed by the US Geological Survey. Level 1T data have undergone systematic radiometric and geometric corrections using known satellite positioning, camera orientation, ground control and a digital elevation model (DEM). The geodetic accuracy of the product depends on the accuracy of the ground control points and the resolution of the DEM. Since we are using these data to detect changes in surface features, we are concerned with the co-registration error (i.e. spatial precision) of pixels, rather than absolute registration accuracy. Co-registration error was determined by measuring image-to-image displacement of stationary features (e.g. bedrock) as part of the feature-tracking process described in section 3.4. This error was found to be two to three pixels or 60–90 m. Failure of the scan-line corrector (SLC) on the ETM+ on 31 May 2003 resulted in image banding, with bands increasing in width to the edges of the scene and a ∼20% loss of image data. However, geometric quality of the data, when properly masked, is as good as the pre-SLC failure data and this imagery remains useful for mapping front positions, identifying drainage events and obtaining ice surface velocities from feature tracking through modification of a standard algorithm (section 3.4).
Secondly, we use 250 m resolution imagery from bands 1 and 2 of the Moderate Resolution Imaging Spectroradiometer (MODIS) aboard the Terra (available since 1999) and Aqua (available since 2002) satellites. These data are geolocated based on known satellite positioning and distributed by the NASA Goddard Space Flight Center through its online Level 1 and Atmosphere Archive and Distributed System (LAADS).
2.3. MODIS sea-surface temperature (SST)
We obtained a monthly time series of SST from January 2000 until December 2009 at a point located in the center of the main fjord mouth (Fig. 1), in order to compare ocean variability with glacier behavior. We obtained 9 km, monthly gridded, MODIS Global Level 3 mapped thermal infrared SST data from the Physical Oceanography Distributed Active Archive Center (PO.DAAC). We used SST data derived from daytime imagery from both Aqua and Terra satellites. These data are masked for sea ice, which results in missing data values in some winter months.
2.4. Ice-front area-change mapping
For each available ETM+ image from 1999 to 2009, we mapped the change in ice-front position using the method of Reference Moon and JoughinMoon and Joughin (2008). On each image, we manually digitized (with a computer mouse) the outline of a polygon bounded on the down-glacier edge by the ice front, on each lateral side by parallel lines, and on the upstream side by an arbitrary straight line. For each sequential image, this polygon was overlain on the image, and the ice-front border of the polygon was adjusted to the new front position. The difference in the area of the polygon between successive images is the area change of the front, and the average retreat distance is obtained by dividing the area of retreat by the polygon width. This procedure yields a less arbitrary measure of front position change than the change of a single point at the front.
2.5. Ice-melange clearing date
Landfast sea ice traps calved icebergs near the glacier fronts, creating a dense mixture (melange) of sea ice and icebergs. The ice melange in this region forms gradually, beginning in January and February, achieves maximum area coverage typically in late April and then disintegrates rapidly, usually within 1 or 2 days, in May or early June. While the melange forms too slowly, and winter imagery is too poor, to place an unambiguous date on its annual formation, its disappearance is clearly visible in daily MODIS imagery, which we use to identify the first day of melange clearing. We define this event as the first day of the year on which motion of icebergs at the front and some open water is visible between sequential MODIS images, indicating loosening and breakup of the melange. Sometimes clouds obscure the time of clearing, in which case the first cloud-free day is recorded, resulting in a maximum of 3 days uncertainty, not significantly influencing our results. During the 2008 field season at Store Gletscher we observed that sudden (∼24 hour) melange clearing on 28 May was caused by 25 m s−1 winds that broke up the melange and pushed it down the fjord.
2.6. Ice velocity from repeat-image feature tracking
We measure glacier surface velocities by calculating the offset of visible surface features between repeat, co-registered ETM+ images. We use the Multi-Image/Multi-Chip (MIMC) algorithm (Reference Ahn and HowatAhn and Howat, 2009), which automatically determines the offset between subsets (chips) of sequential images by fitting a surface to the two-dimensional cross-correlation field between chips (Reference Scambos, Dutkiewicz, Wilson and BindschadlerScambos and others, 1992; Reference Howat, Joughin, Tulaczyk and GogineniHowat and others, 2005). For pre-SLC failure images, performing this calculation in fast Fourier transform (FFT) space maximizes the efficiency of the algorithm. For post-SLC failure images, this calculation must be done in image space, ignoring the scan-line offset bands, increasing the processing time and decreasing the spatial resolution. The processing difference does not affect algorithm accuracy. Errors in feature-tracking methods result from (1) ambiguity in the cross-correlation peak, (2) co-registration errors and (3) false correlations. The error induced by error source 1 is typically in the 0.25–0.50 pixel range or, in this case, 4–7 m. We minimize the effect of error source 2 by removing the mean offset measured over off-ice regions, resulting in a random error of typically 0.5 pixels or ∼7 m for the lower sections of the glaciers where our data were acquired. Error source 3 is minimized by applying threshold and neighbor filtering and by taking the median value of a cluster of solutions. Here we present only the median speed value within a 1 km2 area of the center of each glacier trunk, 4–6 km from the ice front, extracted from a grid of individual tracking solution vectors spaced 100 m apart. Since errors will vary with image quality and time separation, we present all speeds with their individual error ranges that are the sum of error sources 1–3.
3. Uummannaq District Air and Sea-Surface Temperatures and Ice-Melange Clearing Date, 2000–09
Monthly average air temperature observed at UMD is shown in Figure 2a. On average, July is the warmest month (8.8°C), while March is the coldest (−14.7°C). A linear regression of average temperatures between June 2000 and June 2009 yields a 0.18°C a−1 increase over that period, a similar rate of warming to that observed around central and southern Greenland since the mid-1990s (Reference BoxBox, 2002; Reference Chylek, Box and LesinsChylek and others, 2004). The typical melt season begins in early April and lasts through early September, with a much narrower range of average temperatures during the melt season than in the winter. Average summer (June–August) air temperatures were greatest in 2007 (1.41°C above average) and lowest in 2002 and 2004 (1.55 and 1.58°C below average, respectively).

Fig. 2. Monthly average (a) air temperatures observed at the Uummannaq AWS and (b) MODIS SST extracted from 9 km gridded data at the point shown in Figure 1. Monthly average air temperatures calculated from mean daily air-temperature data.
Monthly average SST at the mouth of Uummannaq Fjord is shown in Figure 2b. Months without measurements are due to the presence of sea ice. Sea ice typically clears from this location in March, followed by a rapid SST increase, peaking in July (7 out of 10 years) or June, followed by decreasing temperatures through winter, with sea ice returning in December. SST was observed throughout the winter of 2002/03, indicating anomalously reduced sea-ice extent that year, consistent with observations from southeast Greenland (Reference Howat, Joughin, Fahnestock, Smith and ScambosHowat and others, 2008). Average summer (June–August) SST was highest in 2001 (0.52°C above average) and lowest in 2004 (0.80°C below average).
Annual melange-clearing dates for all glaciers mapped from MODIS imagery are shown in Table 1. We find a clear latitudinal pattern in the melange-clearing date, with glaciers in the south of the study area clearing earlier than glaciers in the north; on average, Store Gletscher clears 17 days earlier than Umiámáko and Ingia Isbræ. The average first day of melange clearing at the six observed glacier fronts varied by 30 days between 2000 and 2009, with an earliest date of 26 May (2003) and a latest date of 25 June (2001) (Fig. 3a). In order to compare the timing of melange clearing with surface melt, we calculated the cumulative sum of daily mean temperatures above zero (i.e. positive degree-days (PDD)) from the daily air-temperature data from 1 January each year to the day of melange clearing. PDD provides an index of surface melt intensity, and if melange clearing were forced by surface melting we would expect clearing to occur once PDD had reached some consistent threshold. We find, however, a large range (>50%) in PDD at the day of melange clearing (Fig. 3b). Cumulative PDD correlates positively with the day of melange clearing simply because of the increase in PDD with later dates. A significant (r 2 = 0.57, p < 0.05) correlation does appear between the day of melange clearing and average May SST (Fig. 3c), with higher SST correlating with earlier melange-clearing day. The correlation is not significant for April or June.
Table 1. Annual day of ice-melange clearing, as observed in MODIS imagery, for each glacier fjord in the study area


Fig. 3. (a) The day that the ice melange in front of the six Uummannaq district outlet glaciers shown in Figure 1 began to clear each year between 2000 and 2009, as determined from inspection of daily, 250 m resolution MODIS imagery. The median of the five glaciers is shown, but the day did not vary more than a few days between different glaciers. (b) The commutative PDD measured at UMD by the day of ice-melange clearing. (c) Anomaly in average SST for May at the Uummannaq Fjord mouth.
4. Observations of Ice-Front Position and Flow Speed
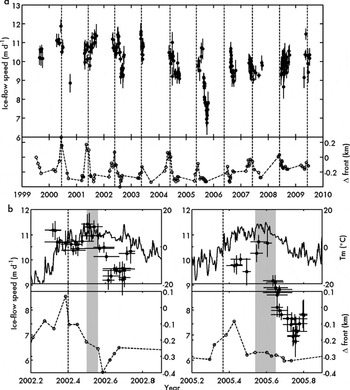
The fronts of Ingia Isbræ and Umiámáko were stable between 1999 and 2003, displaying small seasonal oscillations, but retreated rapidly between 2003 and 2009 (Figs 4 and 5). Umiámáko’s 4 km retreat is the largest observed in the study area. Retreat occurred in discrete periods each year, starting within 10 days prior to the clearing of the ice melange and lasting until the end of July, and was followed by relatively small readvances in the spring. Average melt-season glacier speeds increased by approximately 20% at Ingia Isbræ and 300% at Umiámáko during the retreat period. Prior to retreat, both glaciers underwent seasonal oscillations in speed of approximately 50%. Examining the years with the most complete speed datasets in terms of time-span and density of coverage, we find that in 2005 Ingia Isbræ slowed while the front continued to retreat and the peak variation in speed showed similar timing to that of air temperature. Similarly, in 2001, Umiámáko accelerated while the front was still advancing and before melange clearing, and then declined before the front had stabilized for the season. A similar seasonal pattern in speed at Umiámáko is apparent in the less complete data for the summers of 2003 and 2004. In 2008, Umiámáko speeds increased steadily by 100% throughout the melt season as the front retreated 1.3 km, continuing after air temperatures declined to near freezing.

Fig. 4. (a) Ice-flow speed of Ingia Isbræ at the position shown in Figure 1. The horizontal spans of the error bars denote the time separation of the images. Vertical hatches mark the day on which ice-free conditions are first observed at the glacier front in MODIS imagery. Circles with hatches are change in the ice-front position (negative values are retreat). (b) Subsets of (a) with the addition of (solid curve) UMD mean daily air temperature.

Fig. 5. Same as Figure 4 for Umiámáko.
The front of Rink Isbræ displays the largest seasonal oscillation (±1500 m) among the six glaciers, with a typical pattern of spring advance switching to retreat just prior to ice-melange clearing, lasting to mid-July (Fig. 6). No clear multi-year change in front position or speed is evident in the data. This is consistent with the observations of Reference Rignot and KanagaratnamRignot and Kanagaratnam (2006). Seasonally, speed varies by approximately 25%, coincident in timing with front position.

Fig. 6. Same as Figure 4 for Rink Isbræ.
The front of Kangerdlugssûp sermerssua oscillates seasonally by 100–200 m, with advance reversing to retreat just prior to melange clearing, but displays no multi-year retreat (Fig. 7). Average melt-season speeds decreased slightly (<10%) between 2000 and 2007. Seasonal speed variations are dominated by a pattern of abrupt acceleration at the time of melange clearing and front retreat, followed immediately by deceleration throughout the rest of the melt season, reaching a lower speed by mid-summer than the early-season value. The clearest examples of this mid-summer slowing occur in 2005 and 2007. In both years, speeds increased beginning in mid-April, and peaked near the time of melange clearing but well before the peak in summer temperatures. Speed then decreased as the front retreated, reaching a minimum in September that was less than half the peak speeds and well below the initial April speeds. This seasonal variability likely explains the 100% increase in speed reported by Reference Rignot and KanagaratnamRignot and Kanagaratnam (2006) for this glacier between November 2000 and April 2005.

Fig. 7. Same as Figure 4 for Kangerdlugssûp sermerssua.
Sermeq silardleq retreated 2 km between 2000 and 2009, with nearly all the retreat occurring between 2003 and 2005. Seasonal oscillations in front position are small (<100 m) relative to the multi-year change (Fig. 8) and small compared to the other glaciers observed. Average melt-season speed increased by ∼15% over the observation period, with seasonal variations of 15–30% visible in the data. In 2002, speed increased by 30% between April and early July and decreased in late August. This pattern resembles the variation in front position, although the peak in speed appears slightly before the peak in retreat. Early-season data are missing for 2005, but speed appears to have decreased in mid-summer, while the front continued to retreat, with the timing of peak speed more consistent with the timing of peak air temperature.

Fig. 8. Same as Figure 4 for Sermeq silardleq.
The front of Store Gletscher has remained in approximately the same position for at least 40 years (Reference Weidick, Williams and FerrignoWeidick, 1995 p. C41) and displays a 200 m seasonal oscillation in front position (Fig. 9). The advance typically occurs rapidly in April and May, reversing to a similarly brief period of rapid retreat near the time of melange clearing. Average melt-season speeds remained stable between 2000 and 2009, varying <10%, with the exceptions of 2002 and 2005, when speed decreased by 30–60% in mid-summer. The time series of speed at a point ∼30 km inland over the same period in Reference JoughinJoughin and others (2008b) displays little variation in speed, suggesting that the magnitude of speed variability decreased inland.

The timing of the anomalous decelerations in 2002 and 2005 at Store Gletscher coincides with drainage of surficial meltwater lakes visible in satellite imagery (Fig. 10). Between 1 and 24 July 2002, a period which brackets the peak in speed and initial decline, a 2.2 km2 lake located 17 km above the ice front completely drained. This lake had not drained in the previous year. Between 16 July and 8 August 2008, a period which brackets the period of peak speed, another, 3.5 km2, lake located 3 km further upstream drained completely while the lower lake grew in area by over 50%. This lake remained approximately the same size until 17 August, and then drained completely by 26 August as glacier speed declined to approximately 60% of the peak.

Fig. 10. Landsat 7 images of Store Gletscher with acquisition dates, showing drainage of the (left circle) lower and (right circle) upper lakes. The time-span of these images in relation to ice speed, front position and air temperature is delineated in Figure 9.
5. Summary and Discussion
Several patterns in the timing of melange clearing, front position, ice speed and surficial melt lake drainage emerge from the data. These are discussed below.
5.1. Variability in front position
All the observed glaciers tend to advance in spring, when the ice melange is present, and then retreat rapidly just prior to clearing of the melange. We cannot infer a causal relationship from this correlation: the melange and calving fronts may be reacting independently to changes in ocean circulation or some other forcing. These observations, however, are consistent with other studies (Reference Reeh, Thomsen, Higgins and WeidickReeh and others, 2001; Reference JoughinJoughin and others, 2008b; Reference Amundson, Fahnestock, Truffer, Brown, Lüthi and MotykaAmundson and others, 2010), suggesting that the calving rate may be sensitive to the presence of the melange. A well-bonded melange may effectively act like a thin ice shelf, transmitting enough back-stress to the glacier front to slow or even stop calving, resulting in front advance (Reference Amundson, Fahnestock, Truffer, Brown, Lüthi and MotykaAmundson and others, 2010). The newly advanced front should be near flotation, as this ice would calve without stabilization from the melange. Weakening of the melange, likely due to increased submarine melting as suggested by the significant correlation with May SST at the fjord system entrance, leads to initially rapid calving and retreat, as the near-floating ice breaks apart (Reference Amundson, Fahnestock, Truffer, Brown, Lüthi and MotykaAmundson and others, 2010). Conversely, waves generated by calving and the rotation of large icebergs will serve to further weaken and disperse the melange. Consistent with our observations, calving and retreat will then slow as the front thickens, with the inland extent of retreat the point where calving rate is balanced by the ice discharge. This position will be determined by ocean conditions, as well as glacier thickness and fjord topography and width. Rapid (>1 m d−1) submarine melting has been observed in glaciers in the next fjord system south of our study area as late as August (Reference Rignot, Koppes and VelicognaRignot and others, 2010). This suggests that the abrupt halt in retreat in late summer observed at many of the glaciers may be due to geometric controls (i.e. fjord and glacier shape) rather than external forcing.
Three glaciers (Ingia Isbræ, Umiámáko Isbræ and Sermeq silardleq) underwent multi-year retreat starting in 2003, the year with the least sea-ice formation, earliest melange-clearing day and warmest May SST anomaly. None of the glaciers appear to have advanced in the spring of that year, so calving continued from near the previous year’s minimum front position. This suggests that a reduced spring advance, combined with an extended calving season, potentially the result of reduced melange and warmer fjord water, may have triggered multi-year retreat of these glaciers. Extended calving may have led to retreat beyond a point of stability, such as a bathymetric high or fjord wall constriction, resulting in a decrease in lateral or basal shear stress and sustained acceleration, which will lead to further thinning, due to stretching, and retreat (Reference PfefferPfeffer, 2007). In this way, anomalous ocean warming in a single season may induce long-term tidewater glacier instability.
5.2. Variability in ice-flow speed
For glaciers not undergoing multi-year retreat (we refer to these as ‘stable’ glaciers), ice-flow speeds tend to increase near the time of ice-melange clearing and then decrease within 1–2 months. In most cases, this decrease occurs while the front continues to retreat. Only in the case of Rink Isbræ does speed correlate with front position seasonally in the manner observed at Jakobshavn Isbræ by Reference JoughinJoughin and others (2008b). This correlation is attributed to variations in back-stress as the floating tongue expands and contracts seasonally up to 6 km. Rink Isbræ exhibits a seasonal oscillation in front position (∼1 km) more than twice as large as any other glacier in the Uummannaq study area. Thus, smaller oscillations in front position may not produce a significant perturbation to the glacier stress regime. A similar observation was made for glaciers in southeast Greenland (Reference Howat, Joughin, Fahnestock, Smith and ScambosHowat and others, 2008). Further supporting this conclusion is the observation that glaciers with interannual retreat also undergo substantial increases in speed during retreat, whereas they show no correlation with smaller seasonal front retreat prior to multi-year retreat. Jakobshavn Isbræ also showed little or no seasonal variation in speed prior to its retreat (Reference Echelmeyer and HarrisonEchelmeyer and Harrison, 1990).
We interpret the mid-summer slowdown observed for stable glaciers as reflecting the seasonal evolution of the subglacial drainage system. This pattern closely resembles the well-observed progression of melt-season speeds on alpine glaciers, which undergo speed-up in late spring as meltwater penetrates to an inefficiently draining bed, raising basal water pressures, increasing the area of separation between the ice and bed and causing increased basal sliding (Reference Iken and BindschadlerIken and Bindschadler, 1986; Reference Fountain and WalderFountain and Walder, 1998). This spring speed-up is followed by an abrupt mid-summer slowing as an efficient (tunnelized) drainage system evolves and basal separation area decreases (Reference Fountain and WalderFountain and Walder, 1998). For the glaciers in our study area, the link between seasonal variations in speed and subglacial meltwater drainage is strengthened by the coincidence of slowing with the drainage of supraglacial lakes, as shown for Store Gletscher (Figs 9 and 10). If a hydraulic connection between the surface and the bed exists, but an efficient basal drainage system does not, filling of lakes would increase water storage, inducing faster sliding over the trunk, as postulated by Reference Kamb, Engelhardt, Fahnestock, Humphrey, Meier and StoneKamb and others (1994). Heat dissipation from turbulent water flow, as well as cavity expansion from increased sliding, would promote the formation of efficiently draining tunnels (Reference RöthlisbergerRöthlisberger, 1972; Reference KambKamb, 1987). Thus, an efficient drainage system will develop, lowering the englacial water table, possibly resulting in lake drainage as well as decreased sliding. This is similar to what has been observed on numerous alpine glaciers (e.g. Reference Mair, Nienow, Sharp, Wohlleben and WillisMair and others, 2002) and, over shorter timescales, on the inland Greenland ice sheet (Reference DasDas and others, 2008).
While observations from Store Gletscher provide the clearest examples of the effect of melt-season lake drainage on ice-flow speed, a similar pattern of slowing coincident with seasonal drainage of surface melt is apparent for all other stable glaciers in the study area. Figure 11 shows an example of the seasonal filling and drainage of small lakes and water-filled crevasses on Sermeq silardleq in 2002. In late May, meltwater begins to fill crevasses, forming many small lakes that grow to a maximum size by mid-June, just before the peak in ice speed is reached (Fig. 8). Crevasses and lakes are mostly drained over the southeastern tributary and trunk of the glacier by 1 July, and over the entire trunk, including one large lake at the tributary junction, by 24 July when speed has declined. We also note that no icebergs are visible near the front of the glaciers following drainage of the lakes, which may indicate dispersal by plumes of subglacial meltwater.

Fig. 11. A sequence of Landsat 7 imagery of Sermeq silardleq from 2002 showing the appearance and drainage of impounded surficial meltwater (intermittent dark areas on the glacier surface).
In several cases, including those mentioned above likely associated with periodic lake drainage, we observe late-summer decelerations to well below the early-spring speed. This behavior is similar to the onset of the quiescent phase of glacier motion following a surge, in which very high rates of subglacial water discharge force development of a pervasive tunnel system with a low area of basal separation and low water pressures, causing low rates of sliding (Reference FowlerFowler, 1987). As meltwater discharge decreases at the end of the melt season, these tunnels will collapse, increasing water pressures and leading to the re-establishment of an inefficiently draining, distributed drainage system and increased sliding. By the following spring, the drainage system should have evolved to near a steady state with the discharge of water produced by basal melting.
6. Conclusions
Consistent with previous studies, we find a clear correlation between seasonal retreat of the front and the timing of melange clearing, which in turn correlates significantly with average May SST but not surface air temperature. With our dataset we cannot determine whether the correlation between front position and melange clearing is due to the loss of mechanical resistance to calving provided by the melange or is simply the result of the calving front and melange reacting synchronously but independently to other factors (e.g. ocean circulation or subglacial meltwater discharge). Our data, however, do support the hypothesis that multi-year retreats were, at least in part, triggered by the lack of a spring readvance and expanded calving season resulting from early melange clearing and/or warming of fjord waters, which caused the glaciers to retreat beyond points of stability created by fjord shape. Of the glaciers showing multi-year retreat, all began to retreat in 2003, which had the decade’s earliest date of melange clearing as well as the warmest average May SST and the lowest winter sea-ice concentration. Jakobshavn Isbræ and numerous glaciers along the southeast Greenland coast also exhibited exceptional retreat in 2003, previously attributed to anomalously high ocean temperatures and low sea-ice concentration (Reference Holland, Thomas, de Young, Ribergaard and LyberthHolland and others, 2008; Reference Howat, Joughin, Fahnestock, Smith and ScambosHowat and others, 2008; Reference JoughinJoughin and others, 2008a). Substantial variations in the behavior of neighboring glaciers within a singular fjord system underscore the complex factors (e.g. bathymetry and glacier shape) controlling the response of individual glaciers to external forcing, which itself may vary substantially between glaciers sharing the same connection to the ocean (Reference Rignot, Koppes and VelicognaRignot and others, 2010).
As expected from the results of numerous other studies, increases in speed on glaciers undergoing multi-year, tidewater retreat correspond closely to changes in front position. With the exception of Rink Isbræ, however, we do not find that seasonal variations in front position are the dominant influence on ice-flow speed for stable glaciers. Instead, we observe that these glaciers follow a seasonal speed pattern that resembles observations from alpine glaciers, with increasing speed during the onset of melt in the spring, indicating that water reaches an inefficiently draining bed, followed by an abrupt slowdown in midsummer as drainage efficiency increases. In many cases, the slowdown corresponds to the drainage of supraglacial lakes and water-filled crevasses, which may indicate a sudden switch to efficient subglacial drainage under water pressures nearly equal to the overburden pressure. Corresponding to lake drainage, we observe as much as a 40% mid-summer reduction in speed on a glacier moving faster than 10 m d−1, with larger variations on slower-moving glaciers, demonstrating that seasonal variations in subglacial hydrology can exert a substantial influence on the dynamics of fast-moving outlet glaciers and this influence may be widespread for glaciers not undergoing multi-year retreat.
Our observations demonstrate that short-timescale variability in oceanographic conditions at the fronts of outlet glaciers and subglacial drainage conditions can result in significant and sustained variations in glacier flow speed and, therefore, ice discharge and mass balance. These processes have yet to be included in models of glacier and ice-sheet evolution. Most importantly, further study is needed to determine how such processes may change under future climate warming and may influence long-term ice-sheet stability.
Acknowledgements
This work was funded by grant NNX08AQ83G from NASA to I.M.H. and by funding from the Ohio State University (OSU) Climate Water Carbon Program to I.M.H. and J.E.B. The suggestions of reviewers J. Amundsen and P. Christoffersen significantly improved the manuscript.