

I. INTRODUCTION
The rapid development of advanced digital technologies has positively impacted societies and communities in many ways. However, misuse of these technologies can also cause problems, for example, speech being duplicated and altered on purpose by a thief or a bad person to commit a crime. Here are a few examples; a program named STRAIGHT can be used to manipulate voice quality, timbre, pitch, speed, and other attributes flexibly [Reference Kawahara and Morise1]. It can change the speech content from “No, I did not” to “Yes, I did” while speaker individuality is preserved. Another speech synthesis software called“Speech Morphing” can create emotionally intelligent voices to communicate with users [Reference Kawahara and Matsui2]. Many voice conversion products can convert someone's voice into a specific target voice [Reference Toda, Black and Tokuda3]. Such programs enable speech signals to be modified in a more realistic way, so it is difficult to detect any abnormality. Legal issues regarding unauthorized speech-signal modification and tampering have risen in number and are of interest, especially when recorded speech signals contain vital information, for instance, a recorded voice used in court or in a criminal investigation. Speech watermarking can be a possible solution for such issues [Reference Yan, Lu, Sun and Pan4–Reference Karnjana, Galajit, Aimmanee, Wutiwiwatchai and Unoki9].
In speech watermarking, secret information called a “watermark” is embedded into a host signal in such a way that it is difficult to remove it from the signal [Reference Nematollahi and Al-Haddad10]. To detect tampering or modification in speech signals, the watermark is extracted and compared with the original watermark. The extracted watermark can be analyzed to check the originality and the integrity of the speech signal. The properties required for the watermarking scheme depend upon the user's objective. For the purpose of detecting tampering, speech watermarking should satisfy four required properties [Reference Podilchuk and Delp11]. The first property is inaudibility. The human auditory system should not perceive the secret information. In other words, an embedded watermark should not degrade the sound quality of the original signal. Human ears should not be able to distinguish the difference between a watermarked signal and the original signal. The second property is blindness. A blind watermarking scheme requires only the watermarked signal in order to extract the watermark; the host signal is not required. The third property is robustness. An embedded watermark should persist when non-malicious signal processing, e.g. compression or speech codecs, is applied to its host. The last property is fragility. An embedded watermark should be sensitive to tampering or malicious signal processing. The watermark should be easily destroyed when the watermarked signal is tampered with. In this paper, we call the requirement that an embedded watermark should be robust against non-malicious operations but fragile to malicious attacks“semi-fragility” [Reference Karnjana, Unoki, Aimmanee and Wutiwiwatchai12].
In the literature, Yan et al. proposed a semi-fragile speech-watermarking scheme that uses the quantization of linear prediction parameters [Reference Yan, Lu, Sun and Pan4]. However, the parameters used in the scheme were selected simply by trial and error. Park et al. proposed a watermarking scheme with pattern recovery to detect tampering [Reference Park, Thapa and Wang5]. The watermark pattern was attached to a speech signal so that when tampering occurred, the pattern was destroyed, and the destroyed pattern could be used to identify the tampering. However, only three types of tampering were considered in their scheme: substitution, insertion, and removal. Wu and Kuo proposed a fragile speech-watermarking scheme that uses simplified marking in the discrete Fourier transform magnitude domain [Reference Wu and Kuo6]. Their results were reasonable, but their work focused only on tampering with speech content. Other aspects, such as tampering with a speaker's individuality, were neglected. Unoki and Miyauchi proposed a watermarking method that employs the characteristics of cochlear delay [Reference Unoki and Miyauchi7]. Their proposed scheme could detect tampering, e.g. reverberation, but it was slightly poor in robustness when the speech codec G.726 was used on watermarked signals. Wang et al. proposed a speech-watermarking method based on formant tuning. Their proposed scheme satisfied both inaudibility and semi-fragility. However, it was too fragile to some types of non-malicious signal processing, such as pitch shifting and echo addition with unnoticeable degrees [Reference Wang, Unoki and Kim8,Reference Wang and Unoki13].
Recently, we proposed a semi-fragile watermarking method based on singular-spectrum analysis (SSA) for detecting tampering in speech signals [Reference Karnjana, Galajit, Aimmanee, Wutiwiwatchai and Unoki9]. A watermark was embedded into a host signal by changing a part of the singular spectrum of the host signal with respect to the watermark bit. From our studies, we discovered that the SSA-based watermarking scheme could be made robust, fragile, or semi-fragile depending on the part of the singular spectrum that was modified. The modification affects both the sound quality of the watermarked signal and the robustness of the scheme. Therefore, the interval of the singular spectrum to be modified must be determined appropriately in order to balance inaudibility and robustness. We used differential evolution (DE) optimization to determine such an interval [Reference Karnjana, Unoki, Aimmanee and Wutiwiwatchai14]. However, DE is time-consuming and, consequently, cannot be practically used in any real-time or near real-time applications.
In this work, we improve the performance of the watermarking scheme for detecting tampering. We deploy a neural network to estimate the deterministic relationship of the input signal and parameters that are used to specify the suitable part of the singular spectrum of the input signal. We propose a novelconvolutional neural network(CNN)-based parameter estimation method. Since the effectiveness of a neural network depends strongly on the dataset that is used to train the neural network, the crucial ingredient of this work is the framework that we use to generate a good dataset. As mentioned earlier, DE has proved its usefulness in the trade-off between inaudibility and robustness. We expect that it can effectively be used as a basis of the framework for generating a training dataset.
The rest of the paper is organized as follows. Section II describes the proposed scheme. The embedding process, extraction process, and tampering detection are provided in detail. Since the parameters used in both the embedding and extraction processes are input-dependent, the proposed scheme needs an efficient parameter-estimation method. The concepts of this method are explained in Section III. Performance evaluation and experimental results are given in Section IV. A discussion and the conclusion are in Sections V and VI, respectively.
II. PROPOSED WATERMARKING SCHEME
The proposed watermarking scheme is based on the framework of SSA and consists of two primary processes, an embedding process and an extraction process, as illustrated in Fig. 1. It is a blind scheme, i.e. its extraction process can extract hidden information from only a watermarked signal. Also, our extraction process is parameter-free in the sense that all parameters can be estimated from the watermarked signal by using a CNN-based algorithm.

Fig. 1. Proposed framework: embedding process (left) and extraction process with tampering detection (right).
This section briefly gives details on these two processes and how to use them for detecting tampering.
A) Embedding process
The embedding process produces a watermarked signal by taking a host signal and a watermark as its inputs, and one watermark bit will be embedded into one frame. There are six steps in the speech embedding process, as shown in Fig. 1 (left), which are detailed as follows.
1. Segmentation. A host signal is segmented into M non-overlapping frames of length N, where M is the total number of watermark bits. Let F denote a segment of length N, i.e. F = [f 0 f 1 … f N−1]T, where f i for i=0 to N − 1 are N samples of a segment
2. Matrix Formation. We map a segment F to a matrix X with the following equation.
(1)where L, which is called a “window length” of the matrix transformation, is not less than 2 and is not greater than N. The size of X is L × K, where K=N−L+1. $${\bf X} = \left[ \matrix{f_0 & f_1 & f_2 & \cdots & f_{K-1} \cr f_1 & f_2 & f_3 & \cdots & f_{K} \cr f_2 & f_3 & f_4 & \cdots & f_{K+1} \cr \vdots & \vdots & \vdots & \ddots & \vdots \cr f_{L-1} & f_L & f_{L+1} & \cdots & f_{N-1}} \right],$$
3. Singular Value Decomposition (SVD). We factorize the real matrix X by using SVD, i.e.
(2)where the columns of U and those of V are the orthonormal eigenvectors of XXT and of XTX, respectively, and Σ is a diagonal matrix whose elements are the square roots of the eigenvalues of XTX.$$ {\bf X} = {\bf U}{\bf \Sigma}{\bf V}^{\rm T}, $$Let
$\sqrt {\lambda _{i}}$ for i=1 to q denote the elements of Σ in descending order, where $\sqrt {\lambda_{q}}$ is the smallest non-zero eigen value. We call $\sqrt {\lambda _{i}}$ a “singular value” and call $\{\sqrt {\lambda _0},\, \sqrt {\lambda _1},\, {\ldots },\, \sqrt {\lambda _{q}}\}$ a “singular spectrum.”4. Singular Value Modification. A singular spectrum is modified according to the watermark bit to be embedded and requires the properties of the watermarking scheme. It is shown in our previous work that modifying high-order singular values distorts the host signal less but is sensitive to noise or attacks. Contrarily, modifying low-order singular values can improve robustness but causes sound quality to be poor [Reference Karnjana, Galajit, Aimmanee, Wutiwiwatchai and Unoki9,Reference Karnjana, Unoki, Aimmanee and Wutiwiwatchai14]. Thus, there is the trade-off between robustness and sound quality. In this work, we aim for semi-fragility. Therefore, we propose the following embedding rule.
Given a singular spectrum
$\{\sqrt {\lambda _0},\, \sqrt {\lambda _1},\, {\ldots },\, \sqrt {\lambda _{q}}\}$, a specific part of this singular spectrum, which is $\{\sqrt {\lambda _p},\, \sqrt {\lambda _{p+1}},\,{\ldots },\, \sqrt {\lambda _{q}}\}$, is modified according to the embedded-watermark bit w with
(3)where$$ \sqrt{\lambda_{i}^{\ast}} = \left\{ \matrix{\sqrt{\lambda_{i}} + \alpha_i\cdot \left(\sqrt{\lambda_{p}} - \sqrt{\lambda_{i}}\right), & {\rm if } w = 1,\cr \sqrt{\lambda_{i}} \quad {\rm (i.e. unchanged)}, & {\rm if } w = 0,} \right.$$$\sqrt{\lambda_{i}^{\ast}}$ is the modified singular values for i=p to q, $\sqrt{\lambda_p}$ is the largest singular value that is less than $\gamma \cdot \sqrt{\lambda_0}$, and αi, which is called the “embedding strength,” is normally distributed over the interval [p, q] and has a maximum value of 1. Note that αi is a positive real value that is less than 1. Specifically, αi for i=p to q is determined by
(4)where μ and σ2 are the mean and the variance of the Gaussian distribution, respectively.$$\alpha_i = e^{-{(i-\mu)^2}/{2{\sigma^2}}},$$Hence, our embedding rule requires three parameters, which are γ, μ, and σ. We have shown that by appropriately adjusting these parameters regarding the host signal, we can achieve a good balance between robustness and sound quality [Reference Karnjana, Galajit, Aimmanee, Wutiwiwatchai and Unoki9].
As shown in Fig. 1 (left), these parameters are provided by the CNN-based parameter estimation, which is to be discussed in detail in the next section. An example of the part
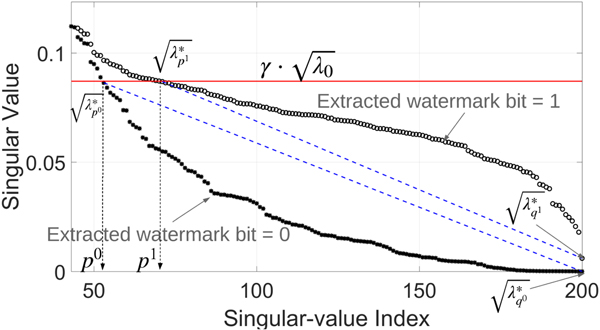
$\{\sqrt{\lambda_p},\, \sqrt{\lambda _{p+1}},\,{\ldots },\, \sqrt {\lambda _{q}}\}$ of a singular spectrum is shown in Fig. 2.5. Hankelization. Let Σ* be a diagonal matrix defined by
(5)We compute a watermarked matrix X* (the matrix into which the watermark bit is embedded) from the product UΣ*VT. Then, we hankelize the matrix X* to obtain the signal F*, which is the watermarked segment. The hankelization is the average of the anti-diagonal i + j = k + 1, where i and j are the row index and the column index, respectively, of an element of X*, and k (for k=0 to N−1) is the index of element F*.$$ {\bf \Sigma}^{\ast} = \left[\matrix{\sqrt{\lambda_{0}}&\cdots & 0 & 0 & \cdots & 0 \cr \vdots &\ddots & \vdots & \vdots & \vdots \cr 0 & \cdots & \sqrt{\lambda_{p-1}} & 0 &\cdots & 0 \cr 0 & \cdots & 0 & \sqrt{\lambda_{p}^{\ast}} &\cdots & 0 \cr \vdots & \vdots & \vdots & \vdots & \ddots & \vdots \cr 0 & 0 & 0 & 0 &\cdots & \sqrt{\lambda_{q}^{\ast}}} \right].$$6. Segment Reconstruction. The watermarked signal is finally produced by sequentially concatenating all watermark segments.


Fig. 2. Example of the part  $$\{\sqrt{\lambda_p},\, \sqrt{\lambda_{p+1}},\, {\ldots},\, \sqrt{\lambda_{q}}\}$ of a singular spectrum: (a) selected interval of singular spectrum without embedding, (b) embedding watermark bit 1, and (c) embedding watermark bit 0. The red line indicates the threshold level $\gamma \cdot \sqrt{\lambda_{0}}$, and the blue dashed line connects $\sqrt{\lambda_{p}}$ and $\sqrt{\lambda_{q}}$.
B) Extraction process
The extraction process takes a watermarked signal as an input for extracting an embedded watermark. The extraction process consists of four steps, as shown in the dashed box of Fig. 1 (right). The first three steps are the same as those of the embedding process, which are segmentation, matrix formation, and singular value decomposition. The fourth step is watermark-bit extraction. Watermark bits are extracted in this step by decoding singular spectra, and how the spectra are decoded depends on how they are modified in the embedding process. To understand the idea behind this step, let us consider the two singular spectra in Fig. 3. This figure shows two extracted singular spectra of one watermarked frame:  $\{ \sqrt{\lambda_{0^0}^{\ast}},\,{\ldots },\,\sqrt{\lambda _{p^0}^{\ast}},\,{\ldots},\,\sqrt{\lambda_{q^0}^{\ast}}\}$ and $\{ \sqrt {\lambda _{0^1}^{\ast}},\,{\ldots },\,\sqrt {\lambda _{p^1}^{\ast}},\,{\ldots },\,\sqrt {\lambda _{q^1}^{\ast}}\}$. The superscripts 0 and 1 of the indices of singular values denote the embedded watermark bits. It can be seen that most singular values (circles) under the red line are above the blue dashed line connecting $\sqrt {\lambda_p}$ and $\sqrt {\lambda_q}$, when the embedded watermark bit is 1, but most of the singular values (asterisks) under the red line are under the blue dashed line when the embedded watermark bit is 0. Therefore, we can use the following condition to determine the hidden watermark bit w*.
 $$ {w}^{\ast} = \left\{ \matrix{0, & {\rm if } \displaystyle \sum_{i=p}^{q}\left(\sqrt{\lambda_i^{\ast}}-l (i)\right) \lt 0,\cr 1, & {\rm if } \displaystyle \sum_{i=p}^{q}\left(\sqrt{\lambda_i^{\ast}}-l (i)\right) \geq 0,} \right. $$
where l(i) is the corresponding values on the blue dashed line, which is defined by
 $$ l(i) = \left(\displaystyle{\sqrt{\lambda_p^{\ast}}-\sqrt{\lambda_q^{\ast}} \over p-q} \right) \cdot (i-q)+\sqrt{\lambda_q^{\ast}}.$$
The output of the fourth step is the extracted watermark bit w* (j) for j=1 to M.

Fig. 3. Decoding hidden watermark bit: if most of the singular values (circle) that are under threshold level  $\gamma \cdot \sqrt{\lambda_{0}}$ are above blue dashed line, extracted watermark bit is 1, but if most of the singular values (asterisks) that are under threshold level $\gamma \cdot \sqrt{\lambda_{0}}$ are under blue dashed line, extracted watermark bit is 0.
C) Tampering detection
To check whether watermarked signals have been tampered with or not, extracted-watermark bits w* (j) are to be compared with embedded-watermark bits w(j) for j=1 to M. To detect tampering, embedded-watermark bits w(j) are assumed to be known by the owner or an authorized person. Theoretically, when there is tampering, watermark bits that are embedded into the location of the tampering are destroyed. Tampering could be detected by mismatches between w* (j) and w(j). Since we embed one watermark bit into one frame of the host signal, each mismatch can be used to indicate the corresponding frame that has possibly been tampered with.
III. CNN-BASED PARAMETER ESTIMATION
As mentioned above, we recently proposed a watermarking scheme in which an evolutionary-based optimization algorithm, DE, was deployed to find input-dependent parameters used in the embedding process of the scheme [Reference Karnjana, Unoki, Aimmanee and Wutiwiwatchai14]. In that work, we called the method of determining input-dependent parameters“parameter estimation.” We found that our DE-based parameter estimation could give parameters that result in a good balance between the robustness and inaudibility of the proposed scheme [Reference Karnjana, Unoki, Aimmanee and Wutiwiwatchai14]. However, the DE-based method is costly in terms of computing power [Reference Karnjana, Unoki, Aimmanee and Wutiwiwatchai15,Reference Karnjana, Unoki, Aimmanee and Wutiwiwatchai16]. To reduce the computational time, we consequently proposed another approach based on a CNN [Reference Galajit, Karnjana, Aimmanee and Unoki17]. As a result of using this CNN-based parameter estimation, we greatly reduced the computational time by approximately 10 000 times [Reference Galajit, Karnjana, Aimmanee and Unoki17]. Although we succeeded in reducing the computational cost, we had to sacrifice robustness in this previous work. Therefore, in this work, we improve the CNN-based parameter estimation by improving the quality of the CNN training dataset. In this section, we explain how we obtain a high-quality dataset and an improved CNN-based approach.
In implementing the improved CNN-based parameter estimation, there are two crucial steps, which are training the CNN and generating a high-quality dataset. The details of these two steps are provided in the following subsections.
A) Training CNN
The CNN is a feedforward neural network and a supervised learning scheme that is trained by a training dataset consisting of many different pairs of input and target. In other words, these pairs are used to find a deterministic function that maps an input to an output, and the trained CNN performs this function [Reference LeCun and Bengio18].
In this work, the CNN is used to find the parameters γ, μ, and σ for each speech segment. The reason we choose the CNN in this work is because we know that there is a relationship between singular values and signal frequencies [Reference Karnjana, Unoki, Aimmanee and Wutiwiwatchai15,Reference Karnjana, Unoki, Aimmanee and Wutiwiwatchai16], for instance, high-order singular values are associated with a high-frequency band, and, contrarily, low-order singular values are associated with a low-frequency band. Therefore, we hypothesize that a CNN trained with inputs represented in both time and frequency domains can perform better compared with either a CNN trained with time-domain input or that trained with frequency-domain input only. Thus, we choose to use spectrograms of the input segments as the inputs in the training dataset. Since a spectrogram is two-dimensional (2D) and the CNN can extract patterns in 2D data more efficiently than other neural networks, we therefore designed our novel parameter estimation on the basis of the CNN.
As mentioned in the previous section, there are three parameters, γ, μ, and σ, to be optimized. Two of these parameters, μ and σ, relate to the embedding strength αi. Thus, they contribute to the robustness of the proposed scheme. The parameter γ directly defines the number of modified singular values. Thus, it contributes more to the sound quality aspect of the proposed scheme. Accordingly, we implement two CNNs, one for μ and σ and the other for γ. The input of both CNNs is a spectrogram of size 13 × 67. The CNNs are composed of two convolutional layers, two pooling layers, and two normalization layers. The first convolution layer convolutes an input spectrogram with 128 kernels of size 3 × 3 and a stride of size 2 × 2, and the other convolutes with 64 kernels of size 3 × 3. A rectified linear unit function is used as the activation function. A kernel size of 2 × 2 is applied for all pooling layers. The flattened output is combined with a fully connected layer with 256 units. The outputs of the first CNN and the second CNN are the vector  $[\mu \ \sigma ]^{\rm T}$ and the parameter γ, respectively. The structure of both CNNs is shown in Fig. 4.

Fig. 4. Structure of CNNs in this work: (a) CNN used to determine embedded strength parameters and (b) CNN used to determine the parameter of γ.
B) Generating high-quality dataset
Since DE proved its effectiveness in finding the optimum parameters in our previous work [Reference Karnjana, Unoki, Aimmanee and Wutiwiwatchai14], we therefore deploy it to generate a dataset for training our CNNs. The definition of a high-quality dataset in this proposed method is a dataset in which a good sample of input–output pairs is used in CNN training so that the CNN can map from the input and specific output with high-precision estimation. DE works as follows.
Let x be a D-dimensional vector that we want to find concerning a cost function C(x), i.e. we are searching for x such that C(x) is minimized. The DE algorithm consists of four steps: initialization, mutation, crossover, and selection [Reference Storn and Price19].
First, we initialize vectors xi,G, for i = 1 to NP, where NP is the size of the population in the generation G. For the initialization step, G=1.
Second, each xi,G is mutated to a vector vi,G+1 by  ${\bf v}_{i,G+1} = \displaystyle {\bf x}_{r_1,G}+F\cdot ({\bf x}_{r_2,G}-{\bf x}_{r_3,G})$, where i, r 1, r 2, and r 3 are distinct and random from {1, 2, …, N P}. The predefined constant F determines the convergence rate of DE and is in the interval [0, 2].
Third, each pair of xi,G and vi,G+1 is used to generate another vector ui,G+1 by using the following formula. Given that
 $${\bf u}_{i,G+1} = \left[\matrix{u_{1i,G+1} & u_{2i,G+1} &{\ldots} & u_{Di,G+1}}\right]^{\rm T},$$
 $${\bf u}_{ji,G+1} = \left\{\matrix{{\bf v}_{ji,G+1}, \hfill & {\rm if} \Xi{(j)} \les C R{\rm or} j= \upsilon, \hfill \cr {\bf x}_{ji,G}, \hfill & {\rm otherwise},\hfill}\right.$$ $\Xi {(j)}$ is a random real number in the interval [0, 1], CR is a predefined constant in [0, 1], and υ is random from {1, 2, …, D}.
In the last step, we compare C(xi,G) with C(ui,G+1). If C(xi,G) < C(ui,G+1), xi,G+1 = xi,G; otherwise, xi,G+1 = ui,G+1. Once obtaining all members of the generation G+1, we iteratively repeat the mutation step, the crossover step, and the selection step until a specific condition is satisfied. Then, the DE algorithm gives xi, which yields the lowest cost in the last generation as the answer.
A DE optimizer used for generating the dataset is shown in Fig. 5. Note that we include a few compression algorithms, as well as coding algorithms, in our DE optimizer because we want to ensure that the proposed scheme is robust against these operations. Note also that the extraction processes in Fig. 5 are a bit different from the extraction process described in Section II-B. The difference is that all extraction processes in the DE optimizer know the parameter γ used in the embedding process, whereas the extraction process in Section II-B is entirely blind.

Fig. 5. DE optimizer used to generate dataset.
The cost function C developed in this work is defined as follows.
 $$\eqalign{{C} &= \beta_1 {\rm BER}_{{\rm NA}} + \beta_2 {\rm BER}_{{\rm MP3}} + \beta_3 {\rm BER}_{{\rm MP4}} \cr & \quad+ \beta_4 {\rm BER}_{{\rm G711}} + \beta_5 {\rm BER}_{{\rm G726}},}$$
where βi for i=1 to 5 are constants and  $\sum_{\forall_i} \beta_i = 1$, and BER is the bit-error rate. The BER can be used to represent the extraction precision and is defined as
 $${\rm BER} = \displaystyle{1 \over M}{\sum_{j=1}^{M} w(j)\oplus {w}^{\ast} (j)},$$
where w(j) and w* (j) are the embedded-watermark bits and the extracted-watermark bits, respectively, and the symbol ⊕ is a bitwise XOR operator. Hence, the terms BERNA, BERMP3, BERMP4, BERG711, and BERG726 denote the average BER values when there is no attack, when MP3 compression is performed, when MP4 compression is performed, when G.711 speech companding is performed, and when G.726 companding is performed on watermarked signals, respectively.
Note that, although our cost function is a function of only BERs, we can set the upper bound of the parameter γ in the DE algorithm to control the sound quality of watermarked signals. Issues regarding the cost function are to be discussed at length in Section V after we have shown our evaluation results.
The framework used to generate the training dataset is shown in Fig. 6.

Fig. 6. Framework for generating training dataset.
IV. EVALUATION AND RESULTS
In our experiment, 12speech signals from the ATR database B set (Japanese sentences) were used as the host signals [Reference Takeda20]. The reason we choose this dataset is to fairly compare among our previous methods and the proposed method. All signals had a sampling rate of 16 kHz, 16-bit quantization, and one channel. A watermark was embedded into host signals starting from the initial frame. The frame size was 25 ms or 400 samples. Thus, there were 40 frames for 1 s. In other words, the embedding capacity was 40 bps. One hundred and twenty bits were embedded into each signal in total, and the embedding duration of each signal was 3 s. To prepare the dataset for training the CNNs, we used 200 different frames from each host signal. Therefore, there were 2400 segments in our training dataset.
In our simulation, we set the hyperparameters for the DE algorithm as follows. The population size in each generation (NP) was 30, as suggested by Storn et al. [Reference Storn and Price19]. The maximum number of generations [max (G)] was 30. The upper bounds of the parameters γ, μ, and σ were 0.0085, 220, and 150, respectively; their lower bounds were 0.001, 80, and 0, respectively. The two constants F and CR were 0.5 and 0.9, respectively, as suggested by Storn et al [Reference Storn and Price19]. The weights βi in the cost function were set as follows. β1 = 1/3, β2 = 4/21, β3 = 4/21, β4 = 4/21, and β5 = 2/21.
In addition to the frame size N, our proposed scheme requires another hyperparameter, which is the window length of the matrix formation (L). In all simulations, we set it to one-half of the frame size, which was 200.
The proposed scheme was evaluated with respect to four aspects: the sound quality of watermarked signals, semi-fragility, the ability to detect tampering detection, and the computational time. We compared evaluation results with our previously proposed methods [Reference Karnjana, Galajit, Aimmanee, Wutiwiwatchai and Unoki9,Reference Karnjana, Unoki, Aimmanee and Wutiwiwatchai12] and three other conventional methods: a method based on embedding information into the least significant bit (LSB) [Reference Bossia and Pitas21], a cochlear-delay-based (CD-based) method [Reference Unoki and Miyauchi7], and a formant-enhancement based (FE-based) method [Reference Wang, Unoki and Kim8].
A) Sound quality evaluation
Three objective measurements were used to evaluate the speech quality of watermarked signals: the log-spectral distance (LSD), the perceptual evaluation of speech quality (PESQ), and the signal-to-distortion ratio (SDR). The LSD is a distance measure (expressed in dB) between two spectra, which are the spectra of the original signal and the watermarked signal. The LSD is defined by
 $${\rm LSD} = \sqrt{\displaystyle{1 \over 2\pi}\int\limits_{-\pi}^{\pi} \left[10\log_{} \displaystyle{P(\omega) \over {P}^{\ast} (\omega)}\right]^2d\omega},$$
where P(ω) and P* (ω) are the spectra of the original signal and the watermarking signal, respectively.
The PESQ measures the degradation of a watermarked signal compared with the original signal [Reference Beerends, Hekstra, Rix and Hollier22]. The PESQ score ranges from very annoying (− 0.5) to imperceptible (4.5). Note that we used the PESQ software recommended by the International Telecommunication Union (ITU) [Reference Recommendation23].
The SDR is the power ratio (expressed in dB) between the signal and the distortion, which is defined by
 $${\rm SDR} = 10 \log \displaystyle{\sum_{n} [A(n)]^2 \over \sum_{n} [A(n)-{A}^{\ast} (n)]^2},$$
where A(n) and A* (n) are the amplitudes of the original and watermarked signals, respectively.
In this work, we set the criteria for good sound quality as follows. The LSD should be less than 1 dB, a PESQ score of 3.0 was set as the acceptable quality, and the SDR should be greater than 30 dB [Reference Wang, Miyauchi, Unoki and Kim24].
The results of the sound quality evaluation are shown in Table 1. All methods satisfied the criteria for good sound quality. Besides the LSB-based method, our proposed one outperformed the others. The proposed scheme was improved considerably in terms of sound quality in comparison with the previously proposed one.
Table 1. Sound-quality evaluations: proposed scheme versus other methods.

B) Semi-fragility evaluation
To detect tampering, a watermarking scheme should be robust against non-malicious speech processing, e.g.compression and speech codecs, and fragile to malicious attacks, e.g. pitch shifting and bandpass filtering. Robustness can be indicated by the bit-error rate (BER), as defined in (11). In this work, we chose a BER of 10% as our threshold. A robust scheme should have a BER of less than 10%. If the BER is higher than 20%, the speech signal is considered to have been tampered with. The speech signal is presumably unintentionally modified or tampered with at a low degree if its BER is between 10 and 20% [Reference Karnjana, Galajit, Aimmanee, Wutiwiwatchai and Unoki9].
We evaluated the semi-fragility of the proposed scheme by performing 10 signal processing operations on the watermarked signals as follows. Four were non-malicious operations: G.711 speech companding, G.726 companding, MP3 compression with 128 kbps, and MP4 compression with 96 kbps. Six were possible malicious operations: band-pass filtering (BPF) with 100–6000 Hz and − 12 dB/octave, Gaussian-noise addition (AWGN) with 15 and 40 dB signal-to-noise ratios (SNR), pitch shifting (PSH) by ± 4, ± 10, and ± 20%, single-echo addition with − 6 dB and delay times of 20 and 100 ms, replacing 1/3 and 1/2 of the watermarked signals with an un-watermarked segment, and ± 4% speed changing (SCH).
The results are shown in Table 2. The LSB-based method was excellent in robustness when there was no attack, but it was too fragile to all other operations (except for G.711). The other methods were semi-fragile and could be used for detecting tampering. However, the FE-based method was too robust against echo addition. Thus, it cannot be used to detect tampering when a watermarked signal has been tampered with by this attack. The proposed method was robust in the cases of no attack and the G.711 codec and was fragile to other attacks. However, it was too fragile to MP4 compression. Compared with our previously proposed method, it was more robust against the G.726 codec. Thus, it can be used to detect tampering in speech signals. Also, the BERs of the proposed method can be associated with the degree of tampering. For example, when the degree of pitch shifting increases, the BER increases. This can be used to indicate the degree of attacks.
Table 2. BER (%): proposed scheme versus other methods.

C) Tampering detection ability
As described in Section II-C, tampering can be detected by checking the mismatch between extracted-watermark bits w* (j) and embedded-watermark bits w(j) for j=1 to M. In this section, we demonstrate how it can be done in two experiments.
In the first experiment, a 29 × 131 bitmap image of the word “APSIPA,” as shown in Fig. 7 (a), was used as the watermark. To embed this image, which composed 3799 bits of information, the first 320 frames of all 12 speech signals were connected to construct a new 95 s host signal. Note that the duration was 95 s because our embedding capacity was 40 bps, and there were 3799 bits in total. After embedding the image into the host signal, we divided it into three segments, and the middle segment of the watermarked signal was tampered with by performing the operations listed in Table 2. The reasons we can consider some of these operations to be tampering are as follows. Adding white noise can be considered as channel distortion. Replacing watermarked speech with un-watermarked speech can be considered as content modification. Speeding up or slowing down a watermarked signal can be considered as modifying the duration and tempo of speech. Pitch shifting can be considered as manipulating the individuality of the speaker. Filtering with a low-pass filter is regarded as removing specific frequency information of the speech.

Fig. 7. Comparison of watermark image between original image (a) and reconstructed images after performing following signal-processing operations: (b) no attacks, (c) MP3, (d) G.711, (e) G.726, (f) MP4, (g) PSH −20%, (h) PSH +20%, (i) SCH +4%, (j) SCH −4%, (k) BPF, (l) PSH −10%, (m) PSH +10%, (n) AWGN (40 dB), (o) echo (100 ms), (p) replace (1/3), (q) PSH −4%, (r) PSH +4%, (s) AWGN (15 dB), (t) echo (20 ms, and (u) replace (1/2).
The results are shown in Fig. 7. The hidden image could be correctly extracted when there was no tampering with the watermarked signal, as shown in Fig. 7 (b). The extracted images from other tampered-watermarked signals are shown in Figs 7 (c)–7 (u). It can be seen that the watermark bits in the tampered segment were destroyed, and the destroyed area of the extracted image was associated with the tampered speech segment. In our experiment, this destroyed area was the middle two characters of the word “APSIPA.” Moreover, the degree of tampering could be observed from the extracted image. For example, the middle segments of the watermarked speech signals whose extracted images are shown in Figs 7 (n) and 7 (s) were attacked by adding white Gaussian noise (AWGN). It can be seen that the middle part of the extracted image of Fig. 7 (s) was more severely damaged because the speech signal of Fig. 7 (s) was added with stronger noise. Similarly, Figs 7 (g), 7 (l), 7 (q),7 (h), 7 (m), and 7 (r) (all of which were attacked by pitch shifting with different degrees) showed the same tendency. The part of the extracted image was more severely damaged when the degree of the attack increased. Therefore, we can use the destroyed areas to identify the tampered segments of the watermarked signals, as well as the degree of tampering.
In addition to the tampered location and the tampering degree, we could roughly predict the tampering type by analyzing the destroyed area of the extracted image. According to our embedding rule, a singular spectrum is unchanged when the embedding watermark bit was 0. Therefore, if the destroyed area is dark, such as those in Figs 7 (p) and 7 (u), it is likely that such an area would be extracted from an un-watermarked segment. That is because a singular spectrum is typically convex, and singular values between  $\sqrt{\lambda_{p}}$ and $\sqrt{\lambda_{q}}$ are therefore under the straight line that connects $\sqrt {\lambda _{p}}$ and $\sqrt {\lambda _{q}}$. Hence the extracted bit is 0, i.e. the black pixel.
As mentioned in Section III-A, removing high-frequency components from a signal can result in reducing the values of its high-order singular values. Therefore, removing high-frequency components increases the chance of obtaining 0 as the extracted watermark bit. Consequently, the damaged area of the extracted image got darker, as evidenced in Figs 7 (l) and 7 (g), when the pitches of the middle speech segments were decreased by 10 and 20%, respectively. In contrast, adding high-frequency components can cause high-order singular values to increase in value.
In the second experiment, we simulated attacks by using STRAIGHT [Reference Kawahara and Morise1]. For example, we can use STRAIGHT to modify the sentence “No, I did not” to“Yes, I did” by replacing “No” with “Yes” and the removing “not” from the sentence. The steps of the simulation are as follows. First, a watermark, which is a 166 × 23 bitmap image of the word “STRAIGHT,” was embedded into a host signal that was 96 slong. An extracted image with no attack on the watermarked signal is shown in Fig. 8 (a). Second, the watermarked signal was read by STRAIGHT to get specific features, which were the fundamental frequency (F0), aperiodic information, and an F0 adaptively smoothed spectrogram. Third, these specific features were used to synthesize another speech signal, and the synthesized speech signal replaced the watermarked signal on the second half. A replaced part can change important information in the host signal and mislead the listeners. Fourth, the signal obtained from the previous step was inputted into the extraction process to get the watermark. The extracted watermark is shown in Fig. 8 (b). It can be seen that the extracted watermark of the replaced segment was destroyed. Similar to the results from the first experiment, our scheme could be used to identify a tampered segment in a speech signal. Note that replacing some part of a speech signal with a synthesized signal is different from replacing it with an un-watermarked signal since the synthesized signal has distortion. For example, in this experiment, the SDR of the synthesized speech signal was − 27.81 dB, which is quite low. Therefore, a synthesized signal can be roughly considered as a noisy speech signal. Hence, the destroyed area in Fig. 8 (b) looks similar to that shown in Fig. 7 (s).

Fig. 8. Comparison of extracted watermark-image: (a) no tampering and (b) second half of speech signal replaced by synthesized speech signal.
D) Computational time
The computational time of DE-based parameter estimation is considerably high because the DE optimizer has to simulate the embedding process, the extraction process, and many attacks. As a consequence, it performs SVD many times for each input segment, and SVD is time-consuming. Also, the search space of DE is large. The computational time is reduced considerably when CNN-based parameter estimation replaces DE-based estimation in the watermarking scheme. A 10-fold cross-validation was conducted to ensure model stability. All of the simulations were conducted on a personal computer with Windows 10 (Home Edition). The CPU was an Intel® Core™ i5 with a clock speed of 2.3 GHz and a memory size of 8 GB with a speed of 2,133 MHz. A comparison of computational times is shown in Table 3. It can be seen that the CNN-based method was approximately 2 million times faster.
Table 3. Comparison of computational times for determining parameters of host signal when automatic parameterization is based on differential evolution and when it is based on CNN.

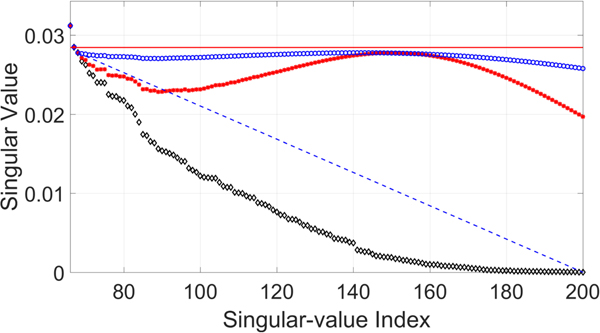
Although the CNN-based parameter estimation can successfully reduce the computational time, we have to trade the accuracy of the parameter estimation for it. A comparison of parameters obtained from the DE-based method and those obtained from the CNN-based method are shown in Fig. 9. The root-mean-square error (RMSE) of the estimated parameter γ was 0.0022, the RMSE of the estimated parameter μ was 32.1956, and the average RMSE of estimated parameter σ was 40.2616. The RMSE values of the parameters μ and σ may be quite large. However, the robustness and inaudibility of the scheme when both methods were used to determine the parameters were comparable, as shown in Table 4. An example of a singular spectrum of a frame that is embedded with parameters obtained with the DE-based method and those obtained with the CNN-based method is shown in Fig. 10. In this example, the error (or difference) between the two parameter vectors  $[\mu _{{\rm {DE}}}\ \sigma _{{\rm {DE}}}]^{\rm T}$ and $[\mu _{{\rm {CNN}}}\ \sigma _{{\rm {CNN}}}]^{\rm T}$ was $\sqrt {(\mu _{{\rm {DE}}} - \mu _{{\rm {CNN}}})^2 + (\sigma _{{\rm {DE}}} - \sigma _{{\rm {CNN}}})^2} = 90.56$, which is quite large compared with the RMSE. However, the modified singular spectra do not look much different.
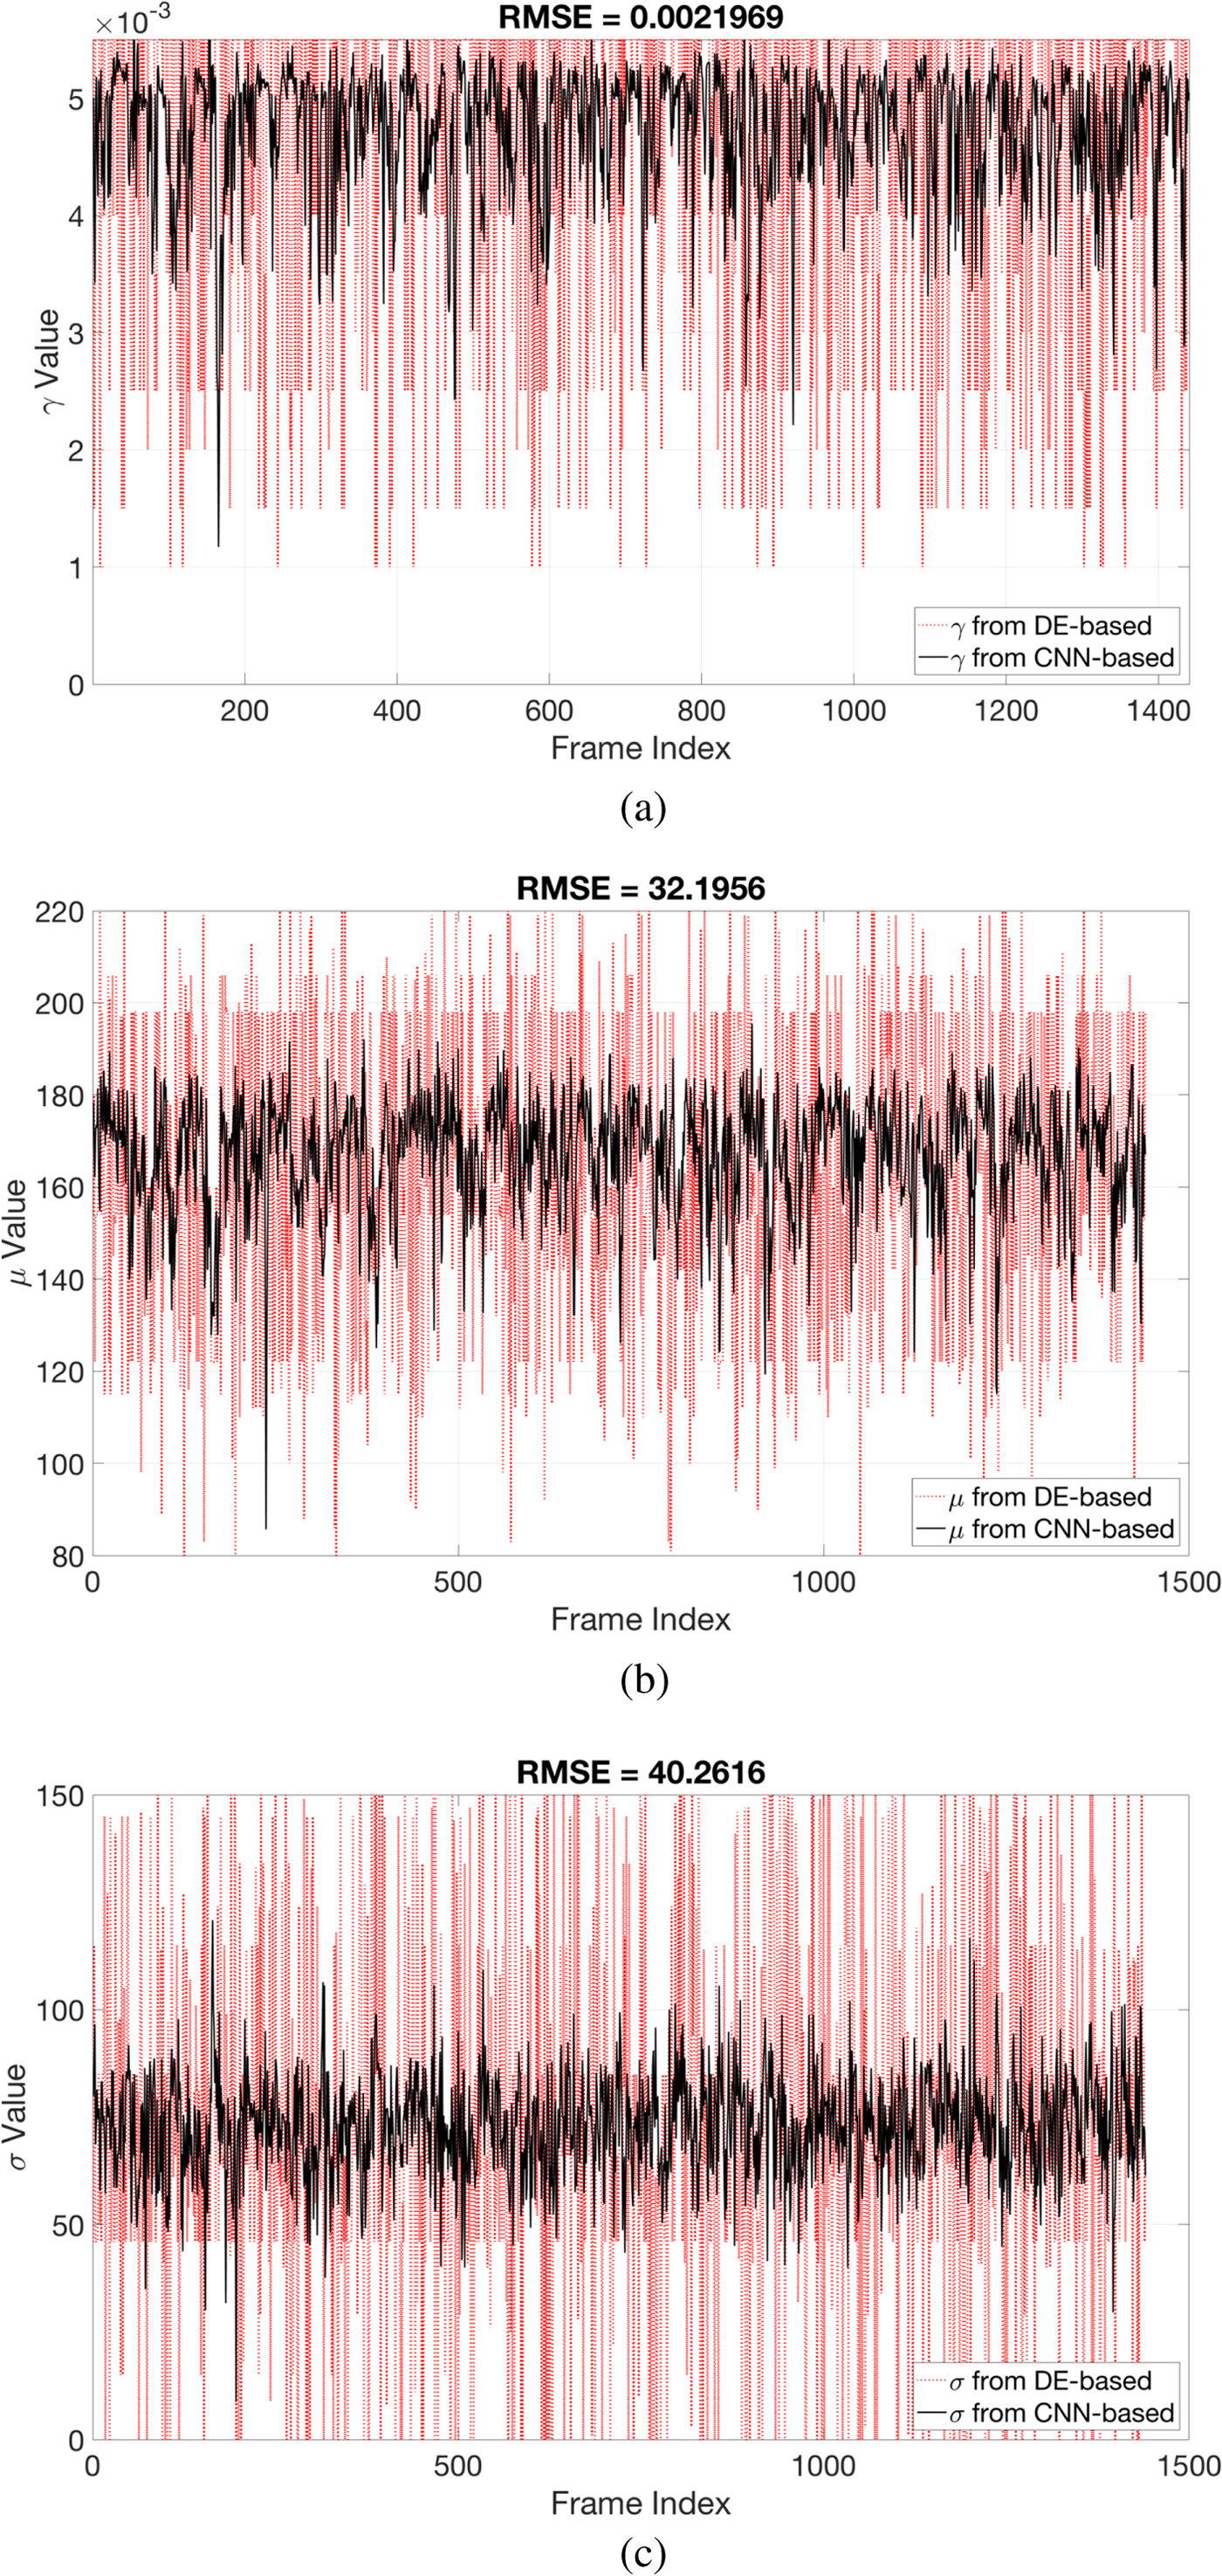
Fig. 9. RMSE of γ, μ, and σ from DE-based parameter estimation and CNN-based parameter estimation.
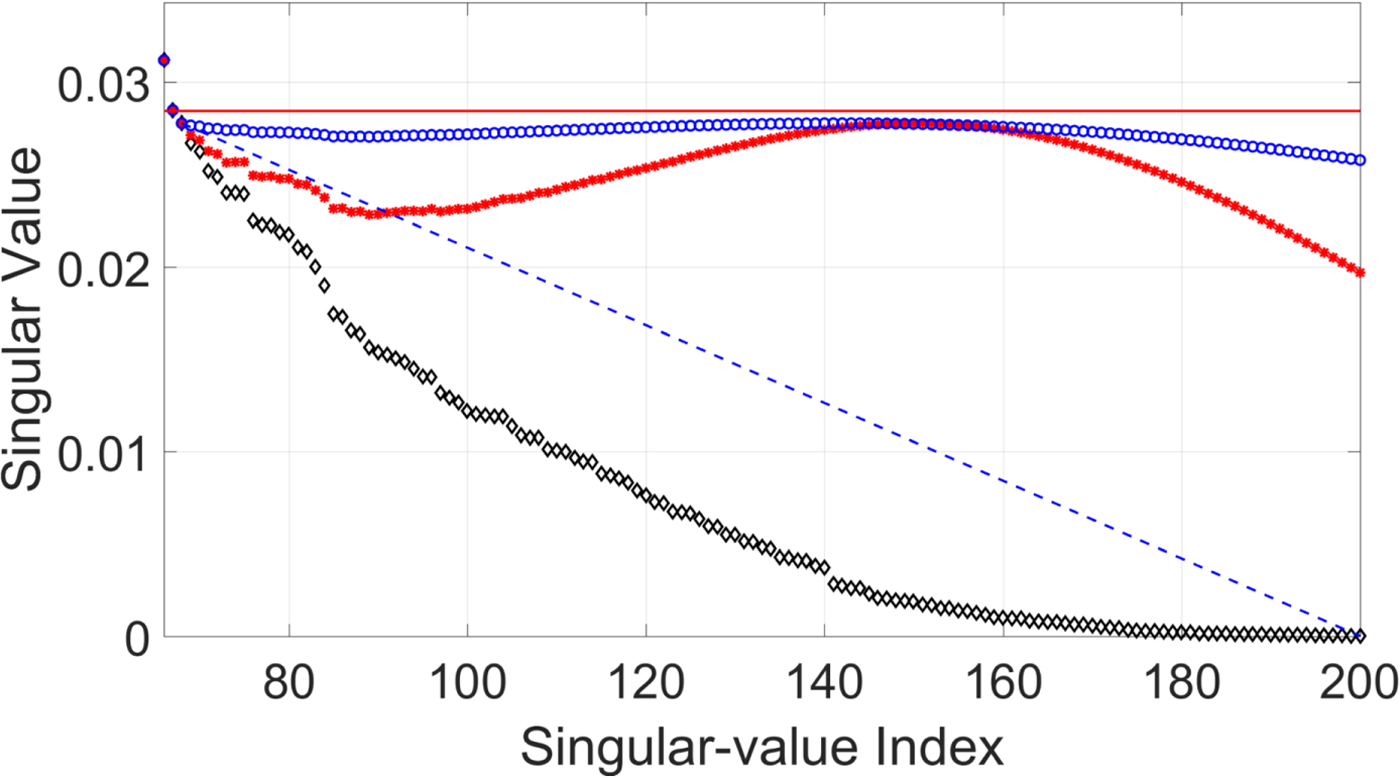
Fig. 10. Example of singular spectrum of embedded frame. “◇” denotes original singular spectrum, “*” denotes modified singular spectrum where parameters are obtained from CNN-based method, and “°” denotes singular spectrum where parameters are obtained from DE-based method.
Table 4. Comparison of robustness and inaudibility of scheme when automatic parameterization is based on differential evolution and when it is based on CNN.

V. DISCUSSION
We succeeded in reducing the computational time of parameter estimation. However, the effectiveness of the CNN-based method cannot go beyond that of the DE-based method since DE is used as the basis of the framework that we use to generate the training dataset. The performance of the CNN-based method is typically poorer than the DE-based method because there is an error in the learning (or fitting) process during the building of the CNN in most cases. As described in Section III, a crucial factor that is responsible for the effectiveness of the DE algorithm is the cost function. In this work, the cost function together with some DE hyperparameters, such as the upper bounds and the lower bounds of the parameters, plays the most important role in balancing between robustness and inaudibility. In this section, we discuss this role of the cost function.
Defining a good cost function is not trivial, and it is presumably impossible to explore all possible cost functions. In this work, we started from the assumption that the cost function should include two terms: one representing robustness, and the other representing the inaudibility. We used eight different settings, as shown in Table 5.
Table 5. Eight cost functions studied in our investigation.

Evaluations of the robustness and inaudibility when these cost functions were used in the DE optimizer are shown in Table 6. Note that we evaluated these functions by using only 40 frames due to the expensive computational cost of DE.
Table 6. Evaluations of robustness and inaudibility when different cost functions were deployed.

Cost functions C 1 and C 2 look similar. Both take the LSD into account and equally weight the terms representing inaudibility and robustness equally. Also, they assign the same weight βi for the same BER conditions. The only difference is the upper bound of γ, i.e. the search space of γ of C 2 is smaller than that of C 1. We found that their average BERs were comparable, but C 1 yielded a better sound quality. Therefore, we can safely infer that we can use the possible range of γ to control the sound quality of a watermarked signal.
Let us consider C 2 and C 3. For this pair of cost functions, we wanted to investigate the outcome when we adjusted the weights between the robustness term ( $\overline {{\rm BER}}$) and the inaudibility term (LSD). In C 3, we weighted the robustness three times greater than the inaudibility. We expected that DE with C 3 would favor robustness much more than inaudibility. However, the results showed that the average BER of C 3 was about 25% less than that of C 2, whereas the LSD of C 3 was about 50% greater than that of C 2.
Similarly, when we considered the outcomes of C 2, C 3, and C 4 together, we found that controlling the balance between robustness and inaudibility by adjusting the weight between the LSD and the  $\overline {{\rm BER}}$ was not effective, as evidenced in Table 6. Thus, we tried another strategy, i.e. we used the size of the search space of γ to control the sound quality.
Let us consider the outcomes of C 5, C 6, and C 7 in comparison with C 2, C 3, and C 4. It can be seen that, when we set the upper bound of γ appropriately, we could gain an improvement in sound quality while the BER level was maintained.
Finding an efficient cost function is not the primary focus of this work, but it is of importance due to that fact that it will help us to generate a better training dataset for the CNNs. Also, adding more signal processing operations into the DE optimizer could provide the training dataset with high robustness. We will tackle this problem in the future.
VI. CONCLUSION
In this paper, we proposed an improved version of a speech-watermarking scheme for detecting tampering. The scheme is based on our previous SSA-based watermarking method. A watermark was embedded into a host speech signal by modifying a part of its singular values. Since the modification affects the sound quality and robustness of the scheme, the part of singular spectrum to be modified must be carefully selected. Previously, we deployed a DE algorithm to find the appropriate part for modification, but it was time-consuming. Therefore, CNN-based parameter estimation is proposed to replace DE, and DE was used as the basis of a framework for generating a dataset for CNN training. The experimental results showed that the scheme could correctly detect tampering as well as locate tampered areas, and it could also roughly predict the types and degrees of tampering. CNN-based parameter estimation could reduce the computational time by approximately 2 million times and also improve the sound quality of a watermarked signal. Moreover, the scheme is blind because the estimation can be used to find the parameters in both the embedding and extraction processes.
FINANCIAL SUPPORT
This work was supported under a grant from the SIIT-JAIST-NSTDA Dual Doctoral Degree Program, a Grant-in-Aid for Scientific Research (B) (No.17H01761), and the I-O DATA foundation.
STATEMENT OF INTEREST
“None.”
Kasorn Galajit received her B.Eng. in the field of Telecommunication Engineering from King Mongkut's Institute of Technology Ladkrabang, Thailand, and M.Eng. in the field of Microelectronics from the Asian Institute of Technology, Thailand. She joined the SIIT-JAIST-NSTDA dual doctoral degree program in 2017. Her research interests focus on robust audio/speech-watermarking technique based on human auditory perception and data-driven signal representation. She has worked as a research assistant at the National Science and Technology Development Agency Thailand, since 1999.
Jessada Karnjana is currently a researcher in National Electronics and Computer Technology Center (NECTEC), Thailand. He received his bachelor's degree in Electronics Engineering from King Mongkut's Institute of Technology Ladkrabang and his Master's degree in Microelectronics from the Asian Institute of Technology (AIT), Thailand, in 1999 and 2002, respectively. He received his Ph.D. in Information Science from the Japan Advanced Institute of Science and Technology (JAIST), Japan, and Ph.D. in Engineering and Technology from the Sirindhorn International Institute of Technology (SIIT), Thammasat University, Thailand, in 2016 and 2017, respectively. His research interests are audio/speech information hiding, psychoacoustic model, evolution computation, reasoning with uncertainty, signal processing, and wireless sensor networks.
Masashi Unoki received his M.S. and Ph.D. in Information Science from the Japan Advanced Institute of Science and Technology (JAIST) in 1996 and 1999, respectively. His main research interests are in auditory motivated signal processing and the modeling of auditory systems. He has been on the Faculty of the School of Information Science at JAIST since 2001 and is now a professor. He is a member of the Research Institute of Signal Processing (RISP), the Institute of Electronics, Information, and Communication Engineers (IEICE) of Japan, and the Acoustical Society of America (ASA). He is also a member of the Acoustical Society of Japan (ASJ), and the International Speech Communication Association (ISCA). Dr. Unoki received the Sato Prize from the ASJ in 1999, 2010, and 2013 for an outstanding paper and the Yamashita Taro “Young Researcher” Prize from the Yamashita Taro Research Foundation in 2005.
Pakinee Aimmanee obtained her B.S. in Mathematics from the University of Delaware, USA, and M.S. and Ph.D. in Applied Mathematics from the University of Colorado at Boulder, USA. Her research interests are mathematical modeling, information retrieval, medical image processing, and acoustic processing. She has worked as a lecturer and researcher at the Sirindhorn International Institute of Technology, Thammasat University, since 2005 and is currently an associate professor. She was awarded a Very Good Research Award in 2008 and a Large Project Award in 2014 from Thammasat University, the Best Journal Paper Award from the Institute of Electronics Information and Communication Engineering (IEICE) in 2016, and a silver medal in the 46th International Invention Exhibition in Geneva in 2018. She received Research Honorary through Outside Organization Award from Thammasart University in 2017 and 2018.


 Open access