


Introduction
The equilibrium line of a glacier is an important indicator of climate conditions. Reconstruction of equilibrium-line altitude (ELAs) using geomorphologic methods is an important part of paleoclimate reconstruction. With the development in recent years of geomorphologic evolution theory and GIS spatial analysis methods, geomorphologic analysis based on digital elevation models (DEMs) provides a brand new approach to the study of Earth surface processes and also a new approach to studying the glacial equilibrium line (Reference Benn and LehmkuhlBenn and Lehmkuhl, 2000; Reference Benn, Owen, Osmaston, Seltzer, Porter and MarkBenn and others, 2005; Reference Owen and BennOwen and Benn, 2005; Reference Deng, Xie and LiDeng and others, 2006).
In research of glacial landforms, the area and ELA are important in paleoclimate reconstruction. High-resolution DEM and satellite images are useful in the identification of glacial landforms, and the development of GIS software facilitates the extraction of geomorphological information (Reference Liu, Wang, Zhang, Cheng, Sun and LeiLiu and others, 2005; Reference Deng, Xie and LiDeng and others, 2006; Reference Hong, Shen, Jing and DuHong and others, 2007; Reference Zhang, Fang, Zhao and ZengZhang and others, 2010) such as the area of glaciation and the ELA.
Based on earlier work and DEM data, in this paper we re-extract, integrate and analyze the data relating to the glacial extent and the ELAs in the Tianger area of the Tien Shan using GIS software. Fieldwork and previous studies show that there were two distinct glacier advances during the last glacial. The earlier advance appears in marine isotope stage 3 (MIS3) and MIS4, while the later advance appears in MIS2. The glacial extent of the earlier advance is larger than that of the later advance. The paleoclimate information contained in this phenomenon calls for further study.
Study Area
The study area is located in the central Tien Shan (42.5-43.5° N, 86.25-87.830 E), Xingjiang, western China (Fig. 1). Tianger peak is the highest peak in the study area, with an altitude of 4486ma.s.l. The mountain ridges in this area range from 4100 to 4300 m a.s.l. Modern glaciers develop in this area and the major types are cirque glaciers, hanging glaciers and small valley glaciers. The modern ELA is ~4000–4100 m a.s.l. (Reference Li, Han, Jing, Yang and JiaoLi and others, 2003, Reference Li2007; Reference Yang, Li, Ye, Jiao and ZhaoYang and others, 2005).

Fig. 1. Geomorphological map of the study area.
Glacial landforms left behind by ancient glaciers are abundant and provide ideal materials for study. The study of ancient glacial remains is an important part of reconstructing the Quaternary environment (Reference HuangHuang, 1944; Reference DingDing, 1947a, Reference Dingb; Reference Zheng and WangZheng and Wang, 1983; Reference Zheng and ZhangZheng and Zhang, 1983; Reference Cui, Xiong, Liu, Zhu and YiCui and others, 1998; Reference Zhou, Jiao, Zhao, Zhang, Cui and XuZhou and others, 2002; Reference Shi, Cui and SuShi and others, 2006). The abundant ancient glacial landforms and sedimentary phenomena in the Tien Shan area have attracted the attention of numerous researchers.
Recently, glacial geomorphological and Quaternary environmental studies have developed rapidly in two directions. One is the development of chronological techniques, such as optically stimulated luminescence (OSL), terrestrial cosmogenic nuclide (TCN), 14C accelerator mass spectrometry (14C-AMS) and electron spin resonance (ESR) (Reference Yi, Liu and CuiYi and others, 1998, Reference Yi, Jiao, Liu, Li and Ye2001, Reference Yi, Liu, Cui, Jiao, Yao and He2004; Reference Zhao, Zhou, Cui, Jiao, Ye and XuZhao and others, 2002, Reference Zhao, Zhou, He, Ye and Liu2006, Reference Zhao, Wang and Shangguan2009; Reference OwenOwen and others, 2005; Reference Kong, Fink, Na and HuangKong and others, 2009; Reference Li, Liu, Kong, Harbor, Chen and CaffeeLi and others, 2011). The chronological study in the headwater of Ürümqi river is among the most thorough and detailed works (Table 1). The other is the application of DEM data and GIS software. The former make it possible to establish a reliable and high-resolution chronological sequence of glaciation and the latter provides the opportunity to quantitatively and numerically extract information on paleoenvironment reconstruction from glacial landforms and sediments (Reference Hock and JensenHock and Jensen, 1999; Reference Benn and LehmkuhlBenn and Lehmkuhl, 2000; Reference Wu, Liu, Zhang, Ma, Wei and TianWu and others, 2001; Reference Deng, Xie and LiDeng and others, 2006).
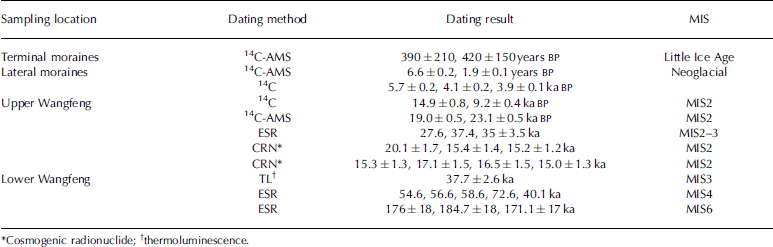
Table 1. Datings and glaciations in the headwater of Ürümqi river (after Reference Yi, Liu and CuiYi and others, 1998, Reference Yi, Jiao, Liu, Li and Ye2001, Reference Yi, Liu, Cui, Jiao, Yao and He2004; Reference Zhao, Zhou, He, Ye and LiuZhao and others, 2006; Reference Kong, Fink, Na and HuangKong and others, 2009; Reference Li, Liu, Kong, Harbor, Chen and CaffeeLi and others, 2011)
Method
The data source is the distribution map of glaciers of the last glacial in the Tianger area, Tien Shan, compiled by the Tianshan Glaciological Station, Chinese Academy of Sciences (Reference Yang, Ren, Li and GuYang and others, 1993). This map is based on a 1:50 000 topographic map, and the glacial extents and landforms are acquired through aerial photographs (taken in 1964) and field surveys. The map shows the extents of modern glaciers and ancient glaciers during the last glacial and the position and altitude of ancient equilibrium lines, mountain divides, rivers and lakes in the area 42.5–43.5° N, 86.25–87.83° E. The scale of the map is 1:200 000.
The map is digitized and matched with the DEM map using ArcGIS software and then the information contained in the source map is transcribed into the DEM map. Subsequently, the following data are extracted: elevation, slope, aspect, distribution range of modern glaciers (before 1964), distribution range of glaciers during the last glacial, ridgeline, ELA, glacier terminus altitude and other data on the Tianger area. Combining the interpretation of the aerial photographs and satellite images and fieldwork in parts of the area, corrections are made to decrease the errors. The DEM map of the study area is then drawn. Macroscopic geomorphologic features and distributive patterns of glaciers during the last glacial in the Tianger area are acquired after analysis of the DEM map using ArcGIS software. With application of methods of calculating the ELAs of ancient glaciers, the distributive patterns and the characteristic ratios relating to the ELAs of this area are discussed. The DEM data are from the Advanced Spaceborne Thermal Emission and Reflection Radiometer (ASTER) global DEM (GDEM) (30m resolution), and the World Geodetic System 1984 ellipsoidal elevation (WGS84) coordinate system is adopted.
The accumulation area, ablation area and headwall altitude of selected glaciers are calculated using GIS software. Consulting the known data of equilibrium-line and glacier terminus altitudes, the accumulation–area ratio (AAR), toe–headwall altitude ratio (THAR), terminus–summit altitude method (TSAM) and Höfer method are employed to analyze the characteristics of the glacial equilibrium line.
The availability of initial data for estimating ancient ELAs varies in different areas. In a specific area, the available initial data can be used in some methods, but other methods may be invalid due to the lack of key inputs. Therefore, comparison between different methods is important, especially in areas with better availability of initial data, i.e. where more complete inputs can be acquired. The correlations between different ratios relating to ELA acquired through different methods demonstrate which methods can be substituted. Better correlation means the corresponding methods are interchangeable. This result can be applied to other areas with similar geomorphological features.
Results
Analyses of the distributive patterns during the last glacial in the Tianger area
Geomorphologic analyses based on DEM
According to the base map (1964), the total area of modern glaciers in the study area is 325.03 km2 and that of glaciers during the last glacial is 3614.03 km2. The latter area is 11.12 times the former.
Analyses of the ELA characteristics of typical drainage basins during the last glacial
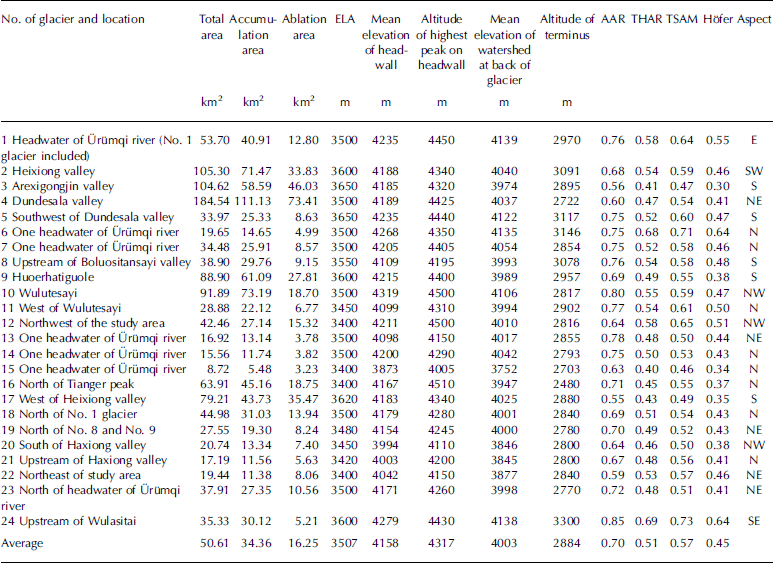
The glacial valleys in the study area are divided according to drainage basins, and 24 typical glacial valleys are chosen from which to extract geomorphologic factors (Fig. 2; Table 2). In these selected drainage basins, 16 are on the north slope of Tianger peak, six on the south slope, one on the north slope of Alagou valley and one on the south slope. The total area of the 24 glaciers is 1214.73 km2 and accounts for 33.61% of the total glaciated area during the last glacial. The total accumulation area is 824.62 km2 and the total ablation area is 390.12 km2. The ELAs during the last glacial are in the range 3400–3650m, and the mean altitude is 3507 m.

Fig. 2. Schematic diagram of the serial numbers of selected glaciers during the last glacial.
Table 2. Distributive characteristics of the 24 selected glaciers of the last glacial in the study area
Correlation analyses
Pearson’s simple correlation coefficient is employed to analyze the characteristic ratios of the equilibrium line of 24 glaciers. The correlation values between the AAR and the THAR, TSAM and Höfer method are 0.625, 0.571 and 0.666, respectively, which indicate medium correlation, and the correlation value between the AAR and Höfer is the highest. As the Höfer method adopts the mean height of the watershed at the back of a glacier for calculation, the value of which is distributed in a large area and susceptible to the size of the glacier, partial correlation analysis is applied to the Höfer method. The result shows that the correlation between the Höfer value and the AAR decreases slightly to 0.637 after removing the influence of glacier area. This indicates that glacier area interferes with the Höfer method and the AAR but the effect is weak. There is a relatively strong correlation between the Höfer value and the AAR.
Comparison between the north and south slopes
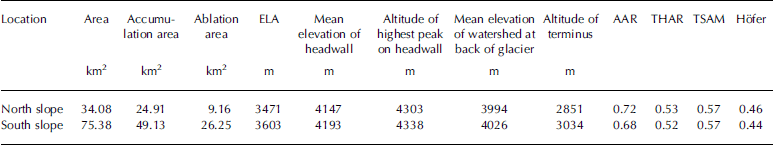
Aspect strongly influences the water and heat conditions under which the glaciers develop. Twenty-two glaciers around Tianger peak were chosen to be compared, of which 16 are on the north slope and six are on the south slope (Fig. 2; Table 3). The total area of glaciers on the north slope is 579.29 km2 and on the south slope is 452.26 km2, which makes them comparable. The ELA of glaciers on the south slope is 132 m higher than that on the north slope. The averages of mean altitude of the highest points on the headwall, altitude of the highest peak and mean altitude of the watershed at the back of the cirque are all higher on the north slope; the differentials are 46, 35 and 32 m, respectively. The characteristic ratios calculated using four geomorphologic methods are slightly higher on the north slope, with a maximum differential of 0.04 (Table 3). Correlation analyses are applied to the four characteristic ratios, and the correlation value is 0.991 which indicates a strong correlation.
Table 3. Characteristics of glaciers of the last glacial on the north and south slopes of Tianger peak
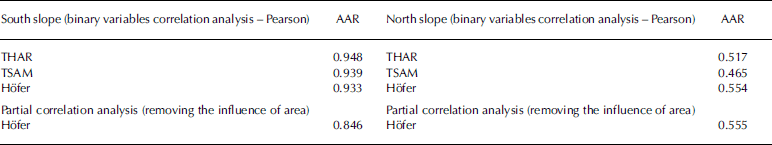
Correlation analyses are applied to the characteristic ratios of the north and south slopes, respectively (Table 4). The correlations between the AAR and the THAR, TSAM and Höfer value are very strong on the south slope, with correlation coefficients of >9.3. Partial correlation analysis is applied to the Höfer method to remove the influence of glacier area, and the correlation coefficient decreases to 0.846, which still indicates a strong correlation. The correlations on the north slope are weaker than those on the south slope, with correlation coefficients ranging from 0.46 to 0.55, which indicates medium to low correlations.
Table 4. Correlation analysis of the ELA characteristics of the last glacial on the north and south slopes of Tianger peak
Comparison between large and small glaciers
The 24 glaciers are divided into two groups by the median of area to discuss whether the glacier area influences the characteristics of the equilibrium line (Table 5). The median area of the 24 glaciers is 36.62 km2. Glaciers with an area >36.62km2 are classed as group A, while those <36.62 km2 are classed as group B. The averages of the main features of the glaciers are shown in Table 5.
Table 5. Characteristics of glaciers of two groups divided according to the median of area
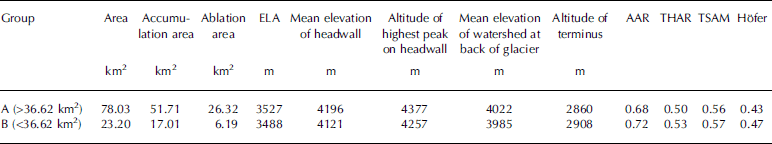
The average area of glaciers in group A is 3.36 times larger than that of group B, and the four equilibrium-line characteristics of glaciers in group A are all slightly lower than those of group B. Correlation analyses are applied to the four characteristics of groups A and B, and the correlation is 0.991 which indicates a very strong correlation. In the two groups of glaciers divided by the median of area, the four equilibrium-line characteristics are correlated strongly and positively with area.
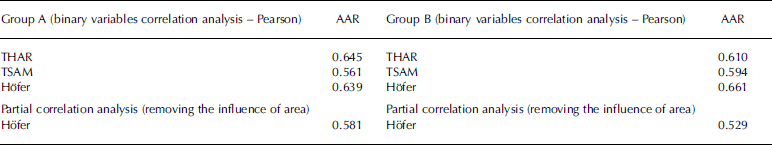
The correlation analysis results of the equilibrium characteristics of the two groups of glaciers are shown in Table 6. The correlations of the characteristics of the two groups of glaciers are both median. Partial correlation analysis is applied to the Höfer method to remove the influence of glacier area, and the correlation coefficients between the AAR and the Hofer value in the two groups both decrease. That of group A decreases by 0.058, while that of group B decreases by 0.132. The decrease in the correlation coefficient of group B is more than that of group A, which indicates the correlation between the AAR and the Hofer value is more susceptible to glacier area in smaller glaciers.
Table 6. Correlation analysis of the ELA characteristics of two groups divided according to the median of area
Analyses of the distributive features of glaciers in typical areas during the last glacial
Headwater of Ürümqi river
The geomorphologic map of the headwater of Ürümqi river is shown in Figure 3. According to earlier work, the glaciations in the headwater of Ürümqi river are divided into Little Ice Age, neoglacial, late stage of last glacial (upper Wangfeng till) and early/middle stage of last glacial (lower Wangfeng till), as shown in Figure 3. The distribution of glaciers in this map basically coincides with the result of earlier work.

Fig. 3. Geomorphological map of the source area of Ürümqi river.
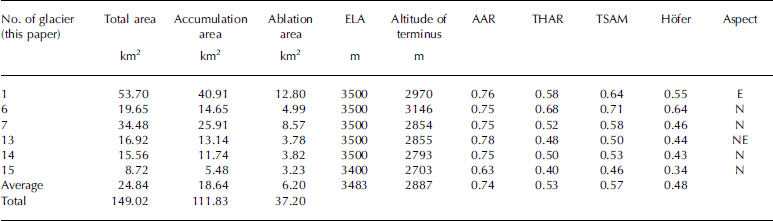
Six glacier samples are chosen in the headwater of Ürümqi river (Table 7), with a total area of 149.02 km2. The dominant aspects are east and north and the ELAs range from 3400 to 3500 m, with an average of 3483 m. The AARs range from 0.63 to 0.78, with an average of 0.74. The THARs range from 0.48 to 0.68, with an average of 0.53. The TSAMs range from 0.46 to 0.71, with an average of 0.57. The Hofer values range from 0.34 to 0.64, with an average of 0.48.
Table 7. Distributive characteristics of the selected glaciers of the last glacial in the source area of Ürümqi river
Correlation analyses are applied to the characteristic ratios of the equilibrium lines of the six glaciers in the headwater. The correlations between the AAR and the THAR, TSAM and Höfer value are 0.562, 0.474 and 0.573, respectively, which all indicate medium to low correlation. The correlation coefficient decreases to 0.460 after removing the effect of area. The decrease range of 0.113 indicates that area has a relatively strong influence over the correlation between these two ratios in the headwater.
Headwater of Alagou valley
According to the fieldwork, the termini of glaciers reached an altitude of 2800 m when they advanced to their maximum range in the Alagou valley. The locations of tills of the Little Ice Age, neoglacial, late stage of the last glacial and early/middle stage of the last glacial are inferred. The distribution map of ancient glaciers since the last glacial in the Alagou valley is acquired (Fig. 4) after consulting the data in Figure 1 and the DEM.

Fig. 4. Distribution map of ancient glaciers of the last glacial in Alagou valley.
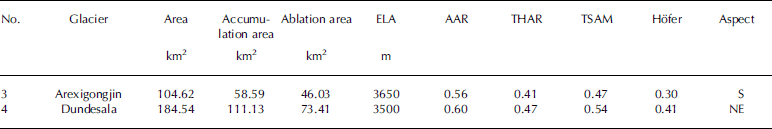
Arexigongjin and Dundesala glaciers in the headwater of the Alagou valley are chosen for analysis (Table 8). Arexigongjin glacier is located on the south slope of Tianger peak, with an ELA of 3650 m, which is 150m higher than that of Dundesala glacier on the north slope of Alagou peak. The AARs of the two glaciers are 0.56 and 0.60, which is relatively low considering the average of the whole study area. The other three characteristic ratios are also relatively low.
Table 8. Distributive characteristics of the selected glaciers of the last glacial in Alagou valley
Following comparison of two typical regions in the study area, it is found that the four equilibrium-line characteristic ratios of glaciers on the south slope are all lower than those on the north slope and this coincides with the general feature of the influence of aspect over glacial equilibrium line, as mentioned above.
Discussion
Spatial variation of ELA ratios
In the glaciated area during the last glacial in the study area, the AARs of glaciers on the south slope are lower and are much better correlated with the THAR, TSAM and Höfer value than those on the north slope. In the comparison of two groups of glaciers divided by median area, the correlations between the AAR and Höfer value of smaller glaciers are more susceptible to area than those of larger glaciers. Therefore, the AARs of glaciers with a gentler slope and larger area are lower and are better correlated with the THAR, TSAM and Höfer value. In the Tianger area, the south slope has more matching conditions as mentioned above, while in the Alagou area the north slope is gentler than the south slope. The No. 4 glacier representing the north slope is larger than the No. 5 glacier representing the south slope, and the AAR of the former is lower. Meanwhile, No. 3 and No. 4 glaciers representing the Alagou area are both larger, with gentler slope, and their AARs are notably lower than the average of the whole study area. Compared with those of the headwater of Ürümqi river, the slopes of this area are gentler.
Climatic implications of the variation of glacial equilibrium-line characteristic ratios in the headwater of Urümqi river
According to the observation data from 1959 to 2002, the average ELA of No. 1 glacier is 4053 m (Reference Li, Han, Jing, Yang and JiaoLi and others, 2003; Reference Yang, Li, Ye, Jiao and ZhaoYang and others, 2005).
Reference ZhangZhang (1981) calculated that the ELA during the upper Wangfeng glacial was 3630 m using an AAR of 0.6. Reference Xu, Wang and YangXu and others (2010) calculated the ancient ELA during the LGM in the headwater and found ELAs of 3615 and 3675 m using AARs of 0.55-0.65.
The distributive range of the No. 1 sample glacier in this paper covers the modern No. 1-No. 9 glaciers in the headwater area, which is the area that has been studied most thoroughly in terms of Quaternary glaciers. Its area is 53.70 km2 and the ELA is ~3500 m, which is 553 m lower than the modern ELA. The AAR is 0.76, which is higher than the value of 0.55 or 0.65 adopted by Reference Xu, Wang and YangXu and others (2010) for the calculation of ancient ELA during the LGM. The AAR is directly proportional to the accumulation area: the larger the accumulation area, the higher the AAR value. Meanwhile, it can be found from the sequence of tills in the headwater that the distributive range of glaciers during the last glacial reaches its maximum in the early/middle stage rather than in the LGM, i.e. in the late stage of the last glacial. The data adopted in this paper are of the maximum range during the last glacial, i.e. the distributive range of glaciers during the early/middle stage of the last glacial. Therefore, through comparison of these two values mentioned above, it can be inferred that the AARs are higher and the accumulation areas are larger in the early/middle stage of the last glacial than in the LGM.
Higher AARs indicate continental characteristics of glaciers. Reference Shi, Cui and SuShi and others (2006) proposed that MIS4, or the early stage of the last glacial, was a dry and cold period in western China, which was slightly warmer and more humid than the LGM in MIS2. Consulting different data, researchers come to different conclusions when calculating the difference in temperature between the LGM and modern time at different locations on the Qinghai-Tibetan Plateau, and the average is ~7°C. Reference Xu, Wang and YangXu and others (2010) proposed that, in the headwater of Ürümqi river, the temperature from June to August was 5.42-6.30°C lower during the LGM than it is today and that the precipitation was only 30% of the modern value. Compared with maritime glaciers, continental glaciers often show drier and colder features, i.e. lower temperature and less precipitation. The average AAR of glaciers in the early/middle stage of the last glacial is 0.76, and that in the LGM ranges from 0.55 to 0.65. The former is more continental. The modern alpine glaciers can be classified into three climatic categories: extreme continental, subcontinental and maritime. The modern glaciers in the headwater of Urumqi river are in the subcontinental category. However, they may be in the extreme continental category in the early/middle stage of the last glacial.
The formation and evolution of the Himalaya and the Qinghai–Tibetan Plateau influence atmospheric circulation and climate change in Asia, or even the globe. This region has always been a focus of research. Reference OwenOwen and others (2005) reviewed 2 1 glaciers in the Himalaya and Qinghai–Tibetan Plateau, and the results show that the ancient ELAs during the LGM range from 3000 to 5920 m in this region, while the modern ELAs range from 3750 to 6200 m. The ELAs in different locations within this region differ considerably because there are two climate systems influencing the development of glaciers in this region, namely the westerlies in the mid-latitude and the south Asian summer monsoon, and the topographic factor also plays an important role. In studies of ancient ELAs during the LGM in this region, most researchers choose AAR and THAR for comparison and the AAR value is always chosen around 0.6, while the THAR value is always chosen in the range 0.4–0.5. Reference LiuLiu and others (2011) proposed that an AAR of 0.35 is more suitable for the distribution of glaciers during the last glacial in the study of glaciers on Peiku Gangri, northwest of Shisha Pangma peak. This value is much lower than the AAR of 0.53 corresponding to the modern ELA, and the probable causes are the effects of aspect and topography, which make the accumulation area smaller than other alpine glaciers in mid-latitudes.
The comparison in this paper between the equilibrium-line characteristic ratios during the LGM on the Himalaya and Qinghai–Tibetan Plateau and those during the early/ middle stage of the last glacial in the Tianger area shows that the average AAR of the latter is 0.7, which is higher than the most frequent AAR of 0.6 of the former, while the average THAR of the latter is 0.51, which is slightly higher than that of the former. Assuming that the two studies are comparable in terms of method, it can be inferred that glaciers during the early/middle stage of the last glacial in the Tianger area are more continental than those during the LGM on the Himalaya and Qinghai–Tibetan Plateau.
Conclusion
-
1. The ELA of glaciers during the last glacial in the headwater of Ürümqi river is ~3500 m, which is 553 m lower than the modern ELA. The AAR is 0.76, which is higher than that during the LGM. It can be inferred that the AARs are higher and the accumulation areas are larger in the early/middle stage of the last glacial than in the LGM. Compared with the modern subcontinental glaciers in this region, those in the early/middle stage of the last glacial are more like extreme continental glaciers.
-
2. In the comparison between the equilibrium-line characteristic ratios during the LGM on the Himalaya and Qinghai-Tibetan Plateau and those during the early/ middle stage of the last glacial in the Tianger area, assuming the two sets of data are comparable in terms of method, it can be inferred that glaciers during the early/ middle stage of the last glacial in the Tianger area are more continental than those during the LGM on the Himalaya and Qinghai-Tibetan Plateau.
-
3. Slope and area are related to the equilibrium-line characteristic ratios of glaciers. The AAR values of glaciers with gentler slopes and larger areas are lower and are better correlated with the THAR, TSAM and Hofer value.
Acknowledgements
This project was supported by the National Natural Science Foundation of China (grant Nos. 40971002, 41230743). We acknowledge fieldwork support provided by the Tianshan Glaciological Station, Chinese Academy of Sciences. Jon Harbor, Arjen Stroeven, Li Yingkui and Li Yanan participated in the fieldwork. We thank the anonymous reviewers and the scientific editor for constructive suggestions which improved the manuscript.


