


Over the last 30 years research explored the development of taste perception and preferences in infancy and early childhoodReference Birch1. It is recognised that human infants are born with a genetic predisposition to like sweet tastes and to reject bitter and very sour stimuliReference Desor, Maller and Andrews2–Reference Rosenstein and Oster4. However, these innate responses to basic taste stimuli are not fixed, and can be modified by repeated exposure to different foods. Studies by Beauchamp & MoranReference Beauchamp and Moran5, Reference Beauchamp and Moran6 demonstrated that infants who were fed sweetened water during the first 6 months of life showed a stronger preference for sweet solutions at 6 months and 2 years compared with children who had no such experienceReference Beauchamp and Moran5, Reference Beauchamp and Moran6.
Even though newborns reject very sour tastesReference Rosenstein and Oster4, little is known about the development of sour taste acceptance. Recent research by Liem & MennellaReference Liem and Mennella7 and Mennella & BeauchampReference Mennella and Beauchamp8 suggests that experiences with sour-tasting hydrolysed protein formula during infancy can modify the aversive reaction to sour tasteReference Liem and Mennella7, Reference Mennella and Beauchamp8. Additional work by Liem & MennellaReference Liem and Mennella9 and Liem et al. Reference Liem, Westerbeek, Wolterink, Kok and de Graaf10 revealed that at 5 to 9 years of age some children display heightened sour preferences independent of their experiences with hydrolysed formulaReference Liem and Mennella9, Reference Liem, Westerbeek, Wolterink, Kok and de Graaf10. It remains unknown how these heightened sour preferences have been acquired. The authors suggest that preferences for extreme sour stimuli were related to children's willingness to try unfamiliar foodsReference Liem and Mennella9, Reference Liem, Westerbeek, Wolterink, Kok and de Graaf10, their thrill-seeking behaviourReference Liem, Westerbeek, Wolterink, Kok and de Graaf10 and their fruit consumptionReference Liem and Mennella9, Reference Liem, Bogers, Dagnelie and de Graaf11. The last finding in particular suggests that children who accept the sour stimuli during laboratory tests would also accept sour tastes outside the testing environment. It might be that acceptance of sour taste could be related to acceptance of fruitReference Liem and Mennella9.
It is unknown whether heightened sour preferences as described by Liem & Mennella are already present in infants and toddlers. Research conducted with the very young only describes the rejection of sour stimuliReference Steiner and Weiffenbach3, Reference Rosenstein and Oster4. There is no evidence to illustrate that some infants or toddlers show an acceptance for extreme sour tastes. Therefore, the first objective of the present study was to investigate if some infants aged 15–20 months demonstrate an acceptance of extreme sour tastes. The second objective was to determine if there is a link between sour taste acceptance and infants' food intake in general and fruit intake in particular. Additionally, possible relationships between sour acceptance and sex as well as sour acceptance and behavioural factors such as fussiness, enjoyment of food or food responsiveness were examined.
Based on previous findings the authors hypothesised that some infants will accept sour tastes as demonstrated by Liem & Mennella and that these infants will have a higher fruit intake at 18 months. Due to the young age of the subjects it is also hypothesised that other factors such as sex or eating behaviour have no influence on infants' sour acceptance.
Materials and methods
Subjects
Data were collected as part of a 20-month longitudinal study on the development of food preferences and eating habits during infancy. A sample of eighty-five mother–infant pairs enrolled for this longitudinal study. The mothers were recruited when they were in their last trimester of pregnancy from newspaper articles, presentations at antenatal classes and leaflets or posters in clinics and surgeries. The infants were born between August 2003 and February 2004. Dietary information for the infants was collected when the infants were 6, 12 and 18 months old. Of the total sample, seventy-five subjects completed the study. All seventy-five mother–infant pairs were invited to participate in the sour acceptance assessment; however, fifteen mother–infant pairs were not able to attend due to time constraints or logistical problems. At the time of the sour acceptance assessment, the infants were aged between 15 and 20 months (mean age 18·1 ± 1·5 months). Due to time restrictions the sour acceptance test had to be conducted within a 2-month time frame. However, there was an age difference of up to 7 months between some infants, therefore a time frame for the acceptance test was selected when the mean age of the infants was 18 months. All children were reported by their mothers to be healthy at the time of the testing and not to have any allergies for any of the test stimuli. The study procedure was approved by the Clinical Research Ethics Committee of the Cork Teaching Hospital (Cork, Republic of Ireland).
Stimuli
To test the infants' acceptance for different levels of sourness, four test solutions differing in the concentration of citric acid were prepared. The solutions were made up by diluting 50 ml blackcurrant squash (Ribena; GlaxoSmithKline Nutritional Healthcare, Brentford, Middlesex, UK) in 1000 ml distilled water and either adding no citric acid (0·00 m; base solution) or different concentrations of citric acid (0·013 m, 0·029 m and 0·065 m; Sigma-Aldrich Chemie GmbH, Steinheim, Germany). It should be noted that the blackcurrant squash concentrate had a sweet taste as it contains 56 % (w/v) sugar (according to manufacturer's information). However, the concentrate also contained 0·053 m-citric acid. Citric acid concentration was determined using a standard enzyme assay (K-CITR 02/06; Megazyme International Ireland Ltd, Bray, Co. Wicklow, Republic of Ireland). This assay is based on the conversion of NADH to NAD+ with corresponding change in absorbance at 340 nm. Absorbance at 340 nm was measured using a Varian Cary 1E UV-Visible spectrophotometer (Varian Inc., Palo Alto, CA, USA). Blackcurrant squash was used to give the base solution a pleasant and slightly sweet taste in order to avoid infants' rejection of the base solution. Even though not all infants were familiar with this squash, none of the infants rejected it in the base solution. The solutions were presented to the children at room temperature and were refrigerated when not in use. New solutions were prepared every 3 d.
Sour acceptance assessment
All infants were tested individually in a room specially designed for sensory testing with infants at the Department of Food and Nutritional Sciences, University College Cork. Infants' acceptance of the different solutions was assessed by intake measures obtained during brief, sequential presentation periods, a technique that has been used previously in sensory testing with infants and toddlersReference Beauchamp and Moran6, Reference Cowart and Beauchamp12, Reference Crystal and Bernstein13. The test solutions were presented to the infants in their own preferred cup or bottle, which were provided by the mothers. Mothers were asked to bring four identical cups or bottles, so that a new container could be used for each solution. The infants were sequentially presented with 80 g 0·00 m-, 0·013 m-, 0·029 m- and 0·065 m-citric acid solutions. Each of the four taste stimuli was presented to the child for 25 s or until rejection, which ever came first. Cues that the infant rejected a solution were closing the mouth firmly, pushing the cup or bottle away or spitting the solution out. An interval of 40 s was allowed between each presentation to allow the infants to rest. After all four stimuli were presented, a 5 min rest period occurred before the infants were presented with the solutions again but in reverse order, using the same container per solutionReference Beauchamp and Moran6, Reference Cowart and Beauchamp12. The maximum amount an infant could drink of each solution was 80 g; however, none of the infants drank the maximum amount. The infants were encouraged by the mothers to taste the content of each container. If infants refused to drink they were offered little rewards in form of stickers or little toys for trying the solution. To increase infants' compliance with the testing protocol, mothers were asked to practise the testing procedure at home with solutions like water, juice or milk for 2 weeks before they came in for the assessment. Infants' total intake of each stimulus was determined by weighing each container before and after presenting it to the infant.
Acceptance scores, based on the intake of each solution, were calculated for each infant by dividing the intake of each solution by the intake of that solution plus that of the base solution, i.e. acceptance score for 0·013 m-citric acid solution = intake 0·013 m/(intake 0·013 m+ intake base solution)Reference Crystal and Bernstein13. The acceptance score for the base solution (0·00 m) was the same for all infants (0·5) and served as the control. Acceptance scores for the three citric acid solutions could either have a value greater than 0·5 (indicating a preference for this solution over the base solution) or a value smaller than 0·5 (indicating a rejection of this solution). Even though infants could drink the solutions of either a cup or a bottle, reviews of individual intakes showed that this variance introduced no difference in acceptance ratio.
Three-day dietary record
Food intake of the infants was assessed at 6, 12 and 18 months using a 3 d weighed food diary. At all three time points, infants' total food intake was measured over a period of two typical weekdays and one typical weekend day, not necessarily sequential. Mothers were given a time frame of 2 weeks during which they could complete the food diary. If mothers felt that their infant was sick or not eating well they were asked to stop recording for that day and repeat it on a new day. At each time point, during an initial home visit by the researcher, participants were carefully instructed on how to record the infant's food and drink intake and on how to use the weighing scales. Additionally, printed instructions and a sample food diary were provided to the participants to minimise errors. To quantify each food or drink consumed by the child over the recording period, each household was provided with a digital scale accurate to 1 g (KD-400; Tanita® UK Limited, Yiewsley, Middlesex UB7 7RY, UK).
Infants' eating behaviour
At the 18-months visit, mothers were asked to complete a series of questionnaires on behalf of their infants, including the five-item reaction to food scaleReference Pliner and Loewen14 and a twenty-four-item scale measuring four aspects of the child's eating behaviour: slowness in eating, enjoyment of food, fussiness and food responsivenessReference Wardle, Guthrie, Sanderson and Rapoport15. Infants' weight and head circumference were also measured at each time point.
Statistical analysis
Initially, a one-way ANOVA was carried out to test if sex had an influence on either solution intake or sour acceptance scores. Furthermore, Pearson's correlations were conducted to see if infants' weight and age were related to intake or acceptance scores.
For further analysis, subjects were divided into two groups based on their acceptance scores. Infants who had the highest acceptance score for either the 0·029 m or the 0·065 m solutions (i.e. had an acceptance score greater than 0·5 for either of these two solutions) were grouped in the high sour group, whereas infants that rejected the two highly sour solutions (i.e. had lower acceptance scores for these two solutions than for the base solution or the 0·013 m solution) were grouped in the low sour group. Infants did not need to have acceptance scores greater than 0·5 for both of the two highly sour solutions to be grouped in the high sour group, but one of these two acceptance scores had to be the highest score overall (i.e. higher than each of the other three acceptance scores). χ2 Statistics were carried out to determine differences in the sex ratio between these two sour groups. Independent sample t tests were carried out to determine whether there were differences in age, weight, head circumference or breast-feeding duration between the two groups. Intake of the four citric acid solutions was compared between the two sour groups using repeated-measures ANOVA with the solution intake as the within-subject variable and the sour group as the between-subject factor. In the same way, infants' acceptance scores for the four solutions were compared in a 4 (acceptance score) × 2 (sour group) repeated-measures ANOVA.
Food intake data were analysed using WISP customised nutritional analysis software (Tinuviel Software, Warrington, Cheshire, UK), which includes food composition data from the 6th edition of McCance and Widdowson's The Composition of Food 16 and supplemental volumes. Additional recipes and new foods provided by the mothers were added to this database. Food and nutrient intake data were exported from WISP to SPSS for Windows version 11 (SPSS Inc., Chicago, IL, USA) for subsequent analysis. For each infant, mean daily energy intake (kJ) and percentage contribution of protein, total fat and carbohydrate at 18 months were calculated. Furthermore, the percentage contribution of nine major food groups to total energy intake was calculated for each infant. Additionally, infants' mean daily intake of fruits at 6, 12 and 18 months was computed. Infants' fruit variety at 18 months was determined by counting the number of different fruits consumed over the 3 d period.
Independent-sample t tests for normally distributed data, or Mann–Whitney tests for not normally distributed data, were performed to determine if there were significant differences between the two sour groups in any of the dietary intake measures at 18 months. To test if there was a relationship between infants' sour acceptance and early exposure to fruits, mean daily fruit intakes at 6, 12 and 18 months were compared using repeated-measures ANOVA with fruit intake at 6, 12 and 18 months as the within-subject variable and the two sour groups as the between-subject factor. Differences in eating behaviour between the two sour groups were analysed using independent-sample t tests.
Results
Subjects' characteristics
Of the sixty infants who participated in the sour assessment test, seven were excluded from the analysis as they did not comply with the experimental procedure and refused to sample the different solutions. ANOVA showed that there was no effect of sex on the intake or acceptance scores of any of the four solutions. Furthermore, there were no statistically significant correlations between age in months or weight in kg and intake and acceptance scores. Therefore infants were combined across all these variables for further analysis.
Twelve of the infants (23 %) drank most of either the 0·029 m or the 0·065 m solution (i.e. had highest acceptance scores for either of these two solutions) and were therefore assigned to the high sour group. Of these twelve infants, nine infants had acceptance scores greater than 0·5 for the 0·029 m solution and six infants had scores greater than 0·5 for the 0·065 m solution. Furthermore, three infants had scores greater than 0·5 for both solutions, indicating that these infants accepted the two highest citric acid solutions better than the base solution. The remaining forty-one infants were assigned to the low sour group, as they rejected the two highly sour solutions compared with the base solution and had acceptance scores below 0·5 for these solutions. There were no significant differences between the two groups in infants' age, weight, head circumference, breast-feeding rate, breast-feeding duration and sex ratio (Table 1).
Table 1 Subjects' characteristics at the time of the sour taste acceptance assessment (Mean values and standard deviations)

* Only including children that had ever been breast-fed.
† Ever breast-fed.
Repeated-measures ANOVA, with intake of the four solutions as the within-subject variable and sour group as the between-subject factor, showed a significant main effect of solution concentration (F(3, 153) = 5·44; P = 0·001). When all fifty-three infants were examined as a group, they consumed significantly less of the 0·065 m-citric acid solution than the base solution. There was also a significant main effect of sour group (F(1, 51) = 5·26; P = 0·026), such that the overall solution intake (all four solutions together) was significantly higher for the infants in the high sour group (mean total solution intake 8·92 (sd 1·31) g) than for infants in the low sour group (mean total solution intake 5·52 (sd 0·71) g). Most importantly, a significant interaction effect was observed between infants' intake of the four solutions and sour group (F(3, 153) = 5·35; P = 0·002). The infants in the low sour group consumed significantly less of the 0·029 m and the 0·065 m solution than of the base solution (F(1, 51) = 8·75; P = 0·005 and F(1, 51) = 11·85; P = 0·001, respectively). In contrast, infants in the high sour group drank similar amounts of all four solutions (Fig. 1).

Fig. 1 Fluid intake for 0·0 m, 0·013 m, 0·029 m and 0·065 m added citric acid concentration of the low (▲) and high (●) sour groups. Values are means, with their standard errors represented by vertical bars.
Similar results were found for the acceptance scores. There was a significant main effect of sour acceptance score (F(3, 153) = 16·77; P < 0·001). For the whole group, the acceptance scores for the 0·065 m solution were significantly lower than the acceptance scores of the remaining three solutions. Furthermore, there was a significant main effect of sour group on the sour acceptance score (F(1, 51) = 9·98; P < 0·05). There was also a significant interaction between sour acceptance score and sour group (F(3, 153) = 5·85; P < 0·001). The two groups did not differ in their acceptance for the base solution and the 0·013 m solution, but infants in the high sour group had significantly higher sour acceptance scores for 0·029 m and 0·065 m solutions than infants in the low sour group (Fig. 2). Even though, acceptance scores for the 0·065 m solution were significantly higher for the high sour group, their mean acceptance score of 0·37 being below 0·5, indicating that these infants as a group accepted the 0·065 m solution less than the base solution. However, six infants in the high sour group had acceptance scores above 0·5 for the 0·065 m solution.
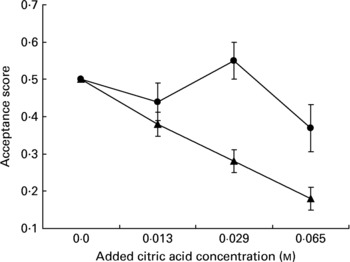
Fig. 2 Acceptance scores for 0·0 m, 0·013 m, 0·029 m and 0·065 m added citric acid concentration of the low (▲) and high (●) sour groups. Values are means, with their standard errors represented by vertical bars.
Infants' sour preferences and dietary intake at 18 months
Of the fifty-three mothers and infants who completed the sour taste assessment, forty-nine mothers had returned completed food diaries at 18 months and forty-five mothers for all three time points. Infants' average macronutrient intakes, as determined from the 18-months dietary records, are summarised in Table 2. There were no significant differences between the two groups in their mean daily energy intake or macronutrient intakes as a proportion of total energy. Additionally, the contribution of the individual food groups to the total energy intake was not different between the two groups (Table 2).
Table 2 Energy intakes and macronutrient and food contributors to energy at 18 months (Mean values and standard deviations)

* Calculated using t tests. Significance level at P < 0·05.
However, infants in the two sour groups differed significantly in their fruit intake (Table 3). Infants in the high sour group had a significantly higher intake of fruits (excluding fruit juices) than infants in the low sour group (t(47) = –2·3; P = 0·025). On average infants in the high sour group consumed nearly twice as much fruits per d as infants in the low sour group (Table 3). There were no differences between the two groups in fruit juice intake. Along with the higher fruit intake, the children in the high sour group also obtained significantly more vitamin C from fruits (P = 0·012) (Table 3). All infants in the study consumed fruits or fruit juice at least once during the 3 d recording period. However, the frequency of fruit consumption (excluding fruit juice) was significantly different between the two groups. In the high sour group only one infant consumed fruits less than once per d during the 3 d recording period, whereas nineteen (46 %) of the children in the low sour group did so (χ2 5·1; P = 0·024).
Table 3 Fruit intake at 18 months (Mean values and standard deviations)
* Excluding fruit juices.
† Fruit consumers only.
‡ Calculated using independent t tests.
§ Calculated using the Mann–Whitney test.
Moreover, infants in the high sour group had a significantly higher fruit variety at 18 months compared with infants in the low sour group (P = 0·015; Mann–Whitney test). Infants in the low sour group consumed on average 3·5 (sd 2·3) different types of fruits during the recording period, whereas infants in the high sour group consumed on average 5·5 (sd 2·3) different types of fruit.
Changes in fruit intake over time in relationship to sour preferences
The progression in daily fruit intake (excluding fruit juice) from 6 to 18 months was examined more closely using repeated-measures ANOVA. There was a significant main effect of age, such that overall mean daily fruit intake was significantly higher at 18 months than at 6 and 12 months (F(2, 86) = 16·7; P < 0·0001). There was also a significant main effect of sour group (F(1, 43) = 4·6; P = 0·039), with infants in the high sour group overall consuming significantly more fruits than infants in the low sour group. Furthermore, there was a significant interaction between fruit intake and sour group (F(2, 86) = 3·6; P = 0·033). As illustrated in Fig. 3, infants in the high sour group had a significantly higher fruit intake at 6 and 18 months than infants in the low sour group. There was no difference at the 12-month time point. However, infants in the high sour group had a 2·5-fold increase in their fruit intake from 12 to 18 months, whereas infants in the low sour group only increased their fruit intake by 50 %. There was also a positive correlation between fruit intake at 12 and 18 months (r s 0·48; P = 0·001) as well as at 6 and 18 months (r s 0·36; P = 0·015).

Fig. 3 Daily fruit intake (excluding fruit juices) at 6, 12 and 18 months of the low sour group (![]() ) and high sour group (□). Values are means, with their standard errors represented by vertical bars.
) and high sour group (□). Values are means, with their standard errors represented by vertical bars.
To demonstrate that the significantly higher intake of the high sour group at 6 and 18 months was solely for fruits, infants' intake of vegetables and sweet snacks (i.e. chocolate, candy, sweet spreads) was examined over time as well. There was a significant main effect of age for the intake of sweet snacks, such that infants from both groups increased their intake of sweet snacks from 6 to 18 months (F(2, 86) = 8·9; P = 0·003). However, there were no significant differences between the two sour groups in their intake of sweet snacks (F(2, 86) = 0·2; P = 0·69) or vegetables (F(2, 86) = 0·26; P = 0·71); in both groups of infants the intake of these two food groups increased equally from 6 to 18 months.
Infants' eating behaviour and maternal influence
There were no significant differences in the infants' reaction to food (t(50) = –0·07; P = 0·94), fussiness (t(50) = –0·03; P = 0·98), food responsiveness (t(50) = –1·0; P = 0·36), slowness in eating (t(50) = 1·2; P = 0·25) or enjoyment of food (t(50) = –1·6; P = 0·11) between the low and high sour groups.
During an earlier time point, mothers completed a 7 d estimated food diary. These food records were used to calculate mothers' fruit variety by counting the number of different fruits consumed over the 7 d period. An independent-sample t test was conducted to examine if there were differences between the two sour groups in their mothers' fruit variety. Results show that mothers of infants in the high sour group had a significantly higher fruit variety than mothers of infants in the low sour group (t(51) = –2·27; P = 0·028).
Discussion
The present study is the first evidence that variations in sour taste acceptance exist between infants, and that some infants do not reject sour tastes. At the age of 15–20 months some infants show a distinct acceptance for highly sour tastes. Of the infants tested in the present study, 23 % readily accepted at least one of the two highest concentrations of citric acid solutions (0·029 m- and 0·065 m-citric acid). To date, studies on infants were only able to demonstrate an innate aversion for the sour taste qualityReference Rosenstein and Oster4. The present results are in line with recent findings by Liem et al. who observed heightened sour preferences in 5–12-year-old children using comparable citric acid concentrationsReference Liem and Mennella9, Reference Liem, Westerbeek, Wolterink, Kok and de Graaf10.
Furthermore, the present exploratory study gives the first evidence that the acceptance of sour stimuli is related to fruit intake. Infants who accepted very sour solutions had a significantly higher intake of fruit and a higher intake of vitamin C from fruits at 18 months. Furthermore, these infants had a higher variety of fruits in their diets and consumed fruits more frequently than infants who rejected the sour taste.
The reason for the association between sour acceptance and fruit intake remains unknown. There are three possible explanations for this relationship. First, compared with other foods, many fruits would have a predominant sour taste. Through a repeated exposure to fruit from an early age some infants might have progressively overcome the innate aversive reaction to sour stimuli. It is suggested in the literature that repeated exposure to a certain flavour or taste can lead to acceptance and even preference for that particular flavour or tasteReference Wardle, Cooke, Gibson, Sapochnik, Sheiham and Lawson17–Reference Sullivan and Birch19. With regard to sour taste in particular, it has been demonstrated that children who were fed hydrolysed formula, which has a distinctive sour taste, during infancy preferred higher levels of sourness in juice than children who had no experiences with this formulaReference Liem and Mennella7, Reference Mennella and Beauchamp8. The finding that children in the high sour group also had a significantly higher fruit intake at 6 months supports the hypothesis that sour acceptance might be due to increased experiences with sour-tasting foods, i.e. fruits in the present study, early in life. While there were no differences in fruit intake at 12 months, infants in the high sour group had a 2·5-fold increase in their fruit intake between 12 and 18 months, whereas infants in the low sour group only increased their fruit intake over that period by about 50 % (Fig. 3).
A second hypothesis is that some infants already accepted highly sour stimuli from birth onwards, which allowed them to accept more fruits to begin with. This possible variability in infants' sour taste acceptance might be genetically determined. Genetic variations in taste sensitivity have been demonstrated for other taste stimuli, such as the bitter taste of 6-n-propylthiouracilReference Mennella, Pepino and Reed20. These variations have been linked to differences in preferences for sweet- and bitter-tasting foods in childrenReference Keller, Steinmann, Nurse and Tepper21. There is also the possibility that there is a developmental shift in sour perception, independent of experiences, that led to the sour acceptance in some infants. It has been shown that infants' salt taste perception changes during the first 4–6 months of life from indifference to preferenceReference Beauchamp, Cowart and Moran22, Reference Beauchamp, Cowart, Mennella and Marsh23. This is thought to be due to developmental changes independent from experiences. As infants' sour acceptance was only assessed at 15–20 months in the present study, it remains unknown if the infants in the high sour group would have accepted the sour stimuli at birth or at 4–6 months of age.
Finally, it is possible that infants' sour taste acceptance and fruit intake are not causally linked at all. Instead, external factors like availability of fruits; parental fruit intake or family income might be responsible for the differences in infants' fruit intakeReference Gibson, Wardle and Watts24. However, a link between sour acceptance and fruit intake does not mutually exclude the influence of other external factors. Our findings that maternal fruit variety was significantly higher for infants in the high sour group suggests that mothers' tendency to eat fruits might influence their willingness to feed fruits to their infants as early as 6 months. This early exposure to fruits then might lead to a higher consumption of fruits at 18 months and to an acceptance of sour tastes. Another indication, that fruit intake and sour acceptance might be causally linked, is the finding that differences in intake at 6, 12 and 18 months for the two sour groups were only observed for fruits. Infants in the two sour groups did not differ in their intake of other food groups, such as vegetables or sweet snacks or in their overall energy intake.
A recent study in older childrenReference Liem, Bogers, Dagnelie and de Graaf11 demonstrated a positive relationship between fruit intake and sour preferences in boys but not in girls. The authors proposed that this was due to the fact that girls' preferences for fruits are more determined by external cues, such as parental control or health-related motives, than taste itself. No sex differences were found in the present study, but due to the young age of subjects it is very likely that external influences might only have a secondary effect on girls' fruit intake, whereas taste and experiences through repeated exposure might account for most of the variations in preferences.
In other studies, a larger proportion of children (35 %9; 58 %10) showed a preference for high concentrations of citric acid than in the present study. The main differences between the Liem et al. studiesReference Liem and Mennella9, Reference Liem, Westerbeek, Wolterink, Kok and de Graaf10 and the present study is the age of the subjects, which implies the use of different methodologies. Liem et al. used a rank-by-elimination procedureReference Liem and Mennella9, Reference Liem, Westerbeek, Wolterink, Kok and de Graaf10, whereas in the present study infants' intake of each solution during brief sequential presentations was measured to determine acceptance. Both methods have been previously used in the appropriate age group and proved to be a reliable measureReference Beauchamp and Moran6, Reference Crystal and Bernstein13, Reference Leon, Marcuz, Couronne and Köster25, Reference Birch, Birch, Marlin and Kramer26. Furthermore, as children grow older they are more and more exposed to sour tastes, not only through fruits but also through extremely sour candiesReference Liem and Mennella9. These extended experiences might be the reason why more children in the Liem et al. studiesReference Liem and Mennella9, Reference Liem, Westerbeek, Wolterink, Kok and de Graaf10 liked the sour-tasting gelatines. However, the number of subjects in all studies is too small to allow global comparison between the percentages of sour accepters to be drawn.
The age of the subjects in the present study did not easily allow for any tests to assess the children's sensitivity to sour. Therefore, the question remains whether the differences in acceptance between the two groups arose because children in the high sour group were less sensitive to higher concentrations of citric acid than the children in the low sour group. In the present study it was the rejection of the highly sour solutions of the children in the low sour group that accounted for the significant differences between the two groups. However, the facial expression of children in the high sour group (i.e. eye squinch or nose wrinkle), observed during the assessment, suggested that these children recognised the sour taste in the solutions although it is possible that they perceived the higher citric acid concentrations as less intense than the children in the low sour group. However, as ethical permission for videoing the taste assessment was not granted for the present study, it was not possible to analyse infants' facial responses during stimuli presentation in more detail. Another possibility for the differences in sour acceptance between the two groups is that infants in the low sour group satiated faster and therefore decreased their intake as the citric acid concentration increased. To ensure that the infants were thirsty for the assessment mothers were asked not to give their infants any drinks 1 h before they came in for testing. Also, the majority of infants in the low sour group increased their intake again after the solution were presented again in reverse order (i.e. from high sour to low sour) indicating that it was the sour taste that suppressed their intake and not satiation.
In conclusion, the present study is the first to demonstrate that at the age of 15–20 months some infants accept high concentrations of sourness, something that has been previously shown in older children. Furthermore, the present results suggest that the acceptance of sour tastes is related to fruit intake in infants. The authors hypothesise that sour taste acceptance might be related to experiences with fruits early in life. However, a limitation to the study is the small sample size. Therefore, further research is needed to confirm the relationship between sour taste acceptance and fruit intake in a larger sample. Additionally it is important to follow up not only the changes in fruit intake over time but also the changes in sour taste acceptance in a longitudinal setting.
Acknowledgements
This research was funded by the European Commission Quality of Life and Management of Living Resources, 5th Framework Programme (QLK1-2002-02 606), as part of the project INFABIO: Effect of diet and lifestyle on risk of gastrointestinal infection and allergy in early life; consumer attitudes and needs. It does not necessarily reflect the European Commission's views and in no way anticipates the Commission's future policy in this area. The authors thank all the mothers and infants who participated in the present study and the partners from the INFABIO project for their input. Also, thanks are due to Bernice Quinn who assisted in the assessment of citric acid concentration in the blackcurrant squash.


