


Introduction
Under the influence of environmental forces, sea ice in the polar regions sometimes forms shore pile-ups. At other times ice rides up and slides inland as much as 100 m, causing damage to trees and coastal installations. Kovacs and 5odhi (1980) have published a review of the literature on ice pile-up and ride-up in Arctic and sub-Arctic waters, along with an account of their own observations.
In the last decade, many artificial islands have been constructed for the exploration of hydrocarbon resources in the Beaufort Sea. Most of these islands have been located in shallow water, where the movements in the fast-ice zone are generally not excessive. But the islands constructed farther offshore may be susceptible to damage by ice encrnachment, Clearly, the design of artificial islands should incorporate features which will help the formation of an ice pile-up (Croasdale and others 1978, Vaudrey and Potter 1981). Once a pile-up is formed, the rubble field around the island tends to protect shore installations by creating a barrier to further ice encroachment. However, the initial pile-up can also function as a ramp and allow ice behind it to climb up very steep embankments.
Since the ice action on a sloping beach is complex, an experimental study was undertaken to determine the factors which promote an ice pile-up. The factors varied in this study were the freeboard, slope and roughness of the beach. The flexural strength and the characteristic length of each ice sheet were determined before each experiment. One experiment was performed to determine the effectiveness of a shore defense structure against ice ride-up. In this paper, a description of the experimental setup and observations made during the experiments are reported. The results are presented in the form of occurrence of a pile-up or a ride-up.
The other experimental studies of this kind, known to the authors, were done by Abdelnour and Edwards (1976) and Reference Semeniuk ASemeniuk (1977). In those studies, the objectives of the model tests were to provide data on the ice ride-up and pile-up phenomena and to develop a predictive model to assess the risk that this ice behavior poses for artificial islands in the Beaufort Sea.
Experiments
The experimental set-up, shown schemetically in Figure 1, consisted of three steel frames, each 1.83 m wide and supported on three pins. Wooden structures were attached to the steel frame so that the parameters of the beach, i.e. freeboard, slope and roughness, could be changed for different experiments. The model beaches are shown in Figures 2 to 9 and their dimensions are listed in Table I.

Fig. 1. Sketch of steel frame 1.83 m wide.

Fig. 2. Sketch showing the freeboard and slope of the beach used in experiments 1, 2, 7 and 8.

Fig. 3. Sketch of the beach with uneven slope (experiment 3).

Fig. 4. Sketch of the beach with uneven slope and obstructions (experiment 4).

Fig. 5. Sketch of the beach used in experiment 5. The left segment of the beach is made rough by triangular wooden pieces.

Fig. 6. Sketch of the beach used in experiment 6.

Fig. 7. Sketch showing the shore defense structure used in experiment 9 and the beach used in experiment 10.

Fig. 8. Sketch of the beach used in experiment 11. The left segment of the beach is rough.

Fig. 9. Sketch of the beach used in experiment 12. The left segment of the beach is rough.
Table 1. Ice Properties, Beach Parameters And Experimental Results

A force-measuring system was incorporated in the beach by the use of instrumented pins. Shortly after installation, the underwater pins developed leaks, resulting in their malfunction, while the above-water pins worked well. The normal reaction force could be used to determine the ice force if its point of action and direction were known. Later, two instrumented rods were attached to the carriage to obtain the horizontal forces required to push the ice sheet. The ice-force data are not presented in this paper as they are still not correlated with events taking place during the ice action on the beach.
The ice sheets were grown by seeding and freezing a 1% urea-in-water solution at an ambient temperature of -12°C, The texture of the resulting ice sheet may be described as columnar. The flexural strength and characteristic length of each ice sheet were determined before each experiment; the values are given in Table I. The ice sheets were pushed at constant speeds, which are also listed in Table I. The experiments were photographed and recorded on video tape.
Results
An account of the observations made during each experiment is given below.
Experiments 1 and 2
The ice sheet was pushed against the sloping beach shown in Figure 2 at speeds of 2.3 and 6.0 cm s−1. It broke into blocks as sloping surface. Although a pile-up the left-hand side of the beach, it form outside the beach area due to ice with a deflector plate which was protect the instrumentation cable. outcome of the experiments is said rence of ice ride-up.
Experiments 3 and 4
The objective of these two experiments the effect of uneven beach it rode up the occurred on had started to interference of s installed to Therefore, the to be an occurpresence of obstructions such as boulders or other structures. The configuration of the beach, shown in Figures 3 and 4, was changed from that in experiments 1 and 2. In experiment 4, the ice sheet started to ride up and then slid back after encountering resistance from large obstructions. The ice sheet also failed many times due to buckling. The rubble formed during this failure sank, and there appeared to be no pile-up above the water. The loss of rubble under the water resulted in a ride-up. Thus it was concluded that the profile of the sea floor should be incorporated in order to prevent the rubble from submerging.
Experiment 5
From the experience gained in previous experiments, an underwater ledge was incorporated, as shown in Figure 5. The left-hand segment of the beach was made rough by nailing triangular wooden pieces to the structure. At first, the ice sheet rode up on all three segments. Then it buckled and formed rubble on the rough end of the beach. After some time, a sheet of ice lodged on the rough surface. Subsequently, the ice rode up over this and there was flooding on top of the ice sheet at the lower end of the beach. It is believed that the shallow underwater ledge (ID cm below water level) prevented the ice sheet from submerging further, as had happened many times during previous experiments. The outcome of this experiment was a pile-up in the beginning and then a ride-up towards the end of the experiment.
Experiment 6
The profile of the beach is sketched in Figure 6. All three segments of the beach were smooth, and the underwater ledge was 25 cm below the surface. After a small initial ride-up, the ice slid back, buckled, and formed rubble from the beginning to the end of the experiment. There were many instances of buckling taking place in small and large areas of the ice sheet. Similar observations have been reported by Reference GladwellGladwell (1977) during ice action against a rubble field around the artificial island Netserk F40. The ice sheet was observed to move forward with a jerking motion. This is believed to be caused by the flexibility of the ice sheet and not by the carriage, which was observed to move at a constant speed. The outcome of this experiment was an ice pile-up.
Experiment 7
The ice sheet used was the same as in the previous experiment, and the beach geometry was the same as in experiment 1 (Fig.2.). The ice sheet rode up the inclined surface and there was no pile-up.
Experiment 8
The beach geometry was the same as in experiment 1 (Fig.2.), and a new ice sheet was used, which rode up the inclined surface. This and the previous experiment were conducted to confirm the ice ride-up for the same beach geometry but for different ice properties.
Experiment 9
In this experiment, four shore defense structures were placed at spacings of 1.83 m, as shown in Figure 7. These structures were similar to those proposed by Vaudrey and Potter (1981) and the objective was to observe their effectiveness. The ice rode up on the structures, failed in bending, and started to form a pile-up. Further interaction of the ice sheet with rubble ice resulted in buckling failure. The outcome was an ice pile-up.
Experiment 10
The profile of the beach for this experiment is shown in Figure 7. The same ice sheet was used as in the previous two experiments. The observations made were the same as those for experiment 6. An ice pile-up formed at the end of this experiment.
Experiments 11 to 35
After gaining experience from the previous ten experiments, it was decided that a set of experiments should be performed in which the beach parameters (freeboard, slope and roughness) would be changed. The beach profiles used in experiments 11 and 12 are shown in Figures 8 and 9, respectively. As these profiles are typical, the other beach profiles are not sketched. During this set of experiments, the left-hand segment of the beach was made rough by nailing on triangular wooden bars as shown in Figures 5, 8 and 9. The other two segments of the beach were smooth. This was done to observe any difference between the effects of smooth and rough surfaces of the beach. The values of the freeboard and the slope of beach profiles are given in Table I along with the thickness and properties of the ice sheet used in these experiments. The outcome of each experiment is also listed in Table I in terms of ice pile-up (P) or ride-up (R).
In the case of an ice ride-up, the ice sheet failed by bending into blocks and rode up the beach. But an ice pile-up was preceded by an initial ride-up until the ice sheet either fell back or lodged itself on the beach. Occasionally, the ice sheet buckled across part of or the whole of the width of the beach. During the above processes, there was formation of rubble at the beach. Sometimes, the ice sheet would ride up on top of the rubble formed in an ice pile-up. The outcome of the experiments listed in Table 1 corresponds to the development of a steady-state situation after considerable (>10 m) movement of the ice sheet.
Figure 10 shows profiles of an ice pile-up in experiment 12 along two lines in the middle of the rough and smooth segments of the beach. A general observation can be made on the effects of beach surface that the ice sheet started to form a pile-up on the rough segment of the beach earlier than on the smooth segment. Unce pile-up developed, there was very little difference in the ice action or the profiles of the pile-up formed on the rough and smooth segments of the beach.
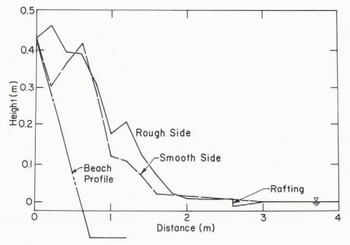
Fig. 10. Profiles of the ice pile-up in experiment 12.
Discussion
During the experiments which resulted in ice pile-ups, the ice sheet slid back and buckled many times. In an attempt to group the occurrences of pile-up and ride-up, it seems logical to plot some parameters of the beach with respect to those of the ice sheet.
The ice force required to push an ice sheet which will overcome gravitational and frictional forces may be said to be proportional to the weight of the ice sheet on the beach (Kovacs and Sodhi 1980), and this force per unit width is proportional to Hh(l+ μcotα), where H is the freeboard, a the slope angle, μ the coefficient of friction and h the ice thickness. However, the force per unit width is proportional to Hh(l-μcotα) if the ice sheet on the beach is sliding down and pushing the floating ice down.
The force per unit width required to fail an Ice sheet in bending is proportional to ofh2/L (Croasdale and others 1978), where of is the flex-ural strength and L the characteristic length of the ice sheet. In Figure 11, H(l- μcotα) is plotted with respect to ofh/L with dark circles for pile-ups and open circles for ride-ups as indication of the outcome of an experiment. The coefficient of friction μ between ice and plywood was measured to be 0.09 (Haynes and others 1982). There is no estimate of μ for the rough segment of the beach.

Fig. 11. Plot of H(l- μcotα) with respect to L2/h.
The force per unit width required to fail an ice sheet in buckling is proportional to L2 (Reference SodhiSodhi 1979). In Figure 1 Z, H(l+ μcotα) is plotted with respect to L2/h, as in Figure 11.
One can see in Figure 11 that the occurrences of ice pile-up and ride-up are grouped, and there is no such grouping in Figure 12. It should be warned that the number of data points are too few to draw any conclusions, and the results of this study should not be used in constructing prototypes. However, H(l- μcotα) appears to provide a group of parameters which can be correlated with the flexural properties of an ice sheet for identifying the occurrence of an ice pile-up or ride-up (Fig.11.).

Fig. 12. Plot of H(1+ μcotα) with respect to L2/h.
Summary
Experiments were performed to observe ice pile-ups or ride-ups. The beach profiles were changed to vary the freeboard, slope and roughness of the beach. The occurrence of an ice pile-up or ride-up is reported as the final outcome of the experiment. The rough beach promoted ice pile-up earlier than the smooth beach.
The factors which govern the occurrence of an ice pile-up or ride-up are discussed.


