


“Does a low election turnout indicate voters are disillusioned or content?” asked a headline in one of the world’s oldest newspapers, The Herald, during the run-up to the 2003 Scottish Parliamentary election (The Herald 2003). The Glasgow-based broadsheet speculated that some eligible voters abstain in order to “register their disillusion,” while others are “content with the way things are.” This intuition reflects the current state of the scientific debate on the impact of citizen’s satisfaction on voter turnout. More broadly, the headline itself shows how pundits usually conceptualize the relationship between satisfaction with the way democracy works and voter turnout: the former as the cause and the latter as the effect. However, such a view is incomplete. There are both theoretical reasons and empirical findings that suggest the presence of a reversed relationship. In this article, we use data from 24 panel studies and debunk the conventional wisdom. We find no evidence for the effect of democratic satisfaction on voter turnout, but robust support for the reversed relationship. In other words, voter turnout tends to affect satisfaction and not the other way around. In national and subnational elections, the effect is positive. It is stronger in majoritarian electoral systems and among voters who think that their preferred party won the election. Conversely, in supranational elections, the effect is negative and affects the whole electorate.
HYPOTHESES
Satisfaction with democracy is best understood as an indicator of regime performance, falling between more diffuse support for political community and regime principles and more specific support for regime institutions and political actors (Norris Reference Norris and Pippa1999; Linde and Ekman Reference Linde and Ekman2003; Norris Reference Norris2011; Linde Reference Linde2012). Political science literature that examines the impact of this satisfaction on voter turnout is divided into two camps (Pacek, Pop-Eleches, and Tucker Reference Pacek, Pop-Eleches and Tucker2009; Ezrow and Xesonakis 2016). Some literature, especially earlier work, perceives nonvoting as a sign of satisfaction with the current state of affairs (e.g., Tingsten [Reference Tingsten1937] 1963; Wilson Reference Wilson1936; Lipset Reference Lipset1981). Other work, especially more recent literature, holds that “dissatisfaction with democratic performance is usually regarded, at least implicitly, as an important cause of civic disengagement” (Norris Reference Norris2011; see also Kostadinova Reference Kostadinova2003). Both perspectives agree on the direction of causality and assume that perception of the overall functioning of the political system motivates the decision to vote or abstain. Based on this assumption, political scientists frequently use satisfaction with democracy to predict voter turnout (e.g., Grönlund and Setälä Reference Grönlund and Setälä2007; Flickinger and Studlar Reference Flickinger and Studlar2007; Hadjar and Beck Reference Hadjar and Beck2010; Karp and Milazzo Reference Karp and Milazzo2015).
Hypothesis 1a: Satisfaction with democracy decreases voter turnout.
Hypothesis 1b: Satisfaction with democracy increases voter turnout.
Most empirical research either employs post-election surveys or studies macro-level data using measurements from non-electoral surveys. Both methods are problematic. The macro-level data approach can provide only indirect evidence of the causal mechanism, while the post-election type of measurement implicitly presupposes that the election itself has not altered citizens’ level of democratic satisfaction. Such presupposition is questionable.
Elections are at the heart of contemporary democracy (Dahl Reference Dahl1971; Huntington Reference Huntington1991). They are the principal means of changing the political course of a democratic polity. It is through elections that an unpopular incumbent can be voted out of office and replaced by a more popular alternative. They represent the most tangible embodiment of the democratic principle to which citizens are regularly and systematically exposed. It would be surprising if elections had no effect on citizens’ views about how democracy works in their country. We hypothesize that, in most circumstances, elections boost satisfaction with democracy, especially among citizens who play the democratic game.
Hypothesis 2: Electoral participation increases satisfaction with democracy.
However, the impact of electoral participation is likely to vary across contexts and individuals. An increase in satisfaction can be expected only if there is a clear link between election outcomes and government composition. A quintessential example of elections where such a link is tenuous are supranational elections to the European Parliament (EP). Although they are run essentially as national contests on national issues (Reif and Schmitt Reference Reif and Schmitt1980), a party winning the national vote may end up in the losing camp at the supranational level. Furthermore, the European Union’s institutional structure and operating mechanisms further hinder accountability (Follesdal and Hix Reference Follesdal and Hix2006). Consequently, the positive effect of elections on satisfaction should be weak or inexistent in EP elections. On a more general level, following Aarts and Thomassen (Reference Aarts and Thomassen2008), we expect that elections under majoritarian electoral rules allow for more accountability and, therefore, boost satisfaction with democracy more strongly than elections using proportional representation.Footnote 1
Hypothesis 3: The positive effect of electoral participation on satisfaction with democracy is weak or inexistent in European Parliament elections.
Hypothesis 4: The positive effect of electoral participation on satisfaction is stronger in majoritarian electoral systems.
As for individual-level variations, it is obvious that election outcomes are not equally liked or disliked by all voters. Citizens’ preferences presumably condition election-related change in satisfaction. Winners—those who prefer the party (or parties) that won the election—are likely to see their satisfaction increase much more than those who prefer a losing party.
Hypothesis 5: Satisfaction with democracy increases the most among election winners.
The impact of elections and election outcomes on mass political attitudes has been studied empirically by a vibrant body of political science literature. These studies have generally found that those who participate in an election consider the outcome of the election as more legitimate than do abstainers (Nadeau and Blais Reference Nadeau and Blais1993) and that winners become more satisfied than losers (Anderson et al. Reference Anderson, Blais, Bowler, Donovan and Listhaug2005; Henderson Reference Henderson2008; Singh Reference Singh2014; Campbell Reference Campbell2015; Singh and Thornton Reference Singh and Thornton2016). Although these studies provide valuable insights, they suffer from the same limitation as the aforementioned research because they are based on the same kind of post-electoral surveys. They consequently do not allow researchers to control for pre-election attitudes. Panel studies, which do allow such a control, are rare, usually cover only a single election, and often study different, typically more specific, types of political support. These studies have found that voting in elections increases external efficacy (Ginsberg and Weissberg Reference Ginsberg and Weissberg1978) and perceptions of legislators’ responsiveness (Clarke and Kornberg Reference Clarke and Kornberg1992). Those increases tend to be the strongest among election winners, who also become more trustful of government (Anderson and LoTempio Reference Anderson and LoTempio2002) and less cynical about political parties (Banducci and Karp Reference Banducci and Karp2003). Increases in satisfaction with democracy were observed in the 1999 legislative election in New Zealand (Banducci and Karp Reference Banducci and Karp2003), the 2010 North Rhine-Westphalia election (Singh, Karakoç, and Blais Reference Singh, Karakoç and Blais2012), and the French presidential election of 2012 (Beaudonnet et al. Reference Beaudonnet, Blais, Bol and Foucault2014). Blais and Gélineau (Reference Blais and Gélineau2007) found a positive effect on voters in general and winners, particularly in the Canadian election of 1997. Finally, Blais, Morin-Chassé, and Singh (2015) found that satisfaction increased among those who voted for parties that gained greater shares of votes, seats, and cabinet portfolios. All these findings reveal that the use of post-electoral measures of satisfaction can be a risky strategy since causality may go in the opposite direction. We thus proceed to a systematic examination of the relationship between satisfaction with democracy and voter turnout.
All these findings reveal that the use of post-electoral measures of satisfaction can be a risky strategy since causality may go in the opposite direction.
DATA
To test the five hypotheses, we use individual-level survey data from the Making Electoral Democracy Work project (Blais Reference Blais2010; Stephenson et al. Reference Stephenson, Blais, Bol and Kostelka2017). The project studies national, subnational, and supranational elections held between 2010 and 2015 in five countries (Canada, France, Germany, Spain, and Switzerland).Footnote 2 Our dataset consists of 24 regional election samples that cover 17 elections held between 2010 and 2015 (five national, nine subnational and three supranational; see the online appendix). These data are particularly suitable for disentangling the satisfaction-turnout nexus since it has a two-wave panel structure and provides both a pre-election and post-election measure of satisfaction with democracy. Respondents were asked, generally one week before and one week after the given election, to indicate their degree of satisfaction with democracy at the election-related level of governance. They were proposed a 0–10 scale where 0 means “not satisfied at all” and 10 “very satisfied.”Footnote 3 We divide the scale by ten so that it varies between 0 and 1.
The control variables are the classic predictors of electoral participation commonly used in political science research such as age, education, and political interest (Blais Reference Blais, Klingemann and Dalton2007, see the online appendix for descriptive statistics). It should be noted that all the control variables were measured in the pre-election surveys while the main variable of interest—reported electoral participation—was measured after the election. Hypotheses 3 and 4 are tested by dummy variables that distinguish between types of elections (national, subnational and supranational) and different electoral systems (majoritarian and proportional). To test hypothesis 5, we introduce two dummy variables that ascertain whether voters think the party for which they had cast a vote won or lost (abstainers and don’t knows are the reference category).Footnote 4 Finally, all of the following analyses include region (or election-region) dummies.
FINDINGS
In table 1, we present the results of four analyses. Model 1 regresses electoral participation on the pre-election and post-election measures of satisfaction with democracy alone.Footnote 5 In conformity with hypothesis 2, the post-election measure is much more strongly associated with voting than the pre-election one. Because pre-election measures are also positive and statistically significant, however, we cannot yet rule out that pre-election satisfaction fosters voting too (hypothesis 1b). Therefore, in model 2, we test the pre-election measure alone while incorporating the control variables. The coefficient is now even smaller than in model 1 and no longer meets the most lenient threshold of statistical significance. This means that the weak positive effect of the pre-election measure in model 1 was actually driven by variables more closely related to voter turnout, such as education or interest in politics. People who are dissatisfied with democracy before the election do not participate less because they are dissatisfied but because they are less educated or uninterested in politics. In contrast, the effect of the post-election measurement in model 3, which also incorporates control variables, is still substantial and meets the most rigorous threshold of statistical significance. Furthermore, the findings from models 2 and 3 are confirmed in model 4 in which the two measures are tested jointly with the control variables. While the post-election measure remains statistically significant, the pre-election measure changes sign and is insignificant. All the models point in the same direction: conventional hypotheses (1a and 1b) are rejected while the first alternative hypothesis (2) is supported.
Table 1 Turnout and Satisfaction with Democracy
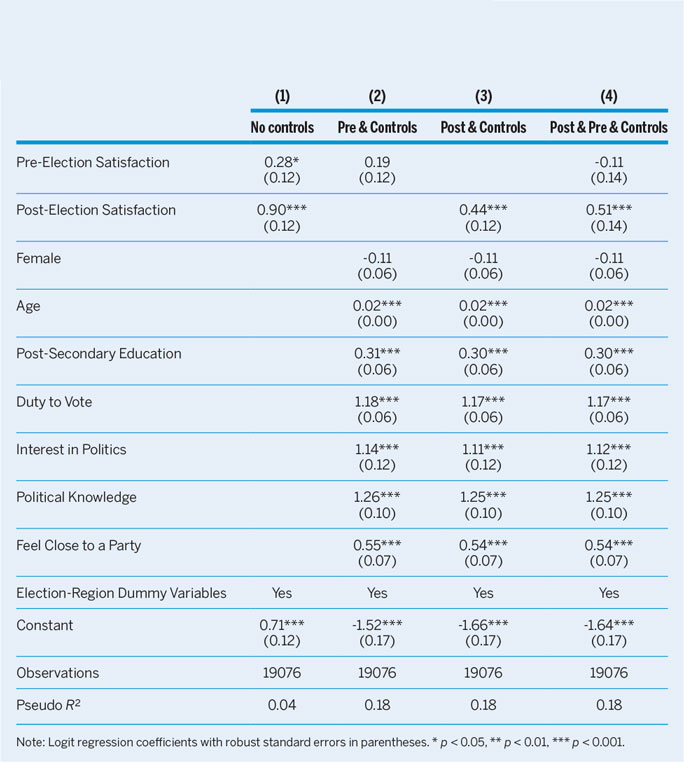
Note: Logit regression coefficients with robust standard errors in parentheses. * p < 0.05, ** p < 0.01, *** p < 0.001.
Figure 1 graphically expresses the relationship between electoral participation and post-election satisfaction. It displays the average marginal effects (AME) calculated from model 3. If post-election satisfaction was the cause and voting the effect, it could be understood as the change in the probability of voting when respondents’ value on satisfaction increases. If we did not have the pre-election measure, we would conclude that a shift from no satisfaction to maximal satisfaction increases the probability of voting by approximately five percentage points. This is a large effect, which would appear to provide compelling evidence for the conventional interpretation (hypothesis 1b). Comparing pre-electoral and post-electoral satisfaction, however, demonstrates that turnout is related to post-election satisfaction and not to pre-election satisfaction. It is thus voting that boosts satisfaction and not the other way around.
Figure 1 Predicted Probability to Vote and Satisfaction with Democracy
The impact of voter turnout on satisfaction with democracy is formally tested in table 2. The dependent variable is the change in satisfaction with democracy between the pre-election and post-election measurements. The main predictor of interest is turnout. To take ceiling effects into account, we control for pre-election satisfaction. The result clearly corroborates hypothesis 2: voting increases satisfaction with democracy by 0.02 (0.2 on the 0–10 scale) among voters when compared to abstainers (the reference category).
Table 2 Pre-Post Change in Satisfaction with Democracy and Turnout
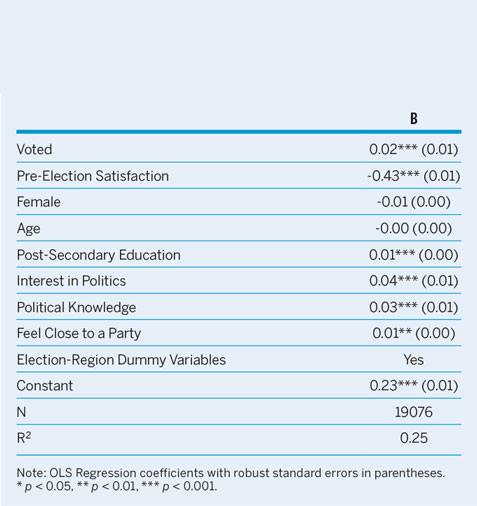
Note: OLS Regression coefficients with robust standard errors in parentheses. * p < 0.05, ** p < 0.01, *** p < 0.001.
To test hypotheses 3 and 4, we added election type and electoral system as predictors in the model presented in table 2. Each variable was also interacted with voting. We plot the effects of these variables in figures 2 and 3.Footnote 6 We use average marginal effects, which express the predicted change in satisfaction with democracy for voters and abstainers in different institutional contexts.
Figure 2 Predicted Pre-Post Change in Satisfaction with Democracy by Election Type

Figure 3 Predicted Pre-Post Change in Satisfaction with Democracy by Electoral System
In terms of election types (figure 2), national and subnational elections increase voters’ satisfaction by approximately 0.03 while exerting no effect on abstainers. Conversely, supranational elections to the European Parliament depress satisfaction in the whole electorate by practically the same amount. This validates and even exceeds the expectations of hypothesis 3. It suggests that European Parliament elections expose the democratic imperfections of the European Union and, instead of boosting democratic satisfaction, they decrease it.
Given the peculiarity of supranational elections, we focus on national and subnational elections in the remaining analyses. Figure 3 displays the effects of electoral systems. In line with hypothesis 4, elections run under majoritarian rules increase satisfaction among voters twice as strongly (0.04) as elections in proportional systems (0.02). As in figure 2, abstainers’ level of satisfaction remains stable in both types of systems.
There is no evidence that those who are less satisfied before the election vote less.
Finally, we examine the impact of perceptions of election outcomes. Figure 4 shows that, as predicted by hypothesis 5, the effect is much stronger among election winners. Those who believe that their preferred party won the election see their satisfaction increase by 0.09 (0.9 on the 0–10 scale). Nevertheless, a substantially small but statistically significant increase is also observable among election losers. This reveals that elections tend to legitimize democracy among all voters and not only winning parties’ supporters.

Figure 4 Predicted Pre-Post Change in Satisfaction with Democracy among Voters
CONCLUSION
This article questions the conventional view of the causal relationship between satisfaction with democracy and electoral participation. What is thought by many to be the cause is actually the effect, and vice versa.
This finding has important implications. First, the results of earlier studies based on post-electoral surveys need to be reinterpreted. Based on our findings, those prior works do not testify to the impact of satisfaction on voting but instead to the impact of voting on satisfaction. There is no evidence that those who are less satisfied before the election vote less.
Second, our analysis contributes to the broad literature on the role of elections in democracies. It provides robust support for the legitimizing effect of elections. We show that in national and subnational elections, especially those run under majoritarian rules, voting increases the satisfaction of all voters—even those who lost the election—and that it strongly boosts the satisfaction of those who believe they won the election. In that respect, the generalized boost in satisfaction with democracy resembles the honeymoon effect, which also affects both election winners and losers (Brody Reference Brody1991). Future studies should investigate to what extent the two phenomena are related and whether the election-driven boost in satisfaction with democracy is as temporary as the honeymoon.
There are certainly circumstances in which citizens can become less satisfied after an election. In this study, we found that supranational elections decrease satisfaction both among voters and abstainers. Similar negative effects can be expected in other contexts in which elections produce outcomes that are seen as distorted, illegitimate or ineffective, and it may affect especially those who voted for parties that fail to gain any representation (Blais, Morin-Chassé, and Singh Reference Blais, Morin-Chassé and Singh2015). For instance, satisfaction may decrease among those voters in the United States whose preferred presidential candidate loses the White House despite winning the popular vote, as did the Democratic candidate in 2000 and 2016 (Craig et al. Reference Craig, Martinez, Gainous and Kane2006). More generally, future research should explore in greater detail how contextual factors such as disproportionality or party system fragmentation condition the effect of elections on citizens’ satisfaction.
Third, our findings underline the pitfalls of using satisfaction with democracy measured in post-electoral surveys to predict voting behavior. These attitudes are likely to be affected by the election itself. The causal arrow may go in the other direction: from voting behavior to attitudes.
Finally, our results remind us that elections are a central democratic institution. In retrospect, it seems obvious that elections affect how citizens perceive the functioning of democratic regimes. This does not rule out the possibility that other factors such as political scandals may produce strong shifts in satisfaction with democracy (Kumlin and Esaiasson Reference Kumlin and Esaiasson2012). The bottom line, however, is that elections matter and that, most of the time, participating in an election makes citizens more satisfied with the way democracy works.
SUPPLEMENTARY MATERIAL
To view supplementary material for this article, please visit https://doi.org/10.1017/S1049096517002050


