


INTRODUCTION
Bats have increasingly been identified as reservoirs of pathogens that can spill over to humans. These pathogens include rabies, severe acute respiratory syndrome coronavirus, Ebola, Marburg, Nipah and Hendra virus [Reference Hayman1–Reference Plowright4]. To understand the conditions that enable pathogens to spill over from bats to other species, we need to understand the mechanisms driving pathogen dynamics within and among bat hosts. Pathogen spillover events are often associated with sharp increases, or pulses, in pathogen prevalence that vary in amplitude and timing [Reference Plowright4–Reference Field6], but the mechanisms driving these pulses are unknown. Therefore, characterizing pulse variation across space and time, and identifying biotic and climatic factors associated with these pulses, will enhance our ability to predict and manage spillover [Reference Hayman1, Reference Plowright7, Reference Plowright8]. Longitudinal studies across time and space are necessary to identify such factors [Reference Begon9, Reference Brownstein, Holford and Fish10], but such studies for wildlife zoonoses are rare. We use a longitudinal dataset of Hendra virus prevalence obtained across Eastern Australia to quantify seasonal, climatic and bat density effects on pulse characteristics.
Hendra virus emerged in 1994, killing 20 horses and a horse trainer, which prompted a wide-scale investigation into the source of the spillover [Reference Murray11]. Although pteropopid bats of Australia were eventually identified as the natural reservoir hosts of Hendra virus [Reference Young12], spatiotemporal variation in Hendra virus prevalence and spillover has only recently been investigated. Recent studies suggest that Hendra virus prevalence peaks during winter months in subtropical Australia [Reference Field6]; however, it has not been determined whether this occurs periodically over time. Moreover, the synchrony of Hendra virus fluctuations and the effects of local climatic conditions on prevalence are unknown. Such information is however needed to develop predictions of disease incidence and spillover risk [Reference Grenfell, Bjornstad and Kappey13–Reference Koelle and Pascual15].
Previous studies have also shown associations between bat species and Hendra virus prevalence. Most evidence suggests that variation in prevalence is explained by the relative abundances of spectacled (Pteropus conspicillatus) and black (Pteropus alecto) flying foxes [Reference Goldspink16–Reference Field19]. However, P. alecto is of particular concern because this species is widely distributed in coastal North Eastern Australia, and often forages in urban and peri-urban areas [Reference Markus and Hall20, Reference Parry-Jones and Augee21]. P. alecto is also expanding its range southwards and permanently occupying urban habitats [Reference Markus and Hall20, Reference Roberts22]. Changes in bat abundance over areas with different levels of human development is important for disease management because such changes are likely to affect the frequency of Hendra virus outbreaks and spillover events [Reference Plowright23]. To better assess these risks, it is therefore important to quantify how Hendra virus prevalence changes with the abundance of flying foxes.
Previous studies have proposed several hypotheses to explain the temporally discrete pulses of Hendra virus prevalence [Reference Plowright7]. First, such pulses may be driven by spatiotemporal variation in population density and contact rates, with birth or immigration providing an influx of susceptible individuals. Spatiotemporal data could provide support for this hypothesis if pulses of Hendra virus are associated with increased bat density. Second, pulses of Hendra virus prevalence may result from viral reactivation in chronically or persistently infected individuals [Reference Plowright4, Reference Plowright7]. Environmental conditions that increase physiological stress, such as low food abundance [Reference Plowright24] or extreme high or low temperatures [Reference Welbergen25] could favor viral reactivation and could therefore be correlated with the timing or magnitude of pulses. These hypotheses are not mutually exclusive but such patterns of spatiotemporal variation may provide inferences to help decipher the drivers of Hendra virus prevalence.
Here, we use the Hendra virus spatiotemporal data from Field et al. [Reference Field6] to determine whether Hendra virus is characterized by seasonal fluctuations in prevalence and to quantify the population synchrony and spatial scale of these fluctuations. We then test whether site-specific biotic and abiotic climatic conditions can help us explain the timing and amplitude of Hendra virus pulses. We therefore build on the work by Field et al. to contrast the different effects of seasonality, climate and bat abundance on Hendra virus prevalence.
MATERIALS AND METHODS
Hendra virus sampling
We use data of Hendra virus prevalence and bat abundance collected over 3·5 years (July 2011 to November 2014) across a latitudinal gradient in Eastern Australia. To measure Hendra virus prevalence, Field et al. [Reference Field6] collected urine from plastic sheets that were divided into quadrants and placed under bat roosts. Depending on roost size and accessibility, a variable number of sheets were utilized per roosts (see results). Urine was pooled from within each quadrant and quantitative PCR was used to determine the presence or absence of Hendra virus within each pooled sample. Thus, we define prevalence based on Hendra virus detection per pooled urine sample, rather than per individual bat. Pooled urine samples may have contained urine from up to four species of flying foxes. In the dataset, each pooled urine sample was thus associated with a roost location, a date, a sampling sheet and a quadrant within the sampling sheet [Reference Field6]. The data also contain qualitative counts of bat species, P. alecto, Pteropus scapulatus, P. conspicillatus and Pteropus poliocephalus, roosting at the site. However, the effects of P. conspicillatus were not considered as this species occurs only in Northern Queensland and had small representations in the data (being present only in Cairns Central).
To describe abiotic factors at each roost, we acquired climate data at 5 km raster grids from the Australian Bureau of Meteorology. The climate data included minimum and maximum daily temperatures and total daily rainfall for 2011–2014. We processed these data into monthly minimum and maximum temperatures and monthly cumulative precipitation specific to each site [Reference Giles27]. We excluded Cairns Central due to a lack of information. The climate variables were further aggregated into annual quarterly intervals to summarize the average minimum and maximum temperature and average monthly rainfall for each season (i.e. winter, spring, summer; discussed further below).
Statistical modeling
Broad sources of variation in Hendra virus prevalence
We used data from the 11 sites that had the best temporal representation such that each selected site had data for at least 50% of the total monthly samples (i.e. from January 2012 to November 2014). Sites spanned the latitudinal gradient of Hendra virus occurrence in Eastern Australia (Fig. 1). We excluded sites with fewer data because they were insufficient to quantify pulse periodicity and synchrony. On the 11 sites with sufficient data, we fit a generalized mixed-effects model to quantify the effects of among-sheet, among-site and among-year variation, while taking into account the effect of bat abundance. Specifically, the natural log bat abundances were fit as fixed effects, whereas the sampling sheet, sampling site and the year of sampling were fit as random effects in a mixed-effects logistic regression model using the package MCMCglmm in R [Reference Hadfield28] (R code available in the online Supplementary Material).
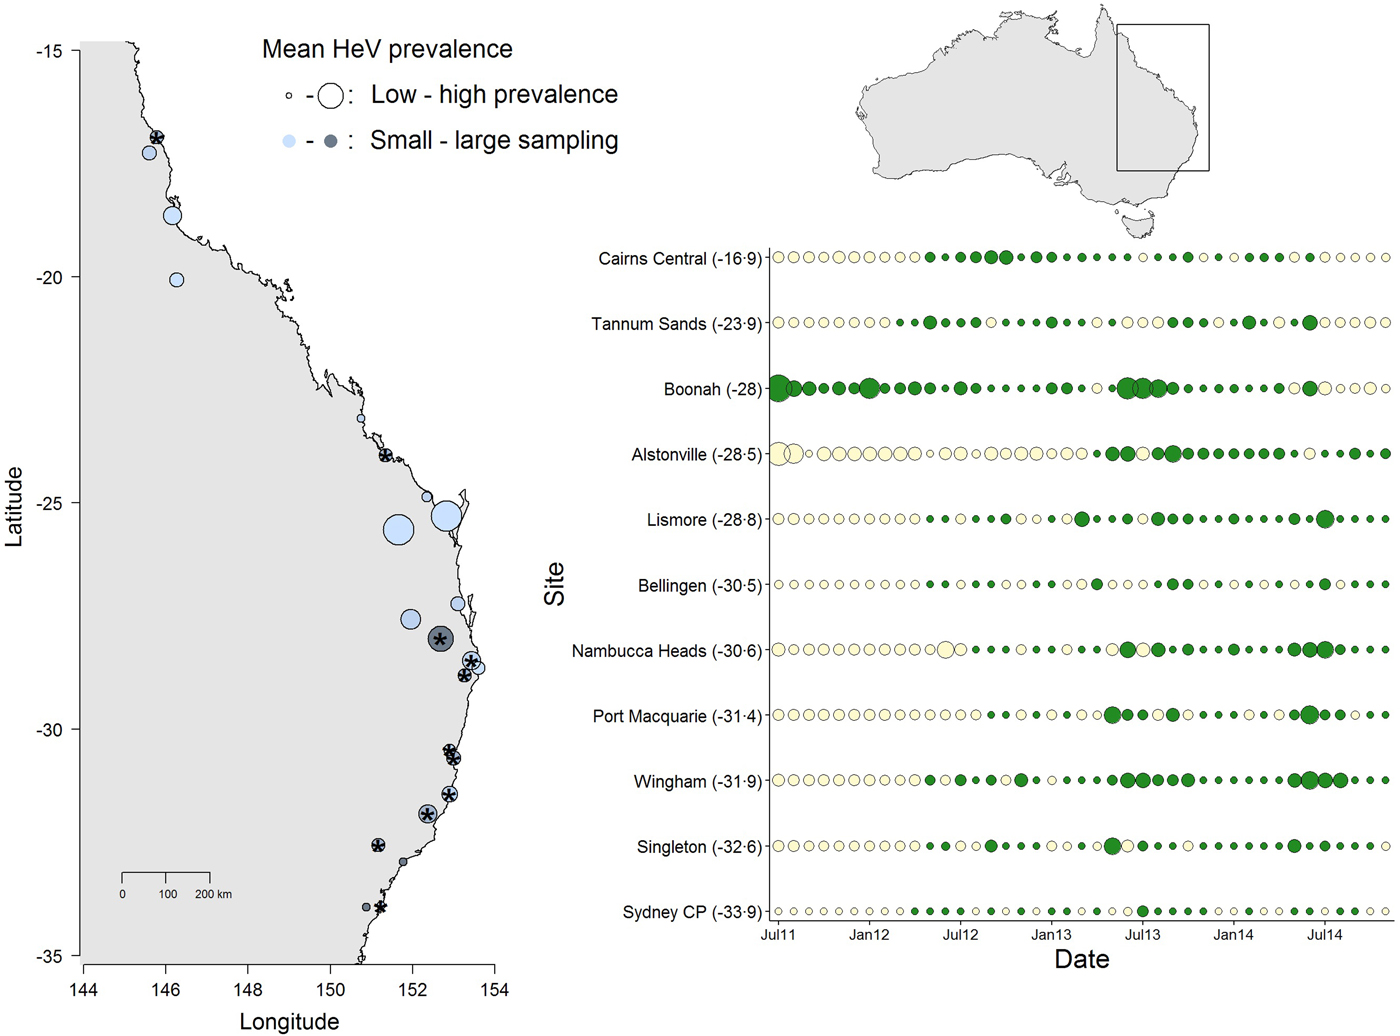
Fig. 1. Spatial and temporal variation in Hendra virus prevalence in Eastern Australia. The map (left) shows average prevalence across sites: bigger dots are higher prevalence and the light-dark blue gradient represents low–high sampling intensity. The panel (right) shows the temporal variation in Hendra virus prevalence for 11 sites marked with ‘*’ in the map, chosen because of their large temporal representation. Sites are ordered from north (top) to south (bottom) and dot size is proportional to prevalence magnitude (green coloring are sampled data, whereas cream coloring are predicted prevalence values from a Bayesian imputation procedure described in the methods). The smallest dots are instances when Hendra virus prevalence = 0. Models estimating periodicity and synchrony employ data from January 2012 onwards. We show data starting from 2011 to emphasize the high prevalence observed in Boonah.
The results from this model showed significant temporal and spatial effects on Hendra virus prevalence (see results below), which justified evaluating temporal characteristics of Hendra virus prevalence and spatial synchrony. However, due to logistical challenges in field sampling, site-specific time series had missing prevalence data. We therefore used a multiple imputation protocol that allowed us to predict missing values for the time series of the 11 sites. Specifically, missing values were predicted by fitting a polynomial function of time that also considered the prevalence values of neighboring sites (when available) in the form of prior information [Reference Honaker, King and Blackwell29]. These priors were thus built using the mean and variance in Hendra virus prevalence across sites, within 300 km (see Fig. 1). We used uninformative priors in cases where the variance in Hendra virus prevalence could not be calculated (i.e. when only one data point existed for a given date, or in cases where prevalence across all sites was 0). Our preliminary analyses showed that the prediction of numerous sequential missing values, such as those characteristic of 10 out of the 11 sites (the exception being Boonah) from July 2011 to January 2012, was poor (Fig. 1). Therefore, we only used predicted data over the time between January 2012 to November 2014.
Temporal and spatial variation
We used wavelet transforms to quantify the periodicity of Hendra virus prevalence. In contrast to other methods, no a priori assumptions are needed to quantify periodic signals using wavelet transforms [Reference Cazelles30]. Furthermore, wavelet transforms are useful to detect periodic signals that are localized in time [Reference Cazelles30]. We employed a Morlet mother wavelet to calculate a power spectrum for each time series and to find significant periodic signals across time [Reference Cazelles30–Reference Torrence and Compo32]. Wavelet analyses were conducted using the biwavelet package [Reference Gouhier31] in R.
In addition to testing for periodic signals of Hendra virus prevalence, we formally tested the hypothesis that the largest amplitude pulses of Hendra virus occurred over winter (June to August in subtropical and temperate Australia). For this, we used the measured prevalence values (i.e. omitting the predicted values). For each site, we extracted both the timing and amplitude of the largest amplitude annual pulse (for this analysis, we also included the Boonah data collected in 2011). We then used a mixed-effects logistic regression to model the pulse amplitude as a function of the time in calendar months (i.e. 1–12) when the pulse occurred. We fit a quadratic effect of pulse timing to test whether the largest amplitudes occurred more often over winter (i.e. calendar months 6–8) and included the latitudinal coordinate of each site as a fixed effect to test for latitudinal gradients. This model accounted for the effects of sampling site and year by fitting these variables as random effects.
We explored patterns of spatial variation in Hendra virus prevalence by quantifying synchrony across the 11 sites using Pearson's cross-correlations between the time series [Reference Bjørnstad, Ims and Lambin33]. We employed a non-parametric covariance function which fits a smoothing spline to estimate the change of cross-correlations with geographical distance [Reference Bjørnstad, Ims and Lambin33]. We conducted these analyses on the ‘raw’ prevalence data and also on the first-differenced time series which allowed us to test for synchrony in the change in prevalence between successive values. Statistical inference was based on the 95th percentiles from 104 bootstraps which re-sampled site-specific time series with replacement to re-calculate cross-correlations [Reference Bjørnstad, Ims and Lambin33]. To ensure that the prediction of missing values described above did not increase the strength of the correlations between time series, we also conducted these analyses using data in which missing values were predicted without prior information. Removing priors had no effect on correlograms, so we only present the analyses conducted on time series containing predicted values.
Biotic and abiotic environmental variables
Nectar produced in Eucalyptus flowers is a primary food source for mobile populations of flying foxes, but budding and flower production depends on climatic conditions, such as temperature and precipitation, of preceding seasons [Reference Law34]. To test the effects of temperature, precipitation and bat abundance on Hendra virus pulse amplitude and timing, we used generalized mixed-effects models. For each location, we used average values of precipitation, minimum temperatures and maximum temperatures at four different times: (i) at the time of the pulse to test if immediate effects of climate explain pulse amplitude and timing; (ii) over the previous summer (December–March), (iii) over the previous spring (September–November) and (iv) over the previous winter (June–August). We used these climatic factors measured at previous times to quantify delayed effects of climate on pulse amplitude and timing. At the time of the pulse (i.e. scenario (i)), we also examined whether bat species density had an effect on the amplitude and the timing of the pulse. In each scenario, we fit either the pulse amplitude or pulse timing as response variables, with average precipitation, minimum temperature, maximum temperature and the natural log of bat density as explanatory fixed effects, and site and year of sampling as random effects. Notice that for these analyses, we only used measured prevalence data (i.e. we omitted predicted values). We used z-tests for statistical inference when modeling pulse amplitudes, and t tests when modeling pulse timings [Reference Bolker35]. Finally, because we conducted multiple comparisons on the response variables, we only consider an effect to be significant if a P-value adjustment to control for false discovery rate was <0·05 [Reference Benjamini and Hochberg36].
RESULTS
Over the 3·5 years of sampling conducted by Field et al. [Reference Field6], 4435 sheets were placed under trees within bat colonies, collecting 13 637 samples with a mean of 3·1 samples per sampling sheet (sites with adequate temporal data corresponded to 8917 samples and 2895 sheets).
Our mixed-effects model suggested that approximately 12% (highest posterior density credible interval, or HPD = 2, 22%) of the variation in Hendra virus prevalence was explained by variation across sites, 44% (HPD = 15, 54%) by variation across sampling sheets and 6% (HPD = 1·2, 66%) by among year variation. Bat abundance also had an effect on Hendra virus prevalence. We found that increasing P. alecto density by one unit on the natural log scale, increased Hendra virus prevalence by 90% (HPD = 80, 96%). By contrast, increasing the abundance of P. scapulatus by one unit on the log scale decreased Hendra virus prevalence by 16% (HPD = 11, 24%). Our results, however, failed to detect a significant effect of P. poliocephalus density on Hendra virus prevalence [Reference Field6].
We found little evidence of a long-term periodic signal in Hendra virus prevalence across the 11 sites. Wavelet analyses captured significant periodic signals over short periods (approximately 2–6 months) for most sites. At the intensively sampled Boonah roost, peaks in Hendra virus prevalence occurred with a 6-month period from Januuary 2013 to January 2014 (Fig. 2). Power spectra that suggested periodic signals over longer time frames were also found for Bellingen, Nambucca Heads and Wingham. However, in these cases, statistically significant power spectra (as described by the white contour lines within the figures) were either very localized (e.g. for Bellingen) or fell outside the cone of significance that delimits power spectrum values that are sensitive to edge effects (e.g. Nambucca Heads and Wingham). These results thus show little statistical evidence for long-term periodic signals in Hendra virus prevalence. In the online Supplementary Material (S1), we present an additional approach based on spectral decomposition to estimate periodicity with qualitatively similar results.

Fig. 2. Wavelet analyses of Hendra virus prevalence across sites. Top panels show periodicity in months as a function of time. Warmer areas show the wavelet power spectrum concentrating around the periodicities of high support. The white lines encircle areas with high confidence in the periodicity of Hendra virus prevalence. The shaded area outside the cone delimits times that may suffer from edge effects in the calculation of the wavelet power spectrum and we therefore do not interpret the results from these areas. Bottom panels show prevalence as a function of time (red dots indicate predicted values).
When we tested the hypothesis that the highest annual Hendra virus pulses occurred in winter, we found that pulse timing had a significant quadratic effect on pulse amplitude (intercept = −3·53, z-value = −4·13, P-value <0·001; linear coefficient = 0·50, z-value = 2·1, P-value = 0·036; quadratic coefficient = −0·038, z-value = –2·09, P-value = 0·037), but only when we removed one outlier datum associated with a pulse measured in Boonah in January 2012 (Fig. 3). Furthermore, the observed variability in pulse amplitudes and timings was not explained by a continuous effect of latitude (z-value = –0·31, P-value = 0·76). This result suggests that qualitative characteristics of pulses may be similar between sites, even if overall Hendra virus prevalence does differ between sites (see online Supplementary Material S2 and Field et al. [Reference Field6]).
Fig. 3. Amplitude of the highest annual pulse as a function of its timing. Hendra virus peaks are mostly clustered around 5–7 months (May–July; the austral winter) as suggested by the best fit quadratic line. However, including the point marked by the white asterix results in a non-significant relationship between peak magnitude and timing. Gray shading shows different years.
The analyses on population synchrony showed that weak synchrony in Hendra virus prevalence occurred across sites within approximately 500 km from each other. Cross-correlation coefficients fell below the mean cross-correlation (i.e. 0·18 CI 0·06–0·31) at distances greater than approximately 486 km and fell to 0 at a distance of 1000 km (Fig. 4). This result did not depend on the informative priors used during the prediction of missing values because cross-correlation analyses conducted using uninformative priors yielded identical results. By contrast, cross-correlations based on the change of Hendra virus prevalence between successive prevalence values were not significant over any distance (Fig. 4), suggesting that the autocorrelation structure within time series was partly responsible for the observed spatial synchrony [Reference Pyper and Peterman37].
Fig. 4. Synchrony of Hendra virus prevalence across sites. Top figure shows pairwise correlation coefficients between time series of Hendra virus prevalence as a function of geographical distance, whereas the bottom figure shows pairwise correlations of the change in Hendra virus prevalence. Solid line is fit from a spline regression model with 95% confidence intervals delineated by the dotted lines and obtained from a bootstraping procedure.
Our mixed-effects modeling results suggested that bat abundance and climatic variables affected pulse amplitudes and timings (Fig. 5). First, the density of P. alecto, and P. poliocephalus, but not P. scapulatus (z-value = −1·08, adjusted (adj.) P-value = 0·37) had a significant effect on pulse amplitude. We found that as the abundance of P. alecto increased, pulse amplitude also increased (slope estimate in logit scale = 0·29, z-value = 3·38, adj.P-value = 0·004; Fig. 5). By contrast, we found that the abundance of P. poliocephalus had a quadratic effect on pulse amplitude (linear slope in logit scale = 0·43, z-value = −3·4, adj.P-value = 0·0037; quadratic slope = −0·037, z-value = −3·18, P-value = 0·002). However, this result was greatly influenced by four prevalence data points occurring when the P. poliocephalus count = 0. When we removed these four data points (i.e. ensuring the analysis of prevalence data when this species was present at the site), we found a non-significant effect of P. poliocephalus density on pulse amplitudes (slope estimate in logit scale = −0·15, z-value = −1·72, P-value = 0·085).
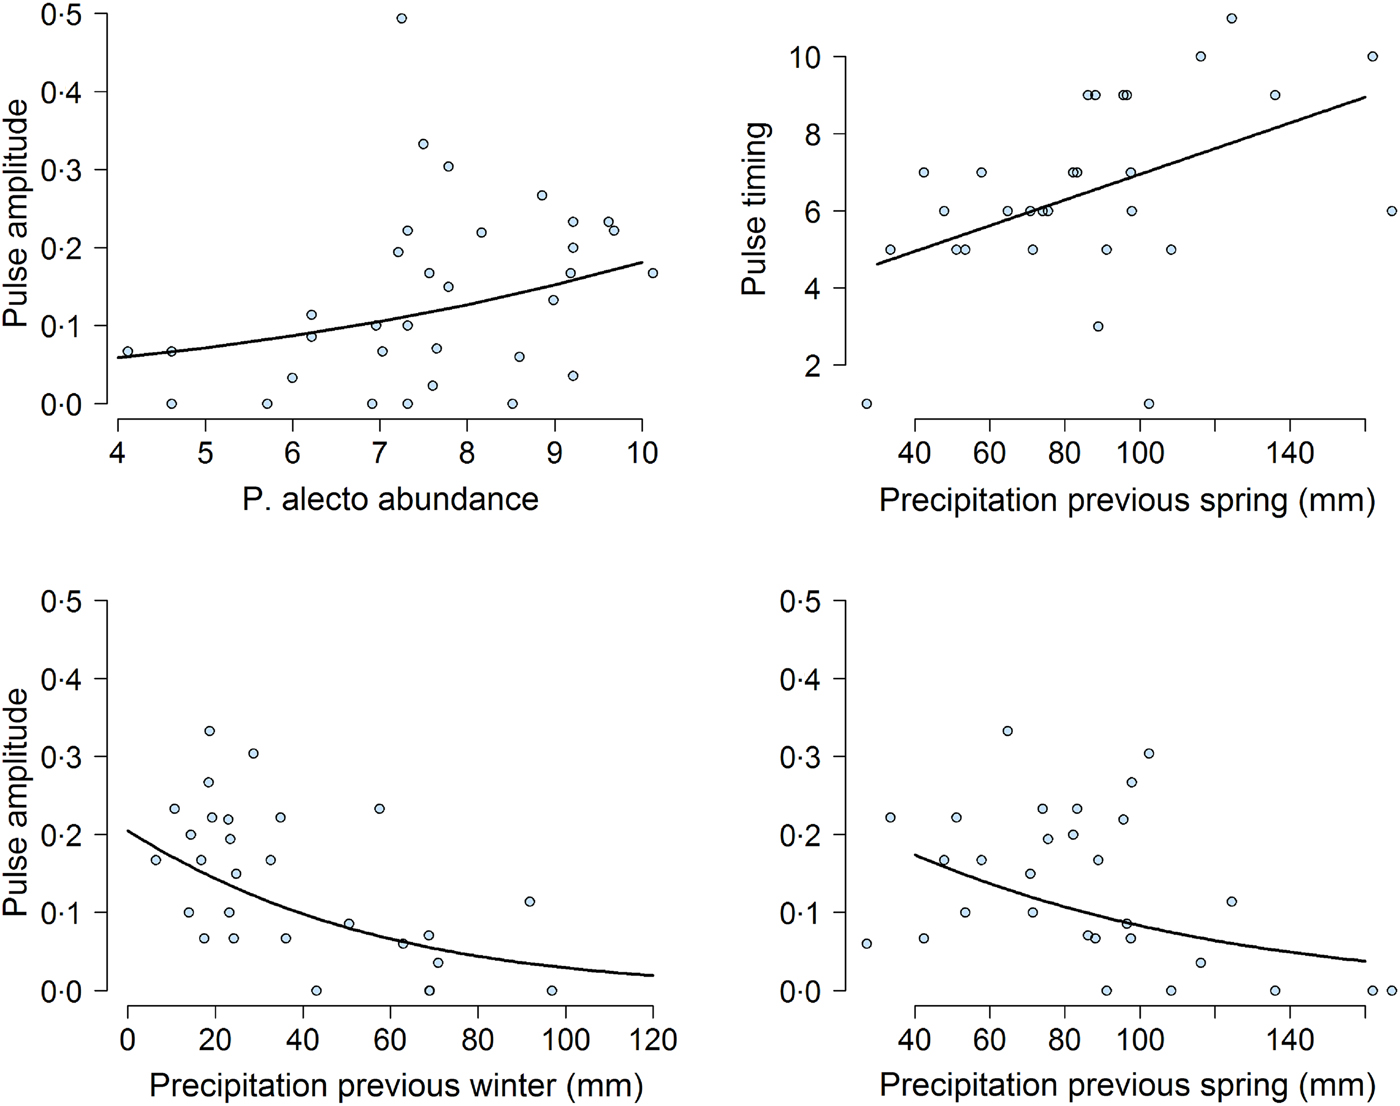
Fig. 5. Effect of climatic and biotic variables on the amplitude of the highest annual pulse of Hendra virus prevalence. Top left shows the effect of the mean natural logarithm of Pteropus alecto counts (abundance) on pulse magnitude over the month when the pulse occurred. Top right and bottom panels show the effect of previous precipitation on pulse timing and pulse amplitude. In all panels, the solid line was obtained from the model fit.
Previous climatic conditions influenced both pulse amplitude and timing. Lower precipitation during the previous spring (slope estimate in logit scale = −0·41, z-value = −2·68, adj.P-value = 0·02) and the previous winter (slope estimate on magnitude in logit scale =−0·67, z-value = 3·88, adj.P-value = 0·001), were associated with increased pulse amplitudes (Fig. 5). Furthermore, precipitation in the previous spring was positively correlated with pulse timing (slope estimate =1·0667, t-value = 2·24, P-value <0·05). Exact P-values could not be calculated for this result because of uncertainty in the calculation of degrees of freedom in mixed-effects models [Reference Bates38]. Nevertheless, these results suggested that dry winters and springs lead to increased pulse amplitudes and timings. We did not find any effects of temperature or precipitation on pulse amplitudes or timings during the previous summer or at the time of the pulse (all P-values >0·05).
DISCUSSION
Our results suggest that Hendra virus prevalence can be explained by the interaction between preceding climatic conditions and current bat density. Although the largest annual pulse amplitudes tended to be clustered around winter months, the large variation in the timing of these pulses, and the lack of a recurring seasonal signal, suggest that seasonal factors (such as birth pulses, immigration and seasonal transmission) are not alone driving Hendra virus dynamics. We therefore suggest that variation in pulse amplitudes and timings occur because of combined effects of density-driven processes principally involving P. alecto, but also by density-independent factors. Low food availability, driven by climatic conditions that affect flowering, is a potential factor that could increase transmission or viral shedding via reduced immunocompetence. Alternatively, reduced rainfall could increase transmission by increasing contact rates between individuals aggregating around suitable habitats. Our analyses also showed that Hendra virus prevalence was only weakly correlated across sites and such correlations may be explained by the autocorrelation structure within the time series. Therefore, we suggest that site-specific prevalence values are determined by the climatic conditions and bat–virus dynamics occurring at small spatial scales.
We found that an important proportion of the variation in Hendra virus prevalence was explained by variation within bat roosts (i.e. among sampling sheets), suggesting that Hendra virus shedding is likely to be heterogeneously rather than uniformly distributed across the roost. This may result from transmission, or specific patterns of clustering (i.e. species or age groups) within roosting sites. Species clustering could explain variation among sheets because Hendra virus prevalence was positively associated with P. alecto density, but negatively related to the density of P. scapulatus. It is important to note that while the protocol of collecting pooled urine excreted on sheets is logistically feasible and cost-effective, prevalence in pooled urine samples may be both clustered and overestimated if infected bats contribute to pooled urine multiple times. Nevertheless, increased P. alecto density was also associated with increased pulse amplitudes, suggesting that pulse characteristics are influenced by disease dynamics occurring in P. alecto populations. Field et al. [Reference Field6] suggested that the negative association between P. scapulatus and Hendra virus prevalence was due to the dilution of positive samples by P. scapulatus urine, because Hendra virus has not been detected in the urine of this species. An additional hypothesis is that P. scapulatus density at a site indicates an increase in food availability because the presence of this species is also associated with flower blooms and nectar production [Reference Birt39]. Increased food availability may then reduce Hendra virus shedding by improving bat condition and immunocompetence. A third possibility is that prevalence in P. alecto may be reduced by high P. scapulatus abundance through a ‘dilution effect’ where higher bat species diversity lowers infection risk. [Reference Ostfeld and Keesing40]. However, more studies are required to understand such species-specific details of Hendra virus dynamics.
The previous work of Field et al. [Reference Field6] suggested that pulses of Hendra virus prevalence occur in winter, particularly for South Eastern Queensland and North Eastern NSW. These conclusions were drawn from visual examination of fitted spline trends to the data. We have built on these results to specifically test whether high amplitude pulses are a winter-only phenomenon. We did not find statistical support for annual or seasonal periodic signals using wavelet analyses. However, we found some evidence suggesting that the highest annual Hendra virus pulses occur in winter [Reference Field6], but this result only held after we removed one outlier datum (i.e. summer in Boonah, South East Queensland), which shows that there is variation both in the amplitude and the timing of Hendra virus pulses. This suggests that, although pulses may peak in winter, they can also peak in other seasons. This conclusion is partly supported by the recent spillover of Hendra virus in late November 2016 [41], associated with an acute food shortage for bats (however, we did not have prevalence data for this spillover event). Thus, monitoring climatic conditions (such as precipitation), nectar availability and patterns of bat movement (as discussed below), may be important for predicting Hendra virus spillover events.
Specific to spatial analyses, we found low but significant levels of population synchrony in Hendra virus prevalence. The mechanisms that drive synchrony in prevalence are difficult to discern because animal movement or shared environmental conditions can synchronize disease dynamics [Reference Cattadori, Haydon and Hudson42]. Our results, however, suggested that the observed synchrony was driven by autocorrelation within time series [Reference Pyper and Peterman37], because no significant synchrony was detected in correlograms based on the difference between successive values in the time series. We therefore suggest that Hendra virus dynamics are mostly driven by the biotic and abiotic conditions at relatively small spatial scales.
The association between climatic factors (i.e. rainfall in previous seasons) and Hendra virus pulses may be explained by the influence of climate on nectar-based food production [Reference Law34, Reference Rawal43–Reference Parry-Jones and Augee45]. Previous work suggested that many of the Eucalyptus species that bats rely on over winter yield nectar according to previous rainfall and drought conditions [Reference Law34, Reference Eby44, Reference Law and Chidel46]. Moreover, for at least one bat species (P. poliocephalus), low nectar foraging intensity was associated with reduced precipitation in previous months (JR Giles et al., unpublished observations). However, rainfall patterns and the distribution of Eucalypt forests vary greatly throughout the East Coast of Australia and we do not know whether the low rainfall levels in our study translated to nectar shortages. More site-specific data are therefore needed to quantify the interactions between rainfall, nectar availability and foraging behavior in bats.
Nevertheless, when nectar availability is low, P. alecto feeds on alternative lower quality food sources, such as native and exotic fruits [Reference Markus and Hall20, Reference Parry-Jones and Augee45, Reference Eby47], potentially affecting nutritional status. Spring also coincides with the birth pulse and lactation for P. alecto, providing a potential additive source of physiological stress [Reference Edson17, Reference Plowright24, Reference Warburton, Pearl and Vonhof48]. An alternative hypothesis to the effects of weather on food availability, and subsequent physiological stress, is that food shortages may aggregate animals around scarce resources, increasing contact and transmission among bats. Further empirical work is thus required to discern between the multiple mechanisms that relate weather with Hendra virus prevalence.
A future challenge in the study of bat–Hendra virus dynamics is to determine how Eucalyptus phenology, bat movement, temperature, and nutritional status interact to affect Hendra virus prevalence and the risk of spillover. In addition to hotter and drier conditions, climate change is predicted to increase the frequency of extreme weather events such as heat waves and tropical cyclones, which have been linked to increased bat mortality and high seroprevalence, respectively [Reference Plowright24, Reference Welbergen25]. Effective management of Hendra virus will therefore require quantifying the effects of density-dependent and density-independent conditions on transmission dynamics.
SUPPLEMENTARY MATERIAL
The supplementary material for this article can be found at https://doi.org/10.1017/S0950268817002138.
ACKNOWLEDGEMENTS
The authors thank Craig Smith for comments on their results. Data was collected through the National Hendra Virus Research Program commissioned project: Hendra virus infection and transmission dynamics and is by courtesy of the State of Queensland, Australia through the Department of Agriculture and Fisheries, and the State of New South Wales through the Department of Primary Industries. AP was supported by a Queensland Government Accelerate Fellowship grant and HF received support from EcoHealth Alliance under the USAID Emerging Pandemic Threats (PREDICT) project. This research was supported by the State of Queensland, the State of New South Wales and the Commonwealth of Australia under the National Hendra Virus Research Program. Additional funding to RP was from National Institute of General Medical Sciences of the National Institutes of Health IDeA Program grants P20GM103474 and P30GM110732, Montana University System Research Initiative: 51040-MUSRI2015-03, and a Defense Advanced Research Projects Agency (DARPA) Young Faculty Award.


