


1. Introduction
When a high-intensity laser $(I>10^{18}~\text{W}~\text{cm}^{-2})$
pulse interacts with a solid target, electrons are accelerated on the front surface and travel through the target where they will be emitted from the rear surface of the target, accelerating protons and heavy ions with them (McKenna et al.
Reference McKenna, Ledingham, Yang, Robson, McCanny, Shimizu, Clarke, Neely, Spohr, Chapman, Singhal, Krushelnick, Wei and Norreys2004). The source of these electrons is the initial absorption processes that occur at the front surface. At intensities
$(I>10^{18}~\text{W}~\text{cm}^{-2})$
pulse interacts with a solid target, electrons are accelerated on the front surface and travel through the target where they will be emitted from the rear surface of the target, accelerating protons and heavy ions with them (McKenna et al.
Reference McKenna, Ledingham, Yang, Robson, McCanny, Shimizu, Clarke, Neely, Spohr, Chapman, Singhal, Krushelnick, Wei and Norreys2004). The source of these electrons is the initial absorption processes that occur at the front surface. At intensities ${\sim}10^{16}~\text{W}~\text{cm}^{-2}$
the dominant absorption processes are resonance absorption and Brunel heating (Brunel Reference Brunel1987; Wilks & Kruer Reference Wilks and Kruer1997). The latter is particularly dependent on minimal pre-plasma (scale length
${\sim}10^{16}~\text{W}~\text{cm}^{-2}$
the dominant absorption processes are resonance absorption and Brunel heating (Brunel Reference Brunel1987; Wilks & Kruer Reference Wilks and Kruer1997). The latter is particularly dependent on minimal pre-plasma (scale length $(L_{s})<$
laser wavelength (
$(L_{s})<$
laser wavelength ( ${\it\lambda}$
)). Both of these processes accelerate the electrons perpendicular to the target surface whereas for higher intensities
${\it\lambda}$
)). Both of these processes accelerate the electrons perpendicular to the target surface whereas for higher intensities $({>}10^{18}~\text{W}~\text{cm}^{-2})$
the ponderomotive force
$({>}10^{18}~\text{W}~\text{cm}^{-2})$
the ponderomotive force $(J\times B)$
acts along the laser direction where there are intensity gradients away from the peak. The dominant process has been shown to depend on the scale length of the pre-plasma: Brunel heating for shorter scale lengths and the
$(J\times B)$
acts along the laser direction where there are intensity gradients away from the peak. The dominant process has been shown to depend on the scale length of the pre-plasma: Brunel heating for shorter scale lengths and the $J\times B$
mechanism for intermediate scale lengths
$J\times B$
mechanism for intermediate scale lengths $(L_{s}\approx 5{\it\lambda})$
(Santala et al.
Reference Santala, Zepf, Watts, Beg, Clark, Tatarakis, Krushelnick, Dangor, Wilks, Machacek, Wark, Allott, Clarke and Norreys2000). Angular measurements of these absorption processes have been made (Norreys et al.
Reference Norreys, Santala, Clark, Zepf, Watts, Beg, Krushelnick, Tatarakis, Dangor, Fang, Graham, McCanny, Singhal, Ledingham, Creswell, Sanderson, Magill, Machacek, Wark, Allott, Kennedy and Neely1999) and different angular distributions have been proposed/observed due to longer pre-plasma influences on the front surface (Courtois et al.
Reference Courtois, Compant La Fontaine, Landoas, Lidove, Meot, Morel, Nuter, Lefebvre, Boscheron, Grenier, Aleonard, Gerbaux, Gobet, Hannachi, Malka, Scheurer and Tarisien2009; Pérez et al.
Reference Pérez, Kemp, Regan, Barrios, Pino, Scott, Ayers, Chen, Emig, Colvin, Bedzyk, Shoup, Agliata, Yaakobi, Marshall, Hamilton, Jaquez, Farrell, Nikroo and Fournier2014). The transport of electrons through the target is significantly influenced by the internal magnetic fields created by the electron beam and also the background resistivity (McKenna et al.
Reference McKenna, Robinson, Neely, Desjarlais, Carroll, Quinn, Yuan, Brenner, Burza, Coury, Gallegos, Gray, Lancaster, Li, Lin, Tresca and Wahlström2011; MacLellan et al.
Reference MacLellan, Carroll, Gray, Booth, Burza, Desjarlais, Du, Gonzalez-Izquierdo, Neely, Powell, Robinson, Rusby, Scott, Yuan, Wahlström and McKenna2013). The first electrons to reach the rear surface escape almost unimpeded, setting up a rear-surface sheath. The electrons reflected by the electrostatic field reflux inside the target, which increases the total emitted x-rays from the target (Myatt et al.
Reference Myatt, Theobald, Delettrez, Stoeckl, Storm, Sangster, Maximov and Short2007; Quinn et al.
Reference Quinn, Yuan, Lin, Carroll, Tresca, Gray, Coury, Li, Li, Brenner, Robinson, Neely, Zielbauer, Aurand, Fils, Kuehl and McKenna2011; Fiorini et al.
Reference Fiorini, Neely, Clarke and Green2014). This time-evolving electrostatic force grows stronger with time over the duration of the laser pulse, reducing the number and altering the spectra of the escaping electrons (Link et al.
Reference Link, Freeman, Schumacher and Van Woerkom2011). The ability to measure the entire emitted beam of electrons from the rear surface with angular and spectral distributions provides new insight into the front and rear surface field evolution processes.
$(L_{s}\approx 5{\it\lambda})$
(Santala et al.
Reference Santala, Zepf, Watts, Beg, Clark, Tatarakis, Krushelnick, Dangor, Wilks, Machacek, Wark, Allott, Clarke and Norreys2000). Angular measurements of these absorption processes have been made (Norreys et al.
Reference Norreys, Santala, Clark, Zepf, Watts, Beg, Krushelnick, Tatarakis, Dangor, Fang, Graham, McCanny, Singhal, Ledingham, Creswell, Sanderson, Magill, Machacek, Wark, Allott, Kennedy and Neely1999) and different angular distributions have been proposed/observed due to longer pre-plasma influences on the front surface (Courtois et al.
Reference Courtois, Compant La Fontaine, Landoas, Lidove, Meot, Morel, Nuter, Lefebvre, Boscheron, Grenier, Aleonard, Gerbaux, Gobet, Hannachi, Malka, Scheurer and Tarisien2009; Pérez et al.
Reference Pérez, Kemp, Regan, Barrios, Pino, Scott, Ayers, Chen, Emig, Colvin, Bedzyk, Shoup, Agliata, Yaakobi, Marshall, Hamilton, Jaquez, Farrell, Nikroo and Fournier2014). The transport of electrons through the target is significantly influenced by the internal magnetic fields created by the electron beam and also the background resistivity (McKenna et al.
Reference McKenna, Robinson, Neely, Desjarlais, Carroll, Quinn, Yuan, Brenner, Burza, Coury, Gallegos, Gray, Lancaster, Li, Lin, Tresca and Wahlström2011; MacLellan et al.
Reference MacLellan, Carroll, Gray, Booth, Burza, Desjarlais, Du, Gonzalez-Izquierdo, Neely, Powell, Robinson, Rusby, Scott, Yuan, Wahlström and McKenna2013). The first electrons to reach the rear surface escape almost unimpeded, setting up a rear-surface sheath. The electrons reflected by the electrostatic field reflux inside the target, which increases the total emitted x-rays from the target (Myatt et al.
Reference Myatt, Theobald, Delettrez, Stoeckl, Storm, Sangster, Maximov and Short2007; Quinn et al.
Reference Quinn, Yuan, Lin, Carroll, Tresca, Gray, Coury, Li, Li, Brenner, Robinson, Neely, Zielbauer, Aurand, Fils, Kuehl and McKenna2011; Fiorini et al.
Reference Fiorini, Neely, Clarke and Green2014). This time-evolving electrostatic force grows stronger with time over the duration of the laser pulse, reducing the number and altering the spectra of the escaping electrons (Link et al.
Reference Link, Freeman, Schumacher and Van Woerkom2011). The ability to measure the entire emitted beam of electrons from the rear surface with angular and spectral distributions provides new insight into the front and rear surface field evolution processes.
Many significant measurements of the angular and spectral distributions of the electrons emitted from the rear surface and bremsstrahlung from internal electrons stopping within the target have been made and reported in the past (Norreys et al. Reference Norreys, Santala, Clark, Zepf, Watts, Beg, Krushelnick, Tatarakis, Dangor, Fang, Graham, McCanny, Singhal, Ledingham, Creswell, Sanderson, Magill, Machacek, Wark, Allott, Kennedy and Neely1999; Hatchett et al. Reference Hatchett, Brown, Cowan, Henry, Johnson, Key, Koch, Langdon, Bruce, Barbara, Lee, Mackinnon, Pennington, Perry, Phillips, Roth, Sangster, Singh, Snavely, Stoyer, Wilks and Yasuike2000; Schwoerer et al. Reference Schwoerer, Gibbon, Düsterer, Behrens, Ziener, Reich and Sauerbrey2001; Edwards et al. Reference Edwards, Sinclair, Goldsack, Krushelnick, Beg, Clark, Dangor, Najmudin, Tatarakis, Walton, Zepf, Ledingham, Spencer, Norreys, Clarke, Kodama, Toyama and Tampo2002; Chen et al. Reference Chen, Kemp, Perez, Link, Beg, Chawla, Key, McLean, Morace, Ping, Sorokovikova, Stephens, Streeter, Westover and Patel2013). However, these measurements are often made at a single point as opposed to a continuous angular distribution. These techniques can be very susceptible to beam pointing or non-uniformities that may arise during the laser–plasma interaction. Measurements of the entire beam escaping the target can yield improvements in the knowledge of such interactions.
In this paper, we have used an angular wrap-around stack previously introduced by Gray et al. (Reference Gray, Yuan, Carroll, Brenner, Coury, Quinn, Tresca, Zielbauer, Aurand, Bagnoud, Fils, Kuhl, Lin, Li, Li, Roth, Neely and McKenna2011) to measure the total forward distribution of electrons escaping the target. The diagnostic is a differentially filtered cylindrical stack with the target positioned in the centre. Significant improvements in the understanding of the diagnostic sensitivity have been made using simulations of both electron and x-ray absorption and scattering to infer spectral information about the escaping electrons. The diagnostic has also been used on a laser–solid interaction experiment with the aim of measuring the escaping electron distribution.
2. Design
The wrap-around stack is a $270^{\circ }$
cylindrical diagnostic designed to provide angular information about the escaping particles/radiation from the target which is positioned at its centre, as shown in figure 1. Multiple layers of Fuji BAS-TR image plates (IP) which sit in between 0.85 mm thick Fe filtering are used to infer information on the emitted spectra. To initially ensure that the measured signal on the IP layer was primarily electrons, simulations were conducted using the ion stopping code SRIM (Ziegler, Ziegler & Biersack Reference Ziegler, Ziegler and Biersack2010) to calculate the minimum filtering required to stop any protons accelerated from the target contributing to the signal. During solid–target interaction, maximum proton energies of 30 MeV were measured with a separate diagnostic, which require the first layer of Fe filtering to be 1.7 mm thick as shown in figure 1. The filtering design, highlighted in figure 1, separates the electron signals spectrally. The diagnostic is usually positioned above or below the horizontal axis to enable other diagnostics to monitor the target simultaneously, and given the depth of 50 mm of the plates; this also provides a vertical angular distribution over
$270^{\circ }$
cylindrical diagnostic designed to provide angular information about the escaping particles/radiation from the target which is positioned at its centre, as shown in figure 1. Multiple layers of Fuji BAS-TR image plates (IP) which sit in between 0.85 mm thick Fe filtering are used to infer information on the emitted spectra. To initially ensure that the measured signal on the IP layer was primarily electrons, simulations were conducted using the ion stopping code SRIM (Ziegler, Ziegler & Biersack Reference Ziegler, Ziegler and Biersack2010) to calculate the minimum filtering required to stop any protons accelerated from the target contributing to the signal. During solid–target interaction, maximum proton energies of 30 MeV were measured with a separate diagnostic, which require the first layer of Fe filtering to be 1.7 mm thick as shown in figure 1. The filtering design, highlighted in figure 1, separates the electron signals spectrally. The diagnostic is usually positioned above or below the horizontal axis to enable other diagnostics to monitor the target simultaneously, and given the depth of 50 mm of the plates; this also provides a vertical angular distribution over ${\sim}30^{\circ }$
. The open side of the diagnostic enables the focusing laser light to reach the target.
${\sim}30^{\circ }$
. The open side of the diagnostic enables the focusing laser light to reach the target.
3. Simulations
To investigate how the differential filtered layers of IP inside the wrap-around stack respond to electrons, the Monte Carlo code Geant4 (Agostinelli et al.
Reference Agostinelli, Allison, Amako, Apostolakis, Araujo, Arce, Asai, Axen, Banerjee, Barrand, Behner, Bellagamba, Boudreau, Broglia, Brunengo, Burkhardt, Chauvie, Chuma, Chytracek, Cooperman, Cosmo, Degtyarenko, Dell’Acqua, Depaola, Dietrich, Enami, Feliciello, Ferguson, Fesefeldt, Folger, Foppiano, Forti, Garelli, Giani, Giannitrapani, Gibin, Gómez Cadenas, González, Gracia Abril, Greeniaus, Greiner, Grichine, Grossheim, Guatelli, Gumplinger, Hamatsu, Hashimoto, Hasui, Heikkinen, Howard, Ivanchenko, Johnson, Jones, Kallenbach, Kanaya, Kawabata, Kawabata, Kawaguti, Kelner, Kent, Kimura, Kodama, Kokoulin, Kossov, Kurashige, Lamanna, Lampén, Lara, Lefebure, Lei, Liendl, Lockman, Longo, Magni, Maire, Medernach, Minamimoto, Mora de Freitas, Morita, Murakami, Nagamatu, Nartallo, Nieminen, Nishimura, Ohtsubo, Okamura, O’Neale, Oohata, Paech, Perl, Pfeiffer, Pia, Ranjard, Rybin, Sadilov, Di Salvo, Santin, Sasaki, Savvas, Sawada, Scherer, Sei, Sirotenko, Smith, Starkov, Stoecker, Sulkimo, Takahata, Tanaka, Tcherniaev, Safai Tehrani, Tropeano, Truscott, Uno, Urban, Urban, Verderi, Walkden, Wander, Weber, Wellisch, Wenaus, Williams, Wright, Yamada, Yoshida and Zschiesche2003) was employed. The stack arrangement was built as shown in figure 1 and the simulations were performed using $10^{6}$
electrons, with each run using a single energy between 1 and 100 MeV. Separating the energy deposited on each layer was achieved by Geant4 providing the position and amount of energy accumulated from the simulation results. Dividing the energy in each layer of IP by the total input energy yields the fractional deposited energy in each layer. The resulting response curve of the diagnostic for mono-energetic electrons is shown in figure 2(a). Due to the heavy filtering required to stop proton contamination, the threshold energy for electrons is approximately 2 MeV.
$10^{6}$
electrons, with each run using a single energy between 1 and 100 MeV. Separating the energy deposited on each layer was achieved by Geant4 providing the position and amount of energy accumulated from the simulation results. Dividing the energy in each layer of IP by the total input energy yields the fractional deposited energy in each layer. The resulting response curve of the diagnostic for mono-energetic electrons is shown in figure 2(a). Due to the heavy filtering required to stop proton contamination, the threshold energy for electrons is approximately 2 MeV.
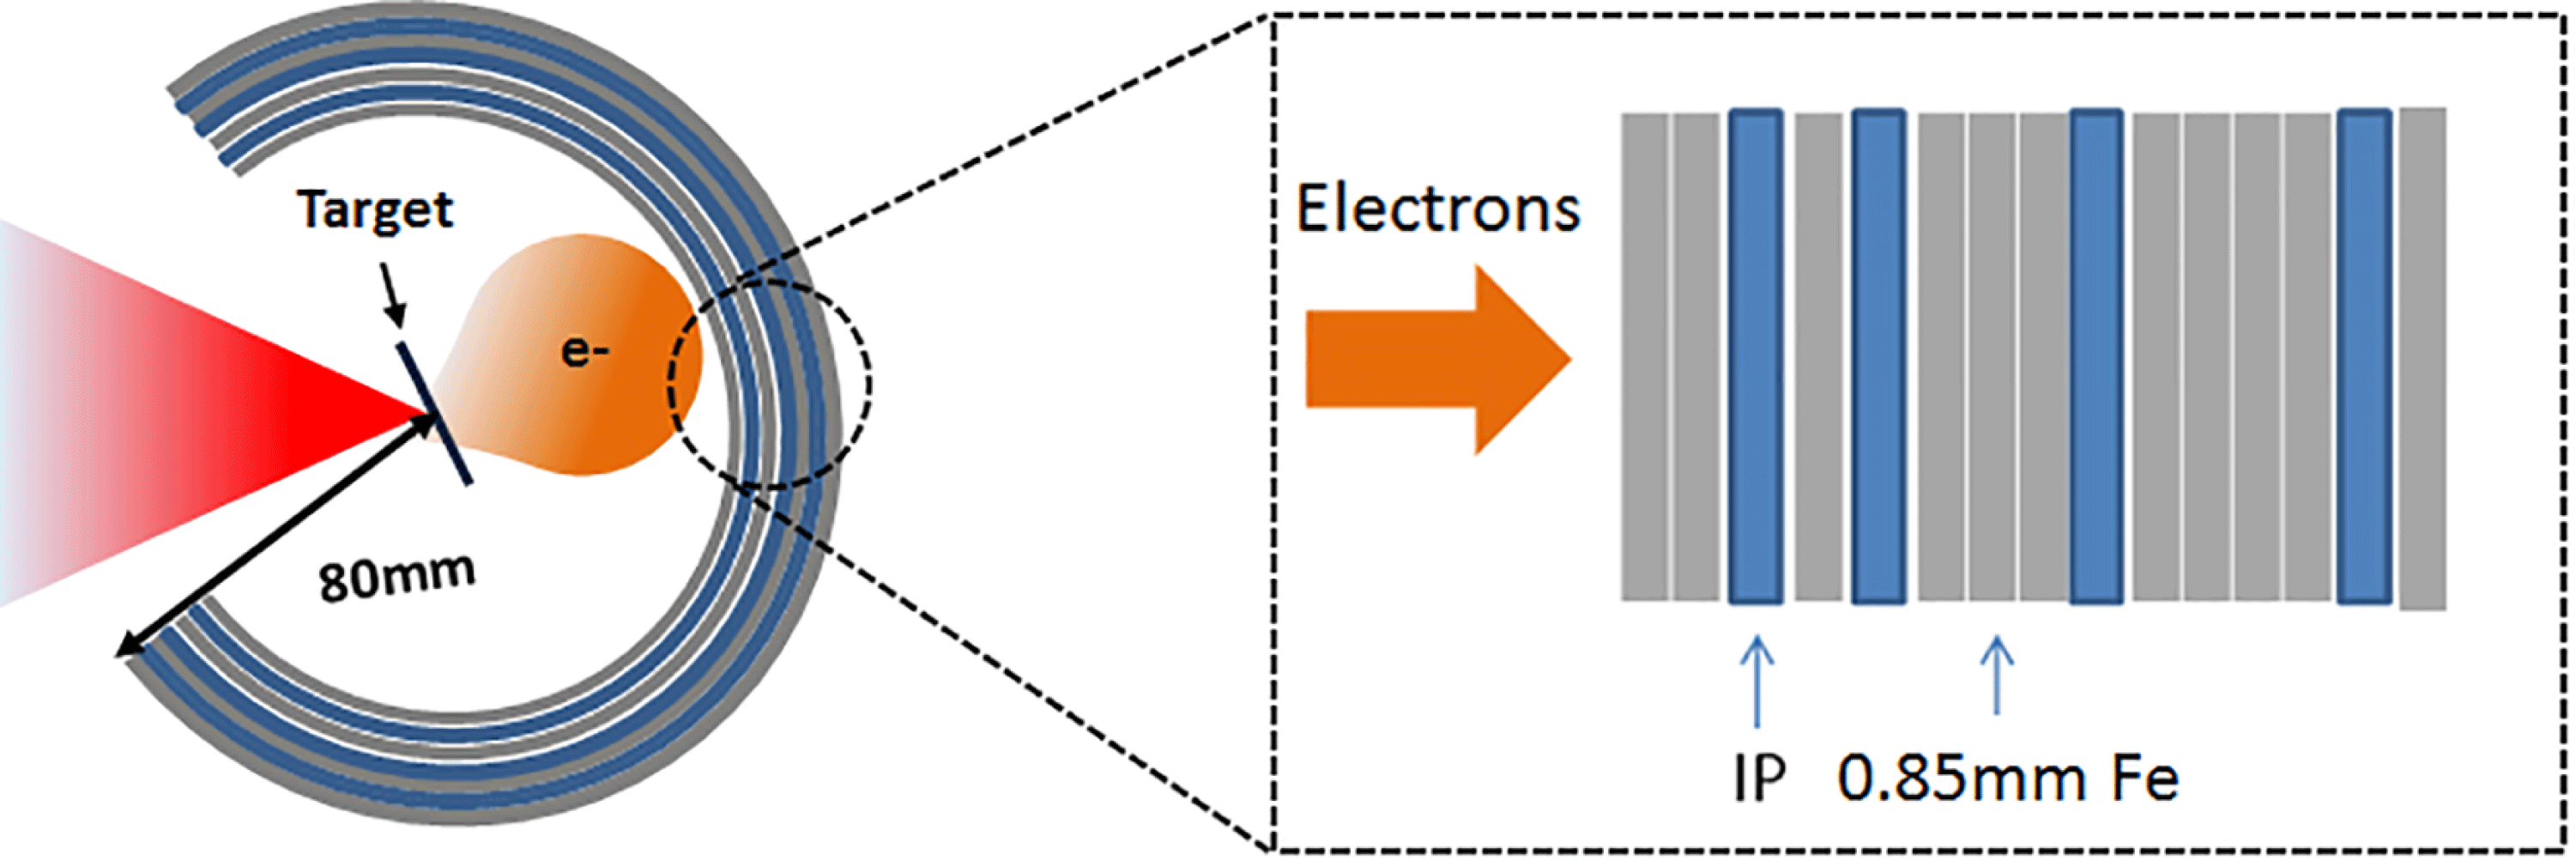
Figure 1. Schematic of the diagnostic arrangement of Fuji BAS-TR image plates (IP) between 0.85 mm Fe filters used in the wrap-around stack that covers $270^{\circ }$
around the target.
$270^{\circ }$
around the target.

Figure 2. (a) The fractional absorption in the IP layers from mono-energetic electrons incident onto the array of Fe filters as a function of energy. (b) The fractional absorption of relativistic Maxwellian electron distributions normalised to the maximum of each layer. The shaded region represents where the signal has dropped to 10 % on that layer. A temperature extraction is unreliable below this region due to the contribution of x-rays.

Figure 3. The ratios of layer 1 to each sequential layer for the total energy absorbed by the IP as a function of temperature.
An escaping relativistic Maxwellian electron distribution is assumed as the output to represent the experimental escaping electron distribution. The output from these simulations can be compared to experimental data to find the temperature of the escaped electron distribution. The normalised fractional absorbed energy from an incident relativistic Maxwellian electron distribution is show in figure 2(b).
Similar to the mono-energetic electrons shown in figure 2(a), each layer has a threshold temperature for which electrons can be detected. The areas in which the absorption is above this threshold can be considered regions in which the data from the diagnostic are reliable, or the working range of the diagnostic. This is shown by the shaded region in 2(b) where the absorption of each layer is 10 % of the maximum for that layer. Below this the signal may be dominated by x-rays. Monitoring the signal ratios between the layers provides a diagnosis of the electron temperature. The dependence of the signal ratios on the temperature is shown in figure 3. The plots are truncated at the point at which the fractional absorption of each layer has dropped to 10 %.
As well as the target being a source of protons, it will also generate many bremsstrahlung x-rays as the electrons pass through it. These x-rays will make a simultaneous contribution to the IP signal regardless of the design/arrangement of layers. To estimate the impact of the x-ray signal, electrons were sent into a thin target in Geant4 creating a bremsstrahlung spectrum. An example target of $100~{\rm\mu}\text{m}$
-thick Cu was used. The spectra and numbers of electrons and x-rays that reached the back of the target were recorded. These were both sent separately into the wrap-around stack and the absorption of energy into the IP layers was recorded, similar to the previous simulations. The total energy absorbed was found by summing the absorption for the x-rays and electrons, with the escaping electron numbers reduced to 10 % and 5 % to act as upper and lower bound for the expected escaping electron fractions (Myatt et al.
Reference Myatt, Theobald, Delettrez, Stoeckl, Storm, Sangster, Maximov and Short2007; Link et al.
Reference Link, Freeman, Schumacher and Van Woerkom2011; Fiorini et al.
Reference Fiorini, Neely, Clarke and Green2014). The electrons which reflux inside the target are not intrinsically included in Geant4. Previous studies of the influence of refluxing on x-ray emission suggest an increase of a factor of 2 (Fiorini et al.
Reference Fiorini, Neely, Clarke and Green2014) for an escaping fraction of 10 %. Including this consideration of refluxing, the signal due to x-rays makes up
$100~{\rm\mu}\text{m}$
-thick Cu was used. The spectra and numbers of electrons and x-rays that reached the back of the target were recorded. These were both sent separately into the wrap-around stack and the absorption of energy into the IP layers was recorded, similar to the previous simulations. The total energy absorbed was found by summing the absorption for the x-rays and electrons, with the escaping electron numbers reduced to 10 % and 5 % to act as upper and lower bound for the expected escaping electron fractions (Myatt et al.
Reference Myatt, Theobald, Delettrez, Stoeckl, Storm, Sangster, Maximov and Short2007; Link et al.
Reference Link, Freeman, Schumacher and Van Woerkom2011; Fiorini et al.
Reference Fiorini, Neely, Clarke and Green2014). The electrons which reflux inside the target are not intrinsically included in Geant4. Previous studies of the influence of refluxing on x-ray emission suggest an increase of a factor of 2 (Fiorini et al.
Reference Fiorini, Neely, Clarke and Green2014) for an escaping fraction of 10 %. Including this consideration of refluxing, the signal due to x-rays makes up ${<}5\,\%$
for the first two layers of the diagnostic at a temperature of 1.5 MeV; this increases to up to 20 % for the later layers. As the temperature increases the x-ray contribution decreases as more electrons are able to penetrate the deeper layers of the diagnostic. Below these temperatures, which are beyond the working range of the diagnostic, the x-ray contribution increases to values above 50 %.
${<}5\,\%$
for the first two layers of the diagnostic at a temperature of 1.5 MeV; this increases to up to 20 % for the later layers. As the temperature increases the x-ray contribution decreases as more electrons are able to penetrate the deeper layers of the diagnostic. Below these temperatures, which are beyond the working range of the diagnostic, the x-ray contribution increases to values above 50 %.
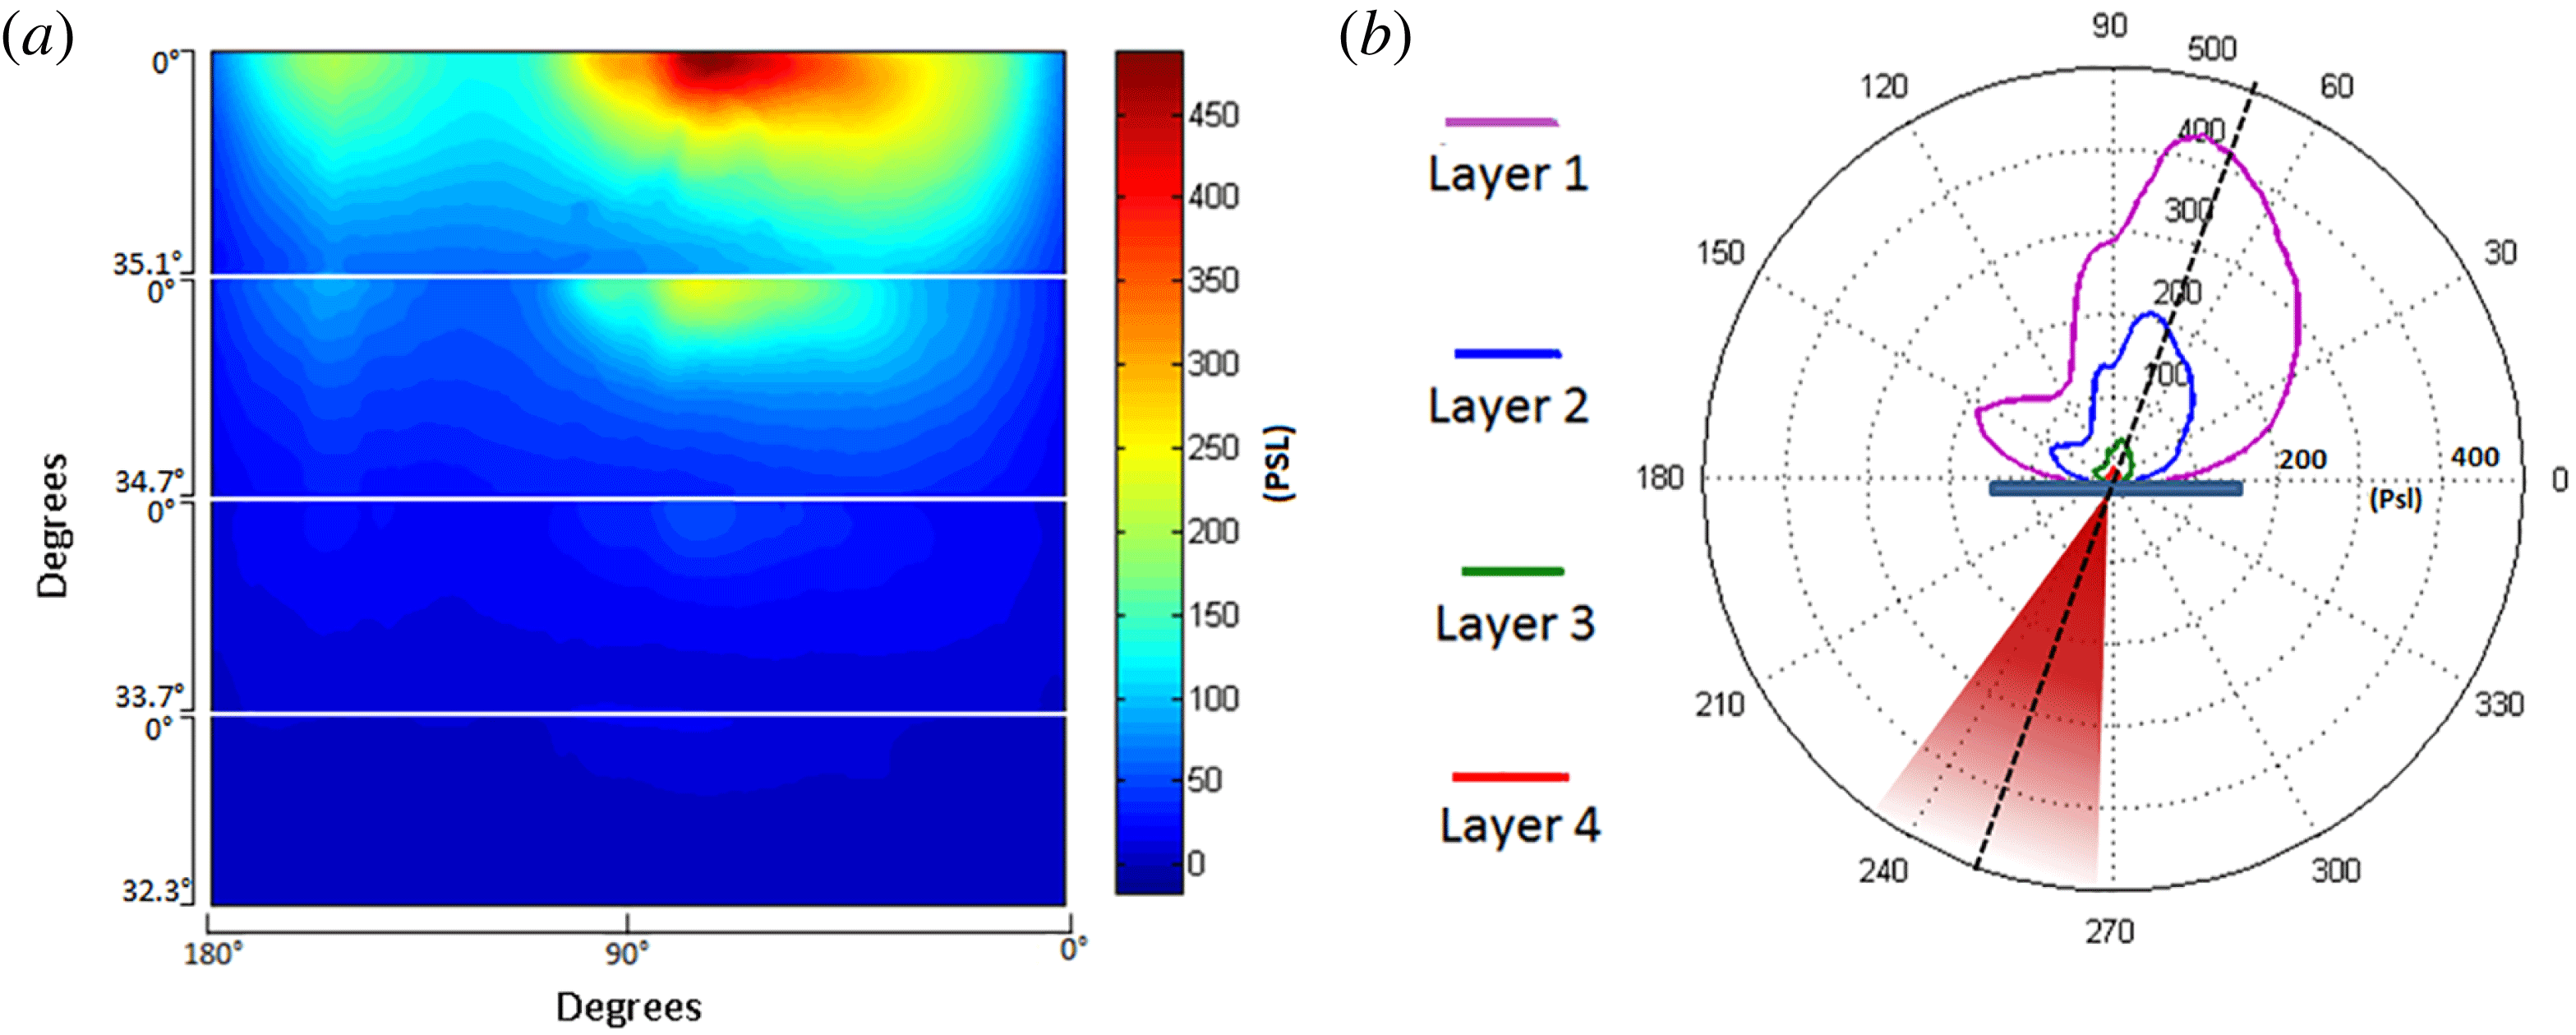
Figure 4. (a) PSL signal from the remapped layers of IP between the Fe filtering from a 140 J shot onto a $100~{\rm\mu}\text{m}$
Cu target; (b) a polar plot of the data. The peak emission appears to be close to the laser axis.
$100~{\rm\mu}\text{m}$
Cu target; (b) a polar plot of the data. The peak emission appears to be close to the laser axis.
4. Experimental data
The wrap-around stack was installed on an experiment at the PHELIX laser system at GSI in Darmstadt (Bagnoud et al.
Reference Bagnoud, Aurand, Blazevic, Borneis, Bruske, Ecker, Eisenbarth, Fils, Frank, Gaul, Goette, Haefner, Hahn, Harres, Heuck, Hochhaus, Hoffmann, Javorkov, Kluge, Kuehl, Kunzer, Kreutz, Merz-Mantwill, Neumayer, Onkels, Reemts, Rosmej, Roth, Stoehlker, Tauschwitz, Zielbauer, Zimmer and Witte2010), which is capable of delivering up to 140 J of $1~{\rm\mu}\text{m}$
radiation pulse length of
$1~{\rm\mu}\text{m}$
radiation pulse length of ${\sim}700~\text{fs}$
onto a
${\sim}700~\text{fs}$
onto a $4~{\rm\mu}\text{m}$
focal spot, achieving intensities of
$4~{\rm\mu}\text{m}$
focal spot, achieving intensities of $3.9\times 10^{20}~\text{W}~\text{cm}^{-2}$
. The contrast of the laser a nanosecond before the main pulse is approximately
$3.9\times 10^{20}~\text{W}~\text{cm}^{-2}$
. The contrast of the laser a nanosecond before the main pulse is approximately $10^{-7}$
. The S-polarized laser pulse was focused at
$10^{-7}$
. The S-polarized laser pulse was focused at $20^{\circ }$
onto a
$20^{\circ }$
onto a $100~{\rm\mu}\text{m}$
Cu target positioned in the centre of the
$100~{\rm\mu}\text{m}$
Cu target positioned in the centre of the $270^{\circ }$
wrap-around stack, with the stack positioned just below the horizontal axis to enable a line of sight to other diagnostics. The first IP subtends a larger solid angle than the sequential layers and therefore the data have been remapped to enable pixel to pixel ratio comparison. The measurements taken on the angular wrap-around stack are shown in figure 4 along with a polar plot showing the incoming laser. It is quite clear to see that the majority of the electrons are directed along the laser axis as is expected from interactions of this intensity (Malka & Miquel Reference Malka and Miquel1996; Wilks & Kruer Reference Wilks and Kruer1997).
$270^{\circ }$
wrap-around stack, with the stack positioned just below the horizontal axis to enable a line of sight to other diagnostics. The first IP subtends a larger solid angle than the sequential layers and therefore the data have been remapped to enable pixel to pixel ratio comparison. The measurements taken on the angular wrap-around stack are shown in figure 4 along with a polar plot showing the incoming laser. It is quite clear to see that the majority of the electrons are directed along the laser axis as is expected from interactions of this intensity (Malka & Miquel Reference Malka and Miquel1996; Wilks & Kruer Reference Wilks and Kruer1997).
The digitalisation process of the IP converts the dose to PSL (photo-stimulated luminescence) which is also a linear representation of the signal. Using the earlier simulations showing that only electrons above 2 MeV reach the IP layers and calibrations by Tanaka et al. (Reference Tanaka, Yabuuchi, Sato, Kodama, Kitagawa, Takahashi, Ikeda, Honda and Okuda2005), where the numbers of electrons per PSL were reported, the total number of electrons can be calculated. Summing the total PSL signal on the first layer of IP leads to the incident electron signal absorbed being ${\sim}8\times 10^{10}$
on layer 1.
${\sim}8\times 10^{10}$
on layer 1.
The signal ratio from these data can be calculated by dividing the signal in the first layer by the signal in any of the following layers pixel by pixel. An example of the ratio measured from IP layer 1 to IP layers 2 and 3 is show in figure 5, together with an angular plot of the PSL data from layers 1, 2 and 3. The upper and lower ratios obtained from each comparison are plotted with the expected ratios as a function of temperature produced from the simulations. This is shown on figure 6 with the bounds shown as horizontal lines intercepting the simulated ratios. Ratios corresponding to the escaping electron fractions of 10 % and 5 % are also shown but do not differ significantly. The overlapping shaded regions represent where data cross the 10 % ratios, which is between 1.4 and 1.7 MeV. The working range for the ratio of layers 1–4 set in § 3 puts the experimental data out of range as can be seen in figure 5.

Figure 5. Angular profiles of the data shown in figure 4 (solid lines, left-hand axis) with the ratios of layers 1–2 and 1–3 (dotted lines, right-hand axis) The ratios do not change quickly over the entire angular range. The maximum and minimum of the ratios are taken and used as upper and lower bounds in figure 6.

Figure 6. Ratios of layer 1 to each sequential layer from a relativistic electron beam passing through a $100~{\rm\mu}\text{m}$
Cu target with an upper limit of the escaping electron fraction of 10 % and a lower limit of 5 %. The data, represented by the horizontal lines, intersect the simulated ratios which are shown by the shaded regions. The overlapping area for this shaded region lies between the temperatures of 1.4 and 1.7 MeV. For the ratio 1–4, the ratio is outside the working range of the diagnostic.
$100~{\rm\mu}\text{m}$
Cu target with an upper limit of the escaping electron fraction of 10 % and a lower limit of 5 %. The data, represented by the horizontal lines, intersect the simulated ratios which are shown by the shaded regions. The overlapping area for this shaded region lies between the temperatures of 1.4 and 1.7 MeV. For the ratio 1–4, the ratio is outside the working range of the diagnostic.
For the temperatures of 1.4 and 1.7 MeV, the number of electron escaping the target can be estimated from the previously quoted total absorbed electrons by multiplying by the known absorption fraction for these temperatures from the simulations shown in figure 2(b). This yields an incident electron number of ${\sim}2.6\times 10^{13}$
. This value assumes that the escaping electrons are symmetric (above and below the horizontal axis) and as the diagnostic is positioned just below the axis it will therefore capture 50 % of the beam.
${\sim}2.6\times 10^{13}$
. This value assumes that the escaping electrons are symmetric (above and below the horizontal axis) and as the diagnostic is positioned just below the axis it will therefore capture 50 % of the beam.
Based on a single temperature distribution and the average energy of the electrons leaving the target from the previous simulations, a total escaping electron energy of ${\sim}12\pm 1~\text{J}$
is obtained. This estimation uses the assumption of a single temperature distribution; however it has been shown that the internal electrons can have a dual-temperature distribution by monitoring the x-ray spectra (Chen et al.
Reference Chen, Patel, Hey, Mackinnon, Key, Akli, Bartal, Beg, Chawla, Chen, Freeman, Higginson, Link, Ma, MacPhee, Stephens, Van Woerkom, Westover and Porkolab2009; Zulick et al.
Reference Zulick, Hou, Dollar, Maksimchuk, Nees, Thomas, Zhao and Krushelnick2013). Knowing this, future experiments using this diagnostic are planned in conjunction with simultaneous x-ray and electron spectrometer measurement which will provide a more accurate temperature diagnostic.
${\sim}12\pm 1~\text{J}$
is obtained. This estimation uses the assumption of a single temperature distribution; however it has been shown that the internal electrons can have a dual-temperature distribution by monitoring the x-ray spectra (Chen et al.
Reference Chen, Patel, Hey, Mackinnon, Key, Akli, Bartal, Beg, Chawla, Chen, Freeman, Higginson, Link, Ma, MacPhee, Stephens, Van Woerkom, Westover and Porkolab2009; Zulick et al.
Reference Zulick, Hou, Dollar, Maksimchuk, Nees, Thomas, Zhao and Krushelnick2013). Knowing this, future experiments using this diagnostic are planned in conjunction with simultaneous x-ray and electron spectrometer measurement which will provide a more accurate temperature diagnostic.
5. Conclusions
The response of a cylindrical electron diagnostic, designed to provide angular and spectral information regarding the electrons escaping from a solid target has been assessed. The first layers of filtering eliminates any proton contribution to the first layer and any sequential layers. Using Monte-Carlo simulations, the response of each IP layer of the diagnostic has been analysed for mono-energetic and relativistic Maxwellian electron distributions. Using the energy absorbed for these given electron distributions, an electron temperature where the diagnostic can be reliable has been found for each layer of IP. Experimentally the diagnostic has been used to measure half an escaping electron beam with ${\sim}2.6\times 10^{13}$
electrons with a temperature between 1.4 and 1.7 MeV from a
${\sim}2.6\times 10^{13}$
electrons with a temperature between 1.4 and 1.7 MeV from a $3.9\times 10^{20}~\text{W}~\text{cm}^{-2}$
interaction. Future experiments using this diagnostic are planned in conjunction with x-ray and electron spectrometers to generate a more complete picture of the interaction and help provide better estimates of the total energy of the escaping electrons.
$3.9\times 10^{20}~\text{W}~\text{cm}^{-2}$
interaction. Future experiments using this diagnostic are planned in conjunction with x-ray and electron spectrometers to generate a more complete picture of the interaction and help provide better estimates of the total energy of the escaping electrons.
Acknowledgements
The authors gratefully acknowledge the expert assistance of the PHELIX laser operations team and funding from EPSRC (grant nos. EP/J003832/1 and EP/K022415/1). This work has been carried out within the framework of the EUROfusion Consortium and has received funding from the EURatom research and training programme 2014–2018 (grant agreement no. 633053) and from LASERLAB-EUROPE (grant agreement no. 284464, EC’s Seventh Framework Programme). The views and opinions expressed herein do not necessarily reflect those of the European Commission. Data associated with research published in this paper is accessible at http://dx.doi.org/10.15129/f774dd94-1861-47d5-b01e-04dda4a97292.


