


Type 1 diabetes (T1D) has been defined as a chronic autoimmune disease that appears as a result of total or partial destruction of pancreatic β-cells( Reference Pugliese 1 ). About 85 % of new cases of T1D are sporadic( Reference Redondo and Eisenbarth 2 ), affecting children without a family history of the disease. The continuous worldwide rise in T1D incidence( Reference Adeghate, Schattner and Dunn 3 ) cannot be explained by genetics itself, as it has been seen that the number of subjects bearing high-risk genotypes, among recently diagnosed T1D cases, had decreased( Reference Hermann, Knip and Veijola 4 , Reference Fourlanos, Varney and Tait 5 ). Therefore, this suggests that it is the interaction between environmental and genetic factors that plays a preponderant role in T1D susceptibility( Reference Adeghate, Schattner and Dunn 3 ). In this sense, epigenetics refers to a number of mechanisms by which environmental factors modulate genetic expression through heritable modifications that do not include changes in the DNA sequence( Reference Hewagama and Richardson 6 , Reference Anderson, Sant and Dolinoy 7 ).
DNA methylation, one of these epigenetic mechanisms, is essential for gene expression regulation in mammals. This process involves the covalent addition of a methyl group (CH3) to a cytosine in a guanine–cytosine dinucleotide (CpG), from the methyl donor S-adenosylmethionine (SAM). The latter is formed in the methionine cycle after folate is reduced and transfers one methyl group to homocysteine (Hcy), a sulfur-containing amino acid( Reference Nazki, Sameer and Ganaie 8 ).
Devaraj et al.( Reference Devaraj, Glaser and Griffen 9 ) concluded that T1D corresponds to a pro-inflammatory state after they observed, in T1D patients’ monocytes, a higher production of cytokines. CD8+ and CD4+ T lymphocytes secrete pro-inflammatory cytokines such as TNF-α. It is believed that TNF-α could be implicated in pancreatic β-cell destruction because, in vitro, TNF-α, IL-1 and INF-γ have cytotoxic effects upon β-cells through the production of free radicals, nitric oxide, reactive oxygen species and the activation of apoptosis pathways( Reference Grunnet, Aikin and Tonnesen 10 , Reference Rabinovitch and Suarez-Pinzon 11 ).
The importance of epigenetic regulation in the control of TNFa gene expression, during embryonic development (human embryonic stem cell lines H9 and H1) and in response to LPS (K562, THP-1 and HL60 cell lines and isolated monocytes/macrophages)( Reference Sullivan, Reddy and Dietzmann 12 ) or to exogenous TNF-α stimulation( Reference Sharples, Polydorou and Hughes 13 ), has been demonstrated; in all those cases, induced epigenetic changes altered gene expression. Some studies have found differences in the methylation patterns of the TNFa gene promoter( Reference Campion, Milagro and Goyenechea 14 – Reference Hermsdorff, Mansego and Campion 16 ) in different chronic diseases in humans.
We recently described, in Chilean T1D patients, lower plasmatic Hcy and higher serum TNF-α concentrations. We also observed a lower status of global DNA methylation in T1D patients, which was associated with serum folate concentration but not with Hcy. We found that at high folate concentration T1D patients had a lower global DNA methylation status compared with control subjects, which indicates that the presence of the disease determined the way the patient responds to different folate concentrations( Reference Arroyo-Jousse, Garcia-Diaz and Perez-Bravo 17 ). To the authors knowledge, there are no published data about the TNFa gene promoter methylation status in T1D patients without complications, even though it is a relevant molecule in the pathogenesis of this disease. On the basis of what is stated above, we hypothesised that T1D patients had hypomethylation in the TNFa gene promoter and that this pattern was associated with Hcy, folate and TNF-α concentrations in blood. We wanted to determine the percentage of TNFa gene promoter methylation and its relationship with blood levels of TNF-α, Hcy and folates in T1D patients, in order to determine whether a distinct methylation pattern is present in T1D patients with the purpose of distinguishing a potential novel biomarker for T1D.
Methods
Study subjects
As seen in Table 1, twenty-five T1D patients were recruited from the Institute of Maternal and Child Research of the University of Chile, and from the Adult Endocrinology Service, both at the San Borja Arriarán Hospital (Santiago, Chile). A sample of twenty-five patients and twenty-five controls was chosen because it returned a statistical power of 80 % to determine differences in the variables studied with a CI of 95 %. Written informed consent was obtained from all patients (>10 years) and/or their parents or tutors (<10 years), and from all control subjects. T1D diagnosis was performed based on the ADA criteria. A total of twenty-five healthy subjects were recruited from the School of Medicine and from the Institute of Nutrition and Food Technology of the University of Chile. Control subjects did not have T1D and/or other autoimmune diseases or direct family history of these conditions. Because T1D incidence decreases in adulthood, after the age of 14 years( Reference Diaz-Valencia, Bougneres and Valleron 18 ), all control subjects were >20 years old to have the certainty that this population had the lowest probability of developing T1D.
Table 1 Characteristics of study groups (Means and standard deviations; medians and interquartile ranges)

T1D, type 1 diabetes; F, female; M, male; SN, subnutrition; NW, normal weight; EW, excess weight; OB, obesity; HbA1c, glycosylated Hb.
a,b Mean values with unlike superscript letters were significantly different between groups of at least (P<0·05).
* SN, Z-score <−2; NW, Z-score ≥−1 and ≤+1; EW, Z-score >+1; OB, Z-score >+2.
This study was conducted according to the guidelines laid down in the Declaration of Helsinki, and all procedures involving human patients were approved by the Ethical Committee of the School of Medicine of the University of Chile and by the Ethical Committee of the Central Health Service (San Borja Arriarán Hospital).
Sample collection
Samples were collected after a 12-h fast by venepuncture, and were centrifuged at 4000 rpm for 5 min, within 1 h from collection. We separated serum, plasma and whole blood with EDTA for further analyses. We measured glycosylated Hb (HbA1c) levels in the serum of T1D patients, by the ‘Tina-Quant®’ II immunoturbidimetric method( Reference Jones, Warber and Roberts 19 ) in San Borja Arriarán Hospital’s Central Laboratory, as a reference of the metabolic control in these subjects.
Homocysteine, folate and TNF-α quantification in blood
Total Hcy was quantified by an enzyme conversion immunoassay( Reference Frantzen, Faaren and Alfheim 20 ) and folates were measured using liquid chromatography with tandem MS( Reference Owens, Holstege and Clifford 21 ). Both assays were performed by an external certified laboratory (Red Lab Clinical Laboratory). TNF-α quantification was conducted by a Luminex® test kit (Human Adipokine Magnetic Bead Panel 2; EMD Millipore Corporation), as previously described( Reference Arroyo-Jousse, Garcia-Diaz and Perez-Bravo 17 ).
DNA extraction and treatment
DNA was extracted from leucocytes present in the whole blood with EDTA. The extraction was performed after sample collection, and the DNA obtained was stored refrigerated (2–4°C) according to the manufacturer’s instructions. The Wizard Genomic DNA Purification kit (Promega®) was used for this purpose.
The extracted DNA was then modified with sodium bisulfite with the methylamp DNA modification kit (Epigentek®), according to the manufacturer’s instructions. After denaturation of DNA and a 90-min incubation with sodium bisulfite, non-methylated cytosines are converted to uracil. Modified DNA was stored at −20°C, as indicated by the manufacturer.
TNFa gene expression
A subsample of both control and patient groups (n 6) was selected randomly with the purpose of studying TNFa gene expression. RNA was extracted from leucocytes present in whole blood using TRIzol® Reagent (Thermo Fisher Scientific) according to the manufacturer’s instructions. Total RNA was treated with DNAse with DNAfree kit (Ambion) and converted to first-strand complementary DNA (cDNA) with Moloney murine leukaemia virus (M-MLV) RT, utilising random hexamers (Invitrogen) and deoxynucleotide phosphate (dNTP) mix (Bioline) according to the manufacturer’s instructions. The resultant cDNA was amplified using TaqMan probes (TaqMan® Hs01113624_g1; Thermo Fisher Scientific). Real-time PCR was performed in a Stratagene M×3000’ system (Agilent Technologies) according to the manufacturer’s recommendations. The TNFa gene’s relative expression was normalised with β-actin (Applied Biosystems), selected as an internal control. Fold change between groups was calculated by the
 $$2^{{{\minus}\Delta \Delta C_{t} }} $$
method.
$$2^{{{\minus}\Delta \Delta C_{t} }} $$
method.
TNFa gene methylation assay
We then quantified the percentage of methylation in the TNFa gene promoter using specific primers for modified DNA, by real-time PCR (in a M×3000P system; Agilent Technologies). Then, we analysed the melting curves as previously described( Reference Smith, Jones and Drew 22 ). This method allows the quantification of the methylation percentage in the selected DNA fragment.
Primers were designed by using the MethPrimer web tool (http://www.urogene.org/methprimer/) for TNFa gene promoter amplification. These were designed to only recognise bisulfite-treated DNA, increasing the specificity of this technique. We obtained a 147-bp amplicon containing six CpG islands (CGI) (Fig. 1). TNF-α forward primer AGT TAGTGG TTT AGA AGA TTT TTT T and TNF-α reverse primer ATA AAC CCT ACA CCT TCT ATC TC were utilised. We used 12·5 μl of Brilliant II SYBR Green QPCR Master Mix (Stratagen; Agilent Technologies) for each sample, according to the supplier’s indications.
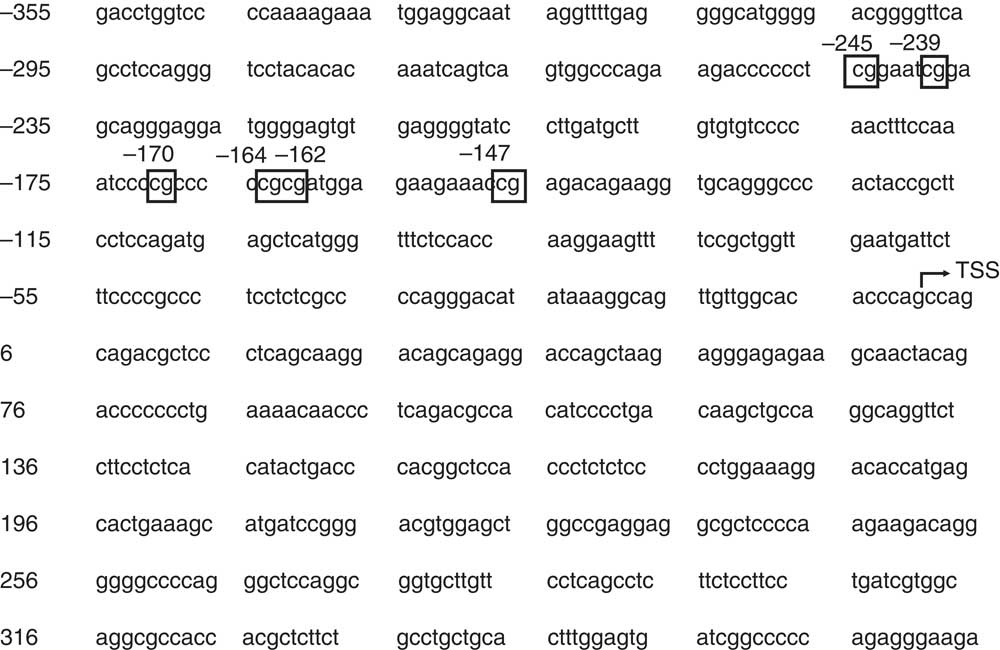
Fig. 1 TNFa gene promoter region upstream the transcription start site (TSS). Six CpG were considered in this analysis, which are numbered in the figure according to their distance to the TSS. The TSS was determined according to Economou( Reference Economou, Rhoades and Essner 30 ). Ensembl version: ENSG00000232810.
For the real-time PCR, we used 40 ng of modified DNA and we test each sample in duplicate. We conducted an initial denaturation step at 95°C for 10 min, followed by 15 s at 95°C. The annealing phase was carried out at 50°C for 15 s for forty cycles, and we conducted a final extension step at 72°C for 15 s. The melt of the PCR product was performed from 60 to 90°C, rising in 0·5°C increments, waiting 5 s at each step, and acquiring fluorescence at each temperature increment, as previously described( Reference Smith, Jones and Drew 22 ).
We performed a standard curve (Fig. 2(a) and (b)) to calculate the methylation percentage of the TNFa gene promoter, using 5' methylated DNA concentrations (0, 25, 50, 75 and 100 % methylation). For this purpose, we used a 100 % methylated control human DNA and a 100 % non-methylated control human DNA (EpiTect® PCR Control DNA; Qiagen).
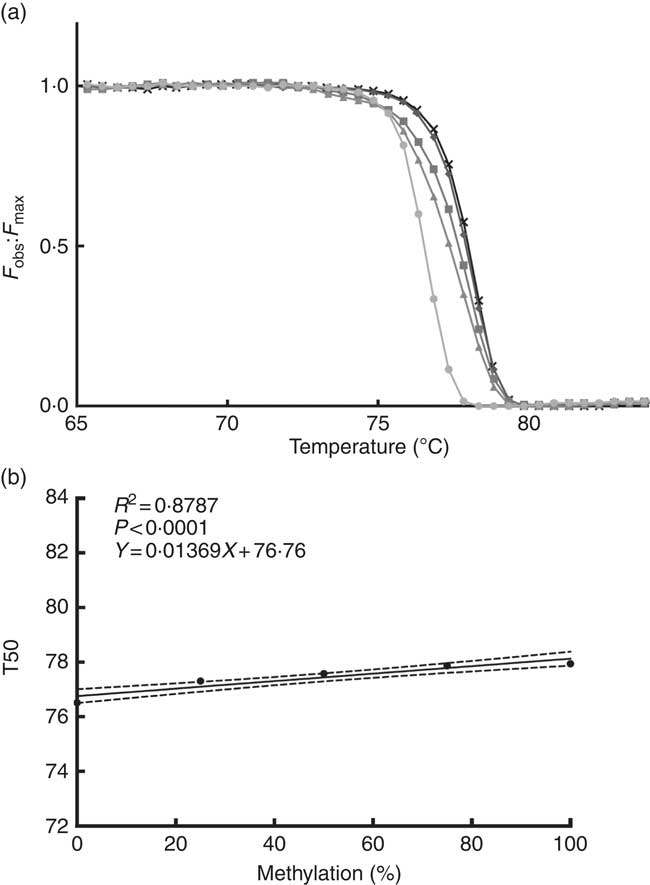
Fig. 2 Normalised fluorescence curve (a) by F
obs:F
max ratio (F
max is a theoretical fluorescence for each temperature point that could be obtained if DNA melting occurs linearly with a constant slope). From this curve, we can obtain T50 (temperature at which half of the DNA is melted and half is forming a double strand). At higher levels of DNA methylation, the normalised fluorescence curve is positioned at a higher temperature as seen in the graph. Standard curve (b) is used for interpolation of the TNFa gene promoter methylation percentage; T50 shows a positive correlation with the percentage of methylation in the sample. F
obs, observed fluorescence; F
max, maximum fluorescence; T50, temperature 50; ![]() , 0 %;
, 0 %; ![]() , 25 %;
, 25 %; ![]() , 50 %;
, 50 %; ![]() , 75 %;
, 75 %; ![]() , 100 %.
, 100 %.
Statistical analysis
We conducted a Shapiro–Wilk normality test to evaluate the variable distribution in both the T1D and the control groups. To determine statistical differences between groups, a Student’s t test was performed for parametric variables and a Mann–Whitney U test for non-parametric variables. We subdivided both groups into three subgroups according to age. (Age groups were defined by separating the sample in tertiles. Age groups in patients: <10 years (n 9), 10–15 years (n 8) and <15 years (n 8). Age groups in controls: <27 years (n 9), 28–30 years (n 8) and >30 years (n 8).) We used one-way ANOVA and Tukey’s post hoc for parametric variables and Kruskal–Wallis test and Dunn’s post hoc for non-parametric variables, to find any differences between these subgroups. To determine any association between variables, we used Pearson’s correlation test for parametric variables and Spearman’s test for non-parametric variables. Results are presented as means and standard deviations for parametric variables and as median (interquartile range) for non-parametric variables. We used a significance level of P<0·05. GraphPad Prism 6.0 software (GraphPad Software, Inc.) was used for the statistical analysis.
Results
Clinical and diagnostic characteristics
Table 1 shows the characteristics of both groups studied. Both T1D patients and control subjects had blood Hcy concentrations within the reference values (4·44–13·56 μmol/l in females and 5·46–16·20μmol/l in males) and folate concentrations within the reference values (>5·38 ng/ml). We did not find any significant difference in folate serum concentrations between groups. Hcy plasma concentrations were lower in patients than in controls. We found higher TNF-α protein concentrations in blood from T1D patients in comparison with control subjects. We did not find any differences in TNF-α protein concentrations in blood, by age or sex, in patients or controls (data not shown).
Gene expression and methylation status
Six patients and six control subjects were selected randomly to analyse the TNFa gene expression (Fig. 3). Despite the small number of subjects included in this assay, a tendency towards a higher expression in patients (median 2·047 (interquartile range 2·816)) than in controls (median 1·153 (interquartile range 1·791)) (P=0·093) is observed. This is in the same direction of what was seen with the concentration of TNF-α protein in blood. The TNFa gene promoter methylation status was higher in T1D patients (39·2 (sd 19·5) %) than in controls (25·4 (sd 13·7) %) (P=0·008) (Fig. 4(a)), and we did not find any significant difference according to age for the TNFa gene promoter methylation status in T1D patients (P=0·589) (Fig. 4(b)) or in control subjects (P=0·536).
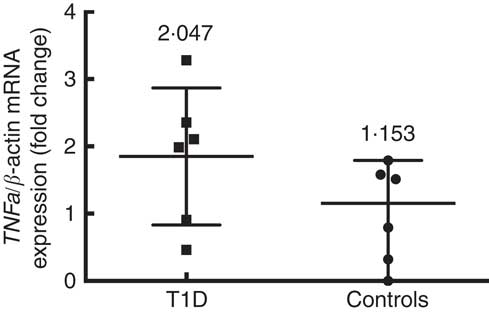
Fig. 3
TNFa gene expression in control subjects (n 6) and T1D patients (n 6). Relative TNF-a mRNA expression was calculated with the
 $$2^{{\Delta \Delta C_{t} }} $$
method and normalised with β-actin as housekeeping. Values are medians and interquartile ranges.
$$2^{{\Delta \Delta C_{t} }} $$
method and normalised with β-actin as housekeeping. Values are medians and interquartile ranges.

Fig. 4 Methylation status (a) of the TNFa gene promoter in type 1 diabetes (T1D) patients (n 22) and control subjects (n 23), and its variation according to age in T1D patients (b). (a) Values are means and standard deviations (Student’s t test). (b) Values are medians and interquartile ranges (IQR). Age groups – <10 years (n 9); 10–15 years (n 8); >15 years (n 8) (Kruskal–Wallis test and Dunn’s post hoc).
Correlations
We found that the TNFa gene promoter methylation status was positively associated with Hcy concentration in T1D patients (Fig. 5) (r 0·555, P=0·007) but not in controls (r −0·122, P=0·872).
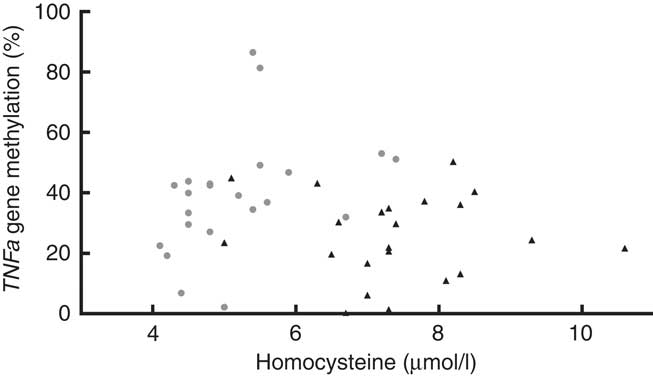
Fig. 5 Blood homocysteine and TNFa gene promoter methylation status. Positive association between homocysteine levels and TNFa gene promoter methylation (%) in type 1 diabetes (T1D) patients (![]() , TID: P 0·007, r 0·555), and no association between these parameters in control subjects (
, TID: P 0·007, r 0·555), and no association between these parameters in control subjects (![]() , P 0·872, r −0·1219, R
2 0·015). T1D: Spearman’s test; Controls: Pearson’s test.
, P 0·872, r −0·1219, R
2 0·015). T1D: Spearman’s test; Controls: Pearson’s test.
Discussion
The TNFa gene promoter does not have a CGI but has a region rich in CpG( Reference Sullivan, Reddy and Dietzmann 12 ). (According to Takai & Jones( Reference Takai and Jones 23 ) a CGI corresponds to a DNA region with >500 bp with a CG content >55 % and an observed:expected C:G ratio >65 %). A correlation has been demonstrated between the methylation statuses of genes not containing CGI at their 5' end and their mRNA, which indicates that the expression control of these genes with a low CpG density is also a subject of epigenetic regulation( Reference Eckhardt, Lewin and Cortese 24 ).
To date, there are only a few studies about TNFa gene methylation status in several conditions. Hermsdorff et al.( Reference Hermsdorff, Mansego and Campion 16 ) determined that the methylation status of 2 CpG sites in the TNFa gene promoter (numbered +217 and +327 in our sequence) was inversely correlated with TNF-α blood concentrations and with truncal fat levels in normal weight women. Kojima et al.( Reference Kojima, Kobayashi and Ito 25 ) found higher methylation rates in seven CpG motifs (numbered −303, −164, −120, −73, −50, −39 and +10 in our sequence) in Japanese Rheumatoid Arthritis, which seems to be a distinctive feature of the disease. Campion et al.( Reference Campion, Milagro and Goyenechea 14 ) found higher levels of methylation in 12 CpG (numbered −304, −245, −239, −170, −164, −162, −147, −120, −73, −50, −39 and +10 in our sequence) in the TNFa gene promoter in obese subjects who responded to a low energetic diet, in comparison with those who did not respond. They also found a positive association between total methylation level and the initial concentration of TNF-α in the study subjects. In all these studies, the authors measured each CpG methylation and correlated each status to TNF-α levels. We measured the methylation status of a region of the promoter, which includes 6 CpG (−245, −239, −170, −164, −162, −147), but we did not measure the methylation status of each CpG. We chose this region because it was considered in all the studies mentioned above, being the only ones evoked to study this epigenomic area.
On the other hand, there are only a few studies about gene-specific methylation status in T1D. There was one work on latent autoimmune diabetes in adults, which determined a higher methylation status in the Forkhead box P3 (FOXP3) gene in T CD4+ lymphocytes with a higher expression of such gene( Reference Li, Zhao and Hou 26 ). In T1D, nineteen CpG have been related with the risk of development of diabetic nephropathy, and some of them have a different methylation status relative to control subjects (T1D patients without nephropathy)( Reference Bell, Teschendorff and Rakyan 27 ). A recent study showed differences in the methylation status of 349 CpG, which represent 233 genes, including TNF-α, in patients with or without proliferative diabetic retinopathy( Reference Agardh, Lundstig and Perfilyev 28 ). The authors suggest that these epigenetic changes may be useful to predict the development of this diabetic complication.
To our knowledge, this is the first study to report the methylation status of the TNFa gene promoter in T1D patients without disease complications. Our results shows that T1D patients have higher TNF-α protein blood levels, a tendency towards higher TNFa gene expression but also higher methylation levels in the TNFa gene promoter region studied. However, we did not find any association between these parameters. The lack of association between TNFa gene promoter methylation and the expression of TNFa gene could be explained by the fact that several transcription-factor-binding sites have been identified in the TNFa gene promoter, included in the region studied here( Reference Kramer, Meichle and Hensel 29 , Reference Economou, Rhoades and Essner 30 ). The methylation status of this region could modify the binding of these transcription factors, which may reflect the variability in the regulation of the expression of this gene( Reference Comb and Goodman 31 – Reference Iguchi-Ariga and Schaffner 33 ). Although it is known that, in general terms, higher methylation is related with gene silencing, some exceptions could be encountered. It has been found that the inactive X chromosome is less methylated than the active one( Reference Weber, Davies and Wittig 34 ). Therefore, it could be difficult to predict a direct relationship between methylation status and gene expression. It is worth mentioning that besides monocytes/macrophages TNF-α is produced by several cell types including smooth and cardiac muscle cells, fibroblasts, osteoclasts and many others( Reference Zelova and Hosek 35 ). Therefore, the differences observed between the concentrations of this protein in blood, in both groups studied, could be related to the production of this cytokine by all these other cells.
Leucocytes were chosen, instead of for example β-cells, because they are easy to obtain from a blood sample (a quick and non-invasive method). In addition, in several publications it has been demonstrated that they are a good source of prediction of a disease state, because they respond to diverse metabolic and/or pathological conditions through the regulation of the expression of different genes involved in the immune( Reference Ma, Dempsey and Stamatiou 36 ) and inflammatory( Reference Wettinger, Doggen and Spek 37 ) response. Even though the epigenetic modification examined only in leucocytes could not completely explain the serum levels of TNF-α, considering that cells actively producing this cytokine could be found in tissues in addition to being in the circulation, this could be a first approach to noticing differences between T1D patients and control subjects.
By design, we included only 20-year-old healthy subjects as part of the control group. The purpose of this was to have the certainty that these subjects had the lowest probability of developing T1D, in case the difference in the methylation status of TNFa gene was present before the onset of the disease. We previously reported that global DNA methylation was modified in T1D patients and control subjects according to age( Reference Arroyo-Jousse, Garcia-Diaz and Perez-Bravo 17 ), but we did not find any significant difference according to age in the TNFa gene promoter methylation status in T1D patients or control subjects. This is in agreement with the study by Eckhardt et al.( Reference Eckhardt, Lewin and Cortese 24 ), where the authors compared the methylation percentage of 1·9 million CpG (from different tissues and cells from chromosomes 6, 20 and 22) in two age groups (26 and 68 years on average, respectively), and did not find differences between groups. This indicates that probably gene-specific methylation is less affected by age than global DNA methylation. They did find differences between the different tissues and cells studied, demonstrating that gene methylation is tissue and cell specific, which corresponds with the work of Lokk et al.( Reference Lokk, Modhukur and Rajashekar 38 ). Hence, the study of gene-specific methylation could be a better way to approach the search for biomarkers of early genetic risk. Even though Gowers et al.( Reference Gowers, Walters and Kiss-Toth 39 ) found that the methylation in TNFa gene promoter CpG sites −304, −245 and −239 decreases with age in healthy subjects, we did not observe any tendency in that direction in our study or control group, but our age range was narrower.
The association that we found between Hcy levels and TNFa gene promoter methylation status could be a consequence of the alteration in Hcy metabolism in T1D. Two independent Hcy remethylation pathways have been described so far. The first one, dependent on folate, is catalysed by the methionine synthase (MS) enzyme, which takes a methyl group from 5-methyl tetrahydrofolate. The second, independent of folate, is catalysed by the betaine-homocysteine methyltransferase (BHMT) enzyme, which takes a methyl group from betaine, a product of choline oxidation. The other pathway involved in the metabolism of Hcy is its trans-sulfuration, which results in the irreversible transformation of Hcy into cystathionine catalysed by the cystathionine-β-synthase (CBS) enzyme, and then the cystathionine is transformed into cysteine by the action of cysteine-γ-lyase (CGL)( Reference Finkelstein 40 ). There are two methyltransferases that play an important role in this process – phosphatidylethanolamine N-methyltransferase (PEMT) and glycine N-methyltransferase – both of which regulate the equilibrium between SAM and S-adenosylhomocysteine( Reference Williams and Schalinske 41 ).
Insulin levels are capable of modulating the activity of the enzymes named above, and this metabolic impairment could have an impact on gene-specific methylation status, as well as on global DNA methylation status, which agrees with several studies: Jacobs et al.( Reference Jacobs, House and Brosnan 42 ) demonstrated in T1D rats a higher activity of CBS and CGL; Nieman & Schalinske( Reference Nieman and Schalinske 43 ) found higher hepatic activity of GNMP and PEMT and a decrease in MS activity, accompanied by a lower global DNA methylation status and a negative correlation between blood glucose and Hcy, in T1D. In both experiments, these modifications were reversed by exogenous insulin administration A higher activity in the trans-sulfuration pathway was also observed in T1D humans without insulin treatment( Reference Abu-Lebdeh, Barazzoni and Meek 44 ). Williams & Schalinske( Reference Williams, Garrow and Schalinske 45 ) found higher BHMT activity and lower MS activity and global DNA methylation status in T1D rats. It is relevant to point out that, when our study was conducted, only two T1D patients had HbA1c levels under 7 %, which indicates that the majority of our patients had a poor metabolic control, which could be related to lower insulin levels and/or chronic hyperglycaemia, both having an impact on Hcy metabolism and therefore on global and specific DNA methylation patterns.
We chose the analysis of melting curves to assess the methylation of the TNFa gene promoter, because it is a quantitative and sensitive technique that can be performed in any real-time PCR equipment capable of measuring fluorescence, and is easy to implement. This is because a higher methylated DNA, after bisulfite treatment, retains more cytosines and therefore has a higher melting temperature compared with an unmethylated DNA( Reference Kurdyukov and Bullock 46 ). It has been proven that the percentage of methylation of a selected DNA region has a positive linear correlation with the temperature at which 50 % of the sample melts and 50 % forms double strands, and therefore when the fluorescence has descended to half of the initial value( Reference Smith, Jones and Drew 22 ); this enables us to create a standard curve to calculate the methylation percentage of our samples, using methylated and unmethylated DNA controls.
To our knowledge, this is the first study to report the methylation status of the TNFa gene promoter in T1D Chilean patients without complications, and to show differences relative to control healthy subjects. Considering that TNF-α is an important cytokine in the pathogenesis of T1D and its complications, it is necessary to conduct more studies to determine whether this differential methylation status is due to an alteration in Hcy metabolism because of the disease or whether it is present before the onset of this autoimmune disease, in which case it could be postulated as a possible biomarker of early risk.
Acknowledgements
The authors thank all participants for their cooperation.
This project was supported by FONDECYT grant no. 1130240.
In brief, the contribution to this article of each author is as follows: V. A.-J., experimental design, experimental procedures, data analysis, manuscript drafting and manuscript revision; D. F. G.-D., data analysis and manuscript revision; E. C., manuscript revision and F. P.-B., experimental design, data analysis, manuscript preparation and manuscript revision.
The authors declare that there are no conflicts of interest.


