


Dairy foods, defined as cow's milk and foods derived from cow's milk, contain many biologically important nutrients essential to the growth, development and health of children(1), including Ca, protein, vitamin A, riboflavin, P, K and Mg. In Western diets, dairy foods provide one of the richest sources of readily absorbable dietary Ca. Adequate Ca intake is required throughout life for normal mineralisation of bone, achievement of peak bone mass and maintenance of bone density to support the primary prevention of osteoporosis(Reference Loud and Gordon2). These are some of the reasons supporting the inclusion of the dairy food group in the Australian Dietary Guidelines for Children and Adolescents(1).
The 2007 Australian National Children's Nutrition and Physical Activity Survey (ANCNPAS) is the most recent nationally representative data on food and nutrient intakes of Australian children aged 2–16 years. The methodology and summary results from this survey have been described elsewhere(3, 4). The findings indicated that Ca was the nutrient of most concern for Australian children compared with reference requirement standards(5), particularly in the older age groups. For children aged 4–8 years 89 % met at least the estimated average requirement for Ca on the day of the survey compared with only 38 % for 14–16-year-olds. A similar pattern of declining intake has been reported for US children, with 77 % of 4–8-year-olds meeting the recommended level of Ca compared with 24 % of older adolescents (14–18 years)(Reference Nicklas, O'Neil and Fulgoni6). Shortfalls were also reported for Mg intake in Australia and the USA and for K intake in the USA – two nutrients found in significant quantities in dairy foods(3, Reference Nicklas, O'Neil and Fulgoni6). An analysis of dairy food intake in Australian children is warranted to provide insight into the dietary behaviour resulting in the Ca intake shortfall and to suggest strategies to address it.
The current paper describes dairy food consumption of Australian children and adolescents aged 2–16 years, as measured in the 2007 ANCNPAS, including the nutritional contribution dairy foods make to the total diet and the number of dairy servings consumed relative to recommendations.
Methods
Participants and dietary data collection
The present study utilises data collected as part of the 2007 ANCNPAS. The objective of that cross-sectional national survey was to assess food and nutrient intakes and physical activity patterns in a nationally representative sample of children aged 2–16 years. Measurements of weight, height and waist circumference were also taken.
The sample was randomly selected from across Australia using a quota sampling scheme stratified by state/territory and by capital city/rest of state. Random clusters of postcodes were the primary sampling unit, from which eligible households were selected using random digit dialling. Children were selected from each state or territory proportional to the stratum-specific population of children in that state or territory. The final response rate was 40 %. Complete data sets were collected from 4487 participants or their caregivers from February to August 2007. Survey methodology and sample characteristics are described in detail elsewhere(3, 4).
Trained interviewers collected dietary information using a computer-assisted, three-pass, 24 h dietary recall method, based on intake of the previous day (midnight to midnight). Dietary recall was provided by the primary caregiver for children aged 2–8 years and by the child for those aged 9–16 years. Where children were the primary source of information, the caregiver was encouraged to provide additional detail if required. Two three-pass, 24 h dietary recalls were collected: the first via a computer-assisted personal interview, followed 7–21 d later by a computer-assisted telephone interview. Representative proportions of school days and non-school days, and weekdays and weekend days, were collected across the sample. Food intake data were converted to nutrient intakes using AUSNUT 2007, a database of foods and nutrients developed specifically for 2007 ANCNPAS(7). For the present report, 1 d dietary intake data (computer-assisted personal interview) were used throughout to avoid potential issues of combining dietary intake data collected using different methods. Only 7·9 % of children consumed dietary supplements on the day of the survey(3) and thus nutrients derived from supplements were excluded from the present report.
Ethics approval for the survey was obtained from the Ethics Committees of the Commonwealth Scientific and Industrial Research Organisation and the University of South Australia, which are registered with the Australian National Health and Medical Research Council. Permission to conduct secondary analyses was obtained from the Commonwealth Department of Health and Ageing.
Dairy foods classification
The AUSNUT 2007 database categorises foods and beverages into a hierarchy of food groups. The major food group ‘Milk Products and Dishes’ (MPD) includes all dairy foods (e.g. plain and flavoured milk, yoghurt, cream (including sour cream), cheese, frozen milk products and custards) and mixed dishes where dairy foods are the major component (e.g. sweet sauces, mousse, fruche, creamed rice and cheesecake), and was the basis for these analyses. MPD were further categorised according to relative fat content as regular fat, reduced fat and skimmed. Butter was not included in MPD – it is categorised in the major food group ‘Fats and Oils’.
Definition of dairy food servings
Servings-based analyses were conducted to compare intake with government dietary recommendations(Reference Kellett, Smith and Schmerlaib8). For this purpose, dairy foods were categorised (Table 1) as ‘core dairy foods’ (cow's milk, yoghurt and hard cheese) and ‘alternate dairy sources’ (other foods with a substantial content of cow's milk or components derived from cow's milk). A further group of ‘dairy substitutes’ was defined as foods not derived from cow's milk but having a similar form. Breast milk consumption was excluded from the present analysis.
Table 1 Foods included in dairy servings analysis, including serving equivalents and portion sizes

†Equivalence to 1 serving of core dairy as outlined in the Australian Guide to Healthy Eating(Reference Kellett, Smith and Schmerlaib8) (based on Ca content), 1 serving ∼330 mg Ca.
‡Typical serving sizes determined using the FoodWorks ‘unspecified serve’. The ‘unspecified serve’ is based on intake data from the 1995 National Nutrition Survey. When unavailable the mean intake from the 2007 Australian Children's Nutrition and Physical Activity Survey was used.
§Dairy substitutes (e.g. Ca-fortified soya milk) were included in the servings analysis as the Australian Guide to Healthy Eating(Reference Kellett, Smith and Schmerlaib8) defines them as suitable milk substitutes.
The Australian Guide to Healthy Eating guidelines(Reference Kellett, Smith and Schmerlaib8) define a serving of core dairy food to be one cup (250 ml) of milk (fresh, long life or reconstituted dried milk), half a cup (125 ml) of evaporated milk, 40 g of hard cheese, 200 g of yoghurt or one cup of custard. Using FoodWorks nutrient composition software version 5 (2007; Xyris Software, Highgate Hill, Australia), a ‘core dairy’ serving was estimated to contain approximately 330 mg of Ca (range 262–435 mg) from twenty-nine core dairy foods of varying fat content.
Ca content (i.e. multiples of 330 mg of Ca) was used to estimate the number of servings of alternate dairy sources consumed from other food groups (i.e. other than MPD) to capture other significant dairy sources of Ca. These foods were typically based on a core dairy food (e.g. macaroni cheese or porridge made with milk) but not defined by the Australian Guide to Healthy Eating as a core dairy food. Alternate dairy sources were included in the estimation of servings consumed if a typical portion contained at least one-third of the Ca content of a core dairy serving (i.e. greater than 110 mg of Ca). Dairy substitutes (e.g. Ca-fortified soya milk) were included in this analysis because the Australian Guide to Healthy Eating defines them as suitable milk substitutes. Table 1 quantifies the serving equivalents used in these analyses.
Statistical analyses
Statistical analyses were performed using the SPSS for Windows statistical software package version 16·0 (SPSS Inc., Chicago, IL, USA). Descriptive statistics were used to report the proportion of all children consuming dairy food categories and the mean intake of consumers only by age, sex and dairy food group categories.
Logistic regression was used to test for differences between groups in the proportion of children consuming dairy products. The statistical significance of differences between groups for main effects (age groups and sex) and for evidence of interaction is reported.
A two-way ANOVA was used to compare mean intake of dairy food categories for consumers only across age and sex categories. Consumer-only data were used instead of all participants due to the often high frequency of non-consumers on the day of the survey, which produced skewed data and zero median values. Square-root transformations were used prior to statistical testing given the negative skew in distribution for food and nutrient intakes. Again, the statistical significance of differences between groups for main effects (age groups and sex) and for evidence of interaction is reported.
Population weights were applied for all analyses to account for the non-proportional sampling scheme of the survey. These were based on the age, gender and region distribution in the 2006 Census of Population and Housing. The population weights were rescaled to the size of the sample for inferential statistics and 95 % confidence limits of mean estimates. Statistically significant results are reported as P<0·01 and P<0·001.
Results
Dairy food intake
Table 2 shows the percentage of children who consumed MPD, by relative fat content, on the day of the survey. Overall, MPD were consumed by 84–98 % of children depending on age and sex group, and the percentage who consumed decreased with age. Regular-fat MPD were more commonly consumed by children.
Table 2 Percentage who consumed dairy products by relative fat content, presented by age and sexFootnote †

MPD, milk products and dishes.
* P ≤ 0·01, **P ≤ 0·001.
† For children aged 2–16 years using population-weighted, 1 d data from the 2007 Australian National Children's Nutrition and Physical Activity Survey. Percentages do not add to 100 % because a child may have consumed a regular-fat and reduced-fat dairy item on the day surveyed.
‡ Logistic regression was used to test for differences between groups. Age × gender interaction post hoc contrasts: I1, 2–3-year-old males v. females; I2, 4–8-year-old males v. females; I3, 9–13-year-old males v. females; I4, 14–16-year-old males v. females. Gender main effect post hoc contrasts: M, males; F, females. Age group main effect post hoc contrasts: M1, 2–3-year-olds v. 4–8-year-olds; M2, 2–3-year-olds v. 9–13-year-olds; M3, 2–3-year-olds v. 14–16-year-olds; M4, 4–8-year-olds v. 9–13-year-olds; M5, 4–8-year-olds v. 14–16-year-olds; M6, 9–13-year-olds v. 14–16-year-olds. NS, no significant post hoc comparisons.
§ The number of participants consuming this food was too small for a valid test of statistical significance. Where P values are shown, they should be considered indicative only.
Dairy milk was the most commonly consumed product among children (58–88 % of children consumed milk), followed by cheese (36–53 %) and yoghurt (12–39 %). Consumption of milk was most common in the youngest age group (87–88 %) and lowest among 14–16-year-old females (58 %). Consumption of regular-fat milk was more common than consumption of reduced-fat milk. The decrease in the percentage of children who consumed regular-fat milk with age corresponded with an increase in the percentage who consumed reduced-fat milk. Consumption of regular-fat milk and milk in general was more common in males than females, and consumption of milk was less common in the older children.
Compared with other age groups, a greater percentage of 2–3-year-old children consumed cheese (53 %) and yoghurt (36–39 %). The percentage of children who consumed these products decreased significantly with age. Similarly to milk consumption, regular-fat varieties were more commonly consumed.
Frozen milk products and flavoured milk showed different trends in consumption v. MPD in general. The percentage of children consuming frozen milk products increased with age. Consumption of frozen milk products was most common in the middle age groups (4–13 years) and lowest in the 2–3–year-old children. Overall flavoured milk consumption was not common (4–10 % of children), but an upward trend by age group was observed. Consumption ranged from 4 to 5 % in the youngest children, which was significantly lower than the percentage of 9–13-year-olds (9 %) and 14–16-year-olds (10 %) who reported consumption of flavoured milk. The consumption of custard (1–7 %) and cream (4–8 %) was not common.
Table 3 shows the mean intakes of dairy food groups for consumers only. For children who consumed dairy foods, the mean daily intake of dairy milk was higher than that of other dairy foods. Reported mean intake was highest for 14–16-year-old males (384·3 g, 95 % CI 353·6, 416·3 g) and lowest for 14–16-year-old females (243·3 g, 95 % CI 217·5, 270·7 g). A significant age group by sex interaction was observed; the significant difference between males and females was driven by the older age groups where the difference was greater.
Table 3 Mean dairy intake and 95 % confidence interval among consumers only, presented by age and sexFootnote †
MPD, milk products and dishes.
* P ≤ 0·01, **P ≤ 0·001.
† For children aged 2–16 years using population-weighted, 1 d data from the 2007 Australian National Children's Nutrition and Physical Activity Survey.
‡ Two-way ANOVA was used to test for differences in intake between groups. Age × gender interaction post hoc contrasts: I1, 2–3-year-old males v. females; I2, 4–8-year-old males v. females; I3, 9–13-year-old males v. females; I4, 14–16-year-old males v. females. Gender main effect post hoc contrasts: M, males; F, females. Age group main effect post hoc contrasts: M1, 2–3-year-olds v. 4–8-year-olds; M2, 2–3-year-olds v. 9–13-year-olds; M3, 2–3-year-olds v. 14–16-year-olds; M4, 4–8-year-olds v. 9–13-year-olds; M5, 4–8-year-olds v. 14–16-year-olds; M6, 9–13-year-olds v. 14–16-year-olds. NS, no significant post hoc comparisons.
For consumers only, the mean intakes of flavoured milk and frozen milk products increased significantly with age. For flavoured milk, 2–3-year-old children reported to consume 206–230 g compared with 390–513 g in the oldest age group. Similarly, mean intake of frozen milk products was 48–50 g at age 2–3 years compared with 109–116 g at age 14–16 years. Mean yoghurt consumption by consumers was significantly different between the 2–3-year-old and the 14–16-year-old consumers. The mean amount of cheese eaten by consumers ranged from 26 to 42 g. Male consumers had significantly greater intakes than females, and consumption by 14–16–year-olds was significantly greater than by all other age groups.
Figure 1 shows the percentage contribution of specific dairy products to children's total dairy food and total Ca intakes across the day of dietary recall. Milk was the primary source of both dairy foods and Ca in children. The contribution of milk to Ca intake peaked over the hours when breakfast would usually be taken (06.00–10.00 hours) corresponding to the peak in grams of milk consumed. Two smaller peaks in milk intake were observed corresponding to late afternoon (15.00–17.00 hours) and evening meal (18.00–21.00 hours) periods. Cheese was also an important source of Ca for children. There was a peak in the contribution of cheese to total Ca intake at lunch (12.00–14.00 hours) and a second peak at the evening meal hours (18.00–20.00 hours). Yoghurt consumption was fairly consistent across the day, while the consumption of frozen milk products had a small peak in the later evening hours (19.00–21.00 hours).
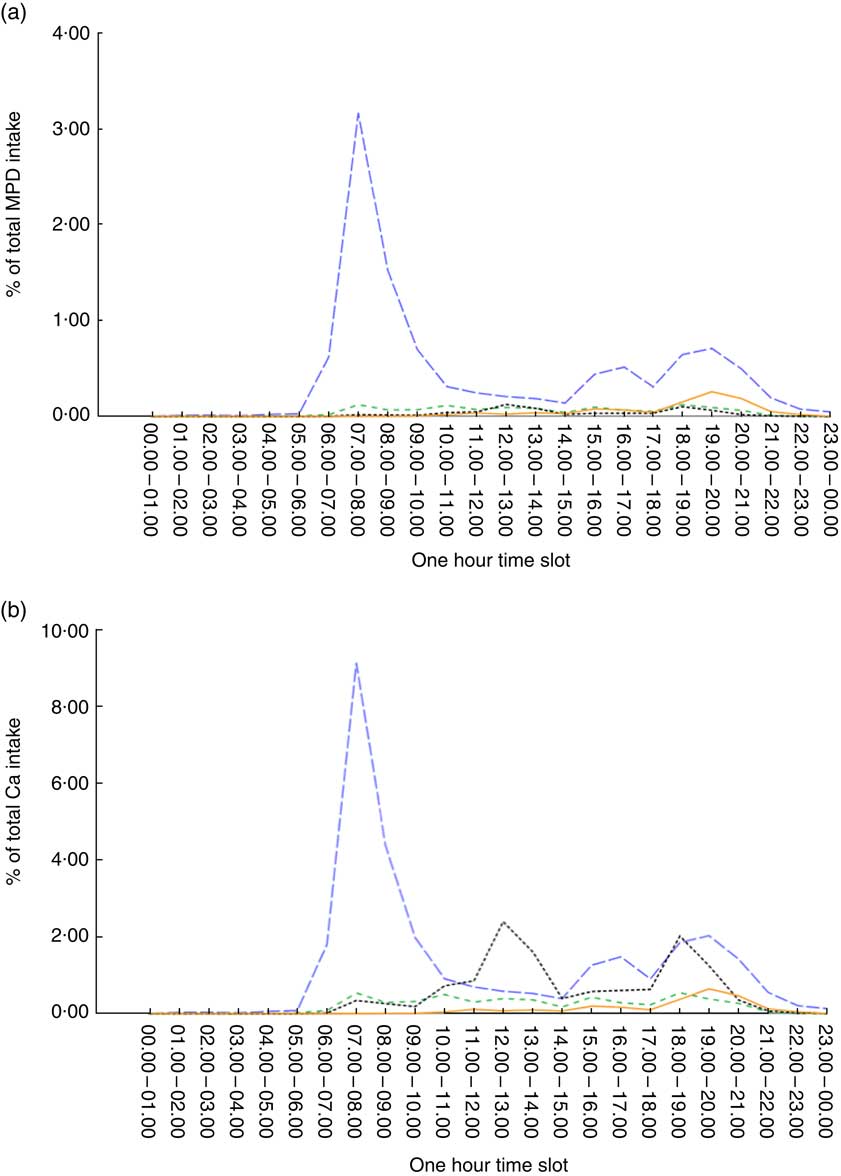
Fig. 1 (colour online) Intakes of milk (![]() ), yoghurt (
), yoghurt (![]() ), cheese (
), cheese (![]() ) and frozen milk products (
) and frozen milk products (![]() ) by time of day as a proportion of (a) total intake from milk products and dishes (MPD) based on grams and (b) total calcium intake for children aged 2–16 years using population-weighted, 1 d data from the 2007 Australian National Children's Nutrition and Physical Activity Survey
) by time of day as a proportion of (a) total intake from milk products and dishes (MPD) based on grams and (b) total calcium intake for children aged 2–16 years using population-weighted, 1 d data from the 2007 Australian National Children's Nutrition and Physical Activity Survey
Nutritional contribution of milk products and dishes to total dietary intake
The contribution of MPD to the total energy and nutrient intakes of children is shown in Table 4. There was a general decrease in the contribution of MPD to energy and nutrient intakes by age. The contribution of MPD to children's total energy intake ranged from 22 % at age 2–3 years to 10–11 % in the 14–16 years age group. The decrease with age group was observed in males and females. MPD contributed 13–29 % of total protein, 14–31 % of total fat and 20–43 % of children's total saturated fat intakes.
Table 4 Mean percentage contribution and 95 % confidence interval of total MPD consumption to intakes of energy and key nutrients, presented by age and sexFootnote †

MPD, milk products and dishes.
* P ≤ 0·01, **P ≤ 0·001.
† For children aged 2–16 years using population-weighted, 1 d data from the 2007 Australian National Children's Nutrition and Physical Activity Survey.
‡ Logistic regression was used to test for differences between groups. Age × gender interaction post hoc contrasts: I1, 2–3-year-old males v. females; I2, 4–8-year-old males v. females; I3, 9–13-year-old males v. females; I4, 14–16-year-old males v. females. Gender main effect post hoc contrasts: M, males; F, females. Age group main effect post hoc contrasts: M1, 2–3-year-olds v. 4–8-year-olds; M2, 2–3-year-olds v. 9–13-year-olds; M3, 2–3-year-olds v. 14–16-year-olds; M4, 4–8-year-olds v. 9–13-year-olds; M5, 4–8-year-olds v. 14–16-year-olds; M6, 9–13-year-olds v. 14–16-year-olds. NS, no significant post hoc comparisons.
§ Excludes discretionary salt use.
MPD contributed more than half of the total Ca, preformed vitamin A and iodine intakes for 2–3-year-old children. For all children, MPD were important sources of vitamin A (preformed, 30–56 %), riboflavin (21–41 %), P (17–37 %), iodine (30–61 %) and Ca (32–60 %). For the contribution of MPD to these key nutrients, there were significant age and gender effects for vitamin A, P and iodine; and significant age effects for riboflavin and Ca. The contribution of MPD to total dietary intake decreased with age and was higher in males than females.
Total dairy foods, core dairy foods and alternate dairy foods measured in servings
Table 5 shows the consumption (in servings/d) of total dairy foods, core dairy foods, alternate dairy foods and dairy substitutes, for all children and for consumers only. The majority of children consumed dairy products on the day of the survey (90–99 %), notably from core dairy food sources. Consumption of core dairy foods was most common in the youngest age group (96–97 %) and least common among 14–16-year-old females (79 %).
Table 5 Consumption (percentage consuming; mean intake in servings/d and 95 % confidence interval) of total MPD, core dairy foods, alternate dairy sources and dairy substitutes, presented by age and sexFootnote †

MPD, milk products and dishes.
* P ≤ 0·01, **P ≤ 0·001.
† For children aged 2–16 years using population-weighted, 1 d data from the 2007 Australian National Children's Nutrition and Physical Activity Survey.
‡ Logistic regression was used to test for differences between groups. Age × gender interaction post hoc contrasts: I1, 2–3-year-old males v. females; I2, 4–8-year-old males v. females; I3, 9–13-year-old males v. females; I4, 14–16-year-old males v. females. Gender main effect post hoc contrasts: M, males; F, females. Age group main effect post hoc contrasts: M1, 2–3-year-olds v. 4–8-year-olds; M2, 2–3-year-olds v. 9–13-year-olds; M3, 2–3-year-olds v. 14–16-year-olds; M4, 4–8-year-olds v. 9–13-year-olds; M5, 4–8-year-olds v. 14–16-year-olds; M6, 9–13-year-olds v. 14–16-year-olds. NS, no significant post hoc comparisons.
§ The small number of consumers resulted in very small per capita mean values.
Among consumers, total mean dairy food consumption ranged from 1·7 to 2·5 servings/d across the age groups. A significant age group and sex interaction was observed. Males consumed significantly more dairy than females of the same age, with the exception of 2–3-year-olds. Overall, mean intake for 2–3-year-olds was similar by sex (2·0–2·1 servings/d), with the difference observed between males and females increasing with age. This interaction was also observed for core dairy foods. For girls aged 4 years and older who consumed core dairy foods, the average intake was 1·5 servings/d for each age group, compared with boys of a similar age who consumed 1·7–2·1 servings/d. Consumption of alternate dairy sources was less prevalent among children than consumption of core dairy foods; 35–53 % of children consumed these foods, and on average they consumed ≤1 serving/d. Consumption of dairy substitutes among Australian children was less than 5 % for all age and sex groups except 2–3-year-old boys, where 5·6 % consumed from this food category on the day of the survey.
Discussion
The present paper describes the dairy food intake of Australian children aged 2 to 16 years based on dietary measurement of a large, nationally representative sample in 2007. Dairy foods are consumed by most Australian children, particularly dairy milk. Dairy foods are an important contributor to intakes of a range of nutrients for Australian children, including Ca and iodine, where there is evidence that intake is marginal in comparison to recommendations. Australian children from age 4 years do not consume the recommended amount of dairy foods and tend to consume regular-fat dairy foods rather than reduced-fat varieties. The under-consumption of a major food group by Australian children has significant implications for intakes of key nutrients and should be addressed at a number of policy levels.
Dairy food intake pattern
The majority of Australian children consumed MPD on the day of the survey, but the percentage decreased with age and was lowest in females at age 14–16 years. The most commonly consumed product was dairy milk, followed by cheese. The third most frequently consumed milk product or dish was yoghurt for the 2–3-year-olds and frozen milk products for the older age groups. The percentage of children who consumed yoghurt fell considerably with age group from more than one-third of children aged 2–3 years to less than one-sixth at 14–16 years. Most consumers of each food category consumed the regular-fat rather than a reduced-fat version of the product.
If dietary composition remained constant throughout childhood, it would be expected that the mean intake by children who consumed a particular food would increase stepwise with age group (due to greater energy requirement and greater physical capacity to eat). This was not the case for milk, which was the most commonly consumed dairy food. For cheese and yoghurt there was some evidence of an increase with age. For cheese a significant increase in mean amount consumed was seen only for the 14–16 years age group compared with each of the other age groups, and for yoghurt, the difference was seen only for the 14–16 years age group compared with the 2–3 years age group. For frozen milk products and flavoured milks, the mean daily intake by consumers did increase with each age group. The reason why the mean intake of a food would change with age is either a change in frequency of consumption or a change in the amount consumed at each eating occasion (or both). To increase the total intake of dairy foods by consumers, attention could be given to increasing both the daily occasions when dairy foods are eaten and the amount eaten on each occasion.
Small-scale interventions which focus specifically on increasing dairy food intake are largely effective, whereas those that aim to increase dairy intake within the context of other changes for a healthy diet tend to be less successful(Reference Hendrie, Brindal and Baird9). There is an absence of intervention research undertaken outside the USA and evaluation of population-level campaigns is lacking. Effective strategies to increase dairy food consumption at the same time as increasing acceptance of reduced-fat varieties would appear to be a useful area for further research. Generally making dairy products available to children increases their intake(Reference Hendrie, Brindal and Baird9). Strategies may be simple at a family level – for example for females aged 10 to 13 years in Texas, the availability of milk at home was directly related to the amount of milk consumed(Reference Sharma10) – but strategies may have to differ for individuals or communities.
The inconsistent change in intake with age for the most commonly consumed dairy foods (i.e. milk, cheese and yoghurt), in combination with a decrease in the percentage of children who consumed these products, means that the contribution of MPD to total energy intake decreased (22 % of energy at age 2–3 years compared with 10–11 % at age 14–16 years). Given the importance of dairy in a healthy diet(Reference Kellett, Smith and Schmerlaib8), this substantial decrease in dietary contribution from a core food group is of concern.
MPD provide a contribution to many nutrients that is disproportionately larger than their contribution to energy intake. Additionally, for most age groups, MPD provide more than 10 % of the total intake of niacin, folate and Mg. The contribution of MPD to the nutritional intake of Australian children is both broad and substantial. While the importance of multiple nutrients in dairy foods for bone health is well recognised(Reference Heaney11), there is some evidence that dairy food intake in childhood may also be associated with benefit for blood pressure(Reference Moore, Singer and Bradlee12) and suggestive evidence of an association with lower fat mass as children grow(Reference Moore, Bradlee and Gao13, Reference Louie, Flood and Hector14).
There is some evidence that Ca(3, Reference Gulson, Mizon and Korsch15) and iodine(Reference Hynes, Blizzard and Venn16, Reference Li, Eastman and Waite17) are ‘shortfall’ nutrients in the Australian population, or nutrients where the intake falls short of requirements. In October 2009 the addition of iodine (from iodised salt) to bread in Australia and New Zealand became mandatory, providing approximately 46 μg iodine per 100 g of bread. The mean amount of iodine provided by MPD in 2007 was somewhat greater than this (56–93 μg iodine); nevertheless, the proportion contributed to total iodine intake from dairy foods is expected to have fallen due to the additional intake from fortified bread. Also, the iodine concentration of milk is variable(Reference Li, Waite and Ma18) and may be influenced by production methods.
The contribution of MPD to saturated fat and cholesterol intakes is also disproportionately larger than their contribution to energy intake. This could be decreased if the consumption of reduced-fat dairy products increased, as recommended in dietary guidelines(Reference Kellett, Smith and Schmerlaib8, 19). However, reduced-fat dairy foods have lower vitamin A content and the implications of this would need to be considered.
Milk consumed at breakfast is important in the diet of Australian children, highlighted by the marked peak in Ca intake for the day (Fig. 1). A strategy to increase intake of reduced-fat milk in older children might focus on both increasing milk intake at breakfast time (where intake is high but breakfast is not consumed by all children) and promoting intake of milk at other meal or snack occasions(Reference Weaver20) (where fewer Australian children consume milk and therefore an opportunity exists to introduce new dietary habits).
Flavoured milk is the only dairy food examined where the percentage of children who consumed it on the day of the survey increased with age group, at the same time as the mean daily amount consumed (by consumers) doubled in boys and increased by 90 % in girls. This suggests that this dairy product is well accepted by older children, but also has substantial room for growth in prevalence of consumption. Reduced-fat flavoured milk showed an equivalent increase in prevalence of intake to regular-fat flavoured milk. Others have suggested that increased intake of dairy foods by children could be achieved in part by increased intake of unsweetened flavoured milk(Reference Johnson, Frary and Wang21, Reference Kranz, Lin and Wagstaff22).
Dairy food intake relative to Australian recommendations
The current Australian dietary recommendations(Reference Kellett, Smith and Schmerlaib8) outline a model diet containing either 2 or 3 dairy food servings/d for children aged 4–7 years and for children aged 8–11 years, depending on whether a high bread and cereal intake or a moderate bread and cereal intake is preferred. For children aged 12–18 years the recommended intake is 3 or 3–5 dairy food servings/d. After adding dairy food from all dietary sources, the mean number of dairy food servings consumed in 2007 was less than 2/d across the age groups for whom recommendations are made(Reference Kellett, Smith and Schmerlaib8) except for males aged 14–16 years where the mean number of servings consumed was 2·2/d. This confirms a shortfall of dairy foods compared with recommendations in Australia at a population level across the age group from 4 years to 16 years at least. The under-consumption is even more marked for females, where mean intake ranged from 1·4 to 1·5 servings/d.
Notably, most of the dairy foods consumed by Australian children were from core dairy foods (milk, cheese or yoghurt) included at an eating occasion rather than as mixed dishes which incorporate dairy foods. Furthermore, dairy substitutes such as soya products did not contribute substantially, due to the small proportion of children eating these foods. For children who consumed dairy substitutes, the contribution of these foods to the total food group intake was important with a mean intake among consumers of about 1 serving/d.
An Australian recommendation is that reduced-fat varieties of dairy foods be preferred from the age of 5 years(Reference Kellett, Smith and Schmerlaib8). In the present survey the relative consumption of regular-fat dairy food decreased with age, but still dominated across all age groups and dairy food types. Dairy foods contribute about one-third of children's total and saturated fat intakes, which provides the rationale for recommending reduced-fat varieties. A recent randomised controlled trial changing Australian children's dairy food intake to low-fat varieties has shown that this can be achieved in the family setting without an adverse impact on total dairy food consumption(Reference Hendrie and Golley23).
The present examination of Australian national dietary survey data finds that dairy foods are under-consumed by children aged 4–16 years. An analysis of an earlier national survey(Reference Rangan24) indicated that ‘extra’ foods (i.e. non-core foods that are considered energy dense and nutrient poor) contributed 41 % to the total energy intake of Australian children aged 2–18 years, including 47 % to total fat intake and saturated fat intake, and 54 % to total sugar intake. The dietary intake of Australian children would benefit from the displacement of ‘extra’ foods by core dairy foods, preferably reduced-fat choices.
Comparison with other countries
Data for children from the USA in 1999–2002(Reference Kranz, Lin and Wagstaff22) are similar to Australian data, in that children were suggested to under-consume dairy foods relative to recommendations after the age of 8 years and total dairy food intake did not increase with age. The mean intake of dairy foods expressed in standard servings by age group is similar for both populations; however, children in the USA consumed a lower proportion of their fluid milk as regular fat – 51 % for 2–3-year-olds and 35–43 % for 4–18-year-olds. Dairy foods continue to be an important source of many micronutrients for American children, with their consumption being associated with better overall diet quality(Reference Marshall, Gilmore and Broffitt25). In the UK for 2008–2010(26), the percentage of children who consumed milk, cheese and yoghurt was greater for the age groups 4–10 years compared with 11–18 years. Semi-skimmed milk (1·8 % fat) was the most commonly consumed milk for all children except those aged 1·5 years to 3 years. For Chilean children aged 8–13 years in 2001, the mean intake of milk and yoghurt combined was smaller at age 11–12 years compared with age 8–9 years, by 13 % for males and 20 % for females(Reference Olivares27). Mean intake of milk and yoghurt was lower in Chile than Australia for comparable age groups.
Limitations of the present study
The 2007 ANCNPAS was a cross-sectional survey and therefore differences in dietary intake between age groups do not necessarily represent changes in intake as children grow older. However, change in dietary intake with age is one likely explanation for the differences seen between age groups.
The data collection for the survey was from February to August 2007, therefore omitting spring and most of summer. If the dairy food intake of children has a large seasonal variation, the estimates of intake from the survey may be biased.
The analyses discussed here were based on a single 24 h dietary recall for each participant. This means that the percentage of any group consuming a food is described for this reference period and is likely to be less than the percentage eating that food over a longer reference period. For example, the percentage of children aged 14–16 years who eat yoghurt is about 13 % on any day, but the percentage of children of who could be said to be ‘yoghurt consumers’ is higher because the appropriate reference period is longer. However, the comparisons are internally consistent for the population of Australian children. While population distributions of food and nutrients from intake on a single day have wider variation than the distribution based on usual dietary intake, the mean estimates from a single day are a good approximation to the mean estimate from usual dietary intake.
It was noted in the initial analysis of the survey(3) that there is an increased percentage of potential dietary under-reporters in the older age groups. Using the Goldberg cut-off of 0·87 for the ratio of energy intake to BMR and a physical activity level of 1·55(Reference Black28), dietary intakes which were implausibly low to represent usual intake were identified. For the children aged 2–8 years, less than 2 % were identified to have energy intakes below the cut-off, compared with 8 % (males) and 16 % (females) among children aged 14–16 years. A low dietary intake on the day of the survey may be correctly reported, but the higher percentage below the cut-off for older females suggests a possibility of under-reporting in this group. It is noted that while the contribution of dairy foods to dietary energy is almost the same for males and females in the 14–16 years age group, the energy intake of females is substantially less and the absolute intake of dairy foods (whether measured by servings or grams) is also less for females – however the recommended intake is the same.
Conclusions
Dairy food consumption is important for Australian children, contributing a substantial percentage of daily intakes for multiple nutrients, including nutrients where intake is marginal. The mean contribution of dairy foods to total intake is greatest for the youngest children, and the contribution to total daily energy intake had halved by age 14–16 years. From this food group, milk is consumed in the greatest daily quantity, and dairy foods as an ingredient in composite foods made a relatively small contribution to total dairy food intake. Dairy food substitutes were consumed by a small proportion of children; however, the intake was important for this small group. The core dairy foods that were consumed by the greatest percentage of children (milk, cheese and yoghurt) were mostly consumed as the regular-fat variety, although the percentage consumption of reduced-fat dairy foods increased with age group.
Dairy food consumption was less than recommended from the age of 4 years. The pattern of intake outlined could be used to develop strategies to increase intake (e.g. encourage breakfast consumption, encourage flavoured milk intake, encourage reduced-fat dairy foods, integrate dairy foods into meal occasions where current intake is relatively low) and the total estimated intake by age and sex groups will be useful to measure time trends of consumption.
Acknowledgements
The analyses that formed the basis of this report were financially supported by CSIRO Food and Nutritional Sciences and Dairy Innovation Australia Limited (DIAL). The data used in this manuscript are from the ANCNPAS. The conduct of this survey was a collaborative effort between the Commonwealth Scientific Industrial Research Organisation (CSIRO) Preventative Health Flagship and the University of South Australia, with fieldwork managed by I-view Pty Ltd. The survey was jointly funded by the Australian Commonwealth Department of Health and Ageing, the Department of Agriculture, Fisheries and Forestry, and the Australian Food and Grocery Council. DIAL was not involved in the analysis or interpretation of the data or the writing of the manuscript. The authors declare no conflicts of interest. M.N. and J.B. contributed to the study design. D.L.B. and J.S. prepared the data and carried out the statistical analysis. All authors were involved in data interpretation, manuscript preparation, and read and approved the final manuscript. The authors thank Kylie Lange for her valuable statistical guidance and support.


