


INTRODUCTION
Background
Irrespective of the health care system, emergency department (ED) crowding is an international problemReference Pines, Hilton and Weber 1 - Reference Hoot and Aronsky 11 and associated with increased patient morbidity and mortality,Reference Di Somma, Paladino and Vaughan 2 , Reference Forero, McCarthy and Hillman 8 , Reference Forero, Hillman and McCarthy 9 , Reference Hoot and Aronsky 11 , Reference Kelen, Peterson and Pronovost 12 especially amongst the elderly.Reference Ackroyd-Stolarz, Read Guernsey and Mackinnon 13 Although crowding is a long-standing problem,Reference Derlet and Richards 4 there is still no common solution,Reference Morris, Boyle and Beniuk 3 , Reference Mason 14 and proposed interventions lack a robust evidence base.Reference Morris, Boyle and Beniuk 3 , Reference Innes 5 , Reference Mason 14 - Reference Wylie, Crilly and Toloo 16
The search for solutions is hampered by the absence of a common definition,Reference Morris, Boyle and Beniuk 3 , Reference McCarthy, Ding and Pines 17 the multifactorial, complex causes,Reference Pines, Hilton and Weber 1 - Reference Innes 5 , Reference Handel, Epstein and Khare 18 - Reference Schull, Slaughter and Redelmeier 20 and by publicReference Durand, Palazzolo and Tanti-Hardouin 21 and physician misperceptionReference Pitts, Pines and Handrigan 22 of crowding. The major contributing cause of crowding is access block (AB), where no hospital bed is available for patients assessed in the ED requiring admission.Reference Innes 5 , Reference Forero, McCarthy and Hillman 8 , Reference Forero, Hillman and McCarthy 9 , Reference Schull, Slaughter and Redelmeier 20 , Reference Pitts, Pines and Handrigan 22 - Reference Schiff 29 Other causes include other input, throughput, and output system factors.Reference Handel, Epstein and Khare 18 , Reference Asplin, Magid and Rhodes 19
Importance
Many jurisdictions have implemented policies with targets for emergency department length of stay (EDLOS), but if a hospital wishes to improve EDLOS it is unclear which interventions should be implemented. Knowledge transfer between hospitals and health care systems is challenging given different infrastructuresReference Morris, Boyle and Beniuk 3 , Reference Schull, Slaughter and Redelmeier 20 , Reference Kocher, Meurer and Desmond 30 and the limited evidence base supporting one intervention over another. To be evidence-based, the first step is to find the factors associated with prolonged EDLOS for the hospital.Reference Kocher, Meurer and Desmond 30 With these data, operations can focus on modifiable factors and determine solutions by a systems approach.Reference Boyle 31 - 33
Goals of this investigation
The primary objective of this study was to provide insight into factors associated with failing to meet the Ontario Ministry of Health (Ministry) EDLOS targets for high acuity patients discharged from the ED and patients admitted to the intensive care unit (ICU) from the ED. The secondary objectives were to determine the factors associated with prolonged EDLOS at the Sunnybrook Health Sciences Centre (Sunnybrook) in 2012 and to document a Plan-Do-Study-Act (PDSA) cycle for three interventions affecting ICU admissions’ EDLOS and target achievement between 2015 and 2016. We focused on discharged high acuity patients because they comprised greater than 60% of Sunnybrook’s ED patients, were sicker and consistently failed EDLOS government targets, whereas low acuity discharges succeeded. ICU admissions were targeted because this population was the fifth most consulted service, failed government targets, and had average EDLOS exceeding 12 hours associated with high mortality.Reference Chalfin, Trzeciak and Likourezos 34
METHODS
Study setting and design
This was a retrospective, single-centre, observational study. The study population was Sunnybrook emergency department patients from January 1 to December 31, 2012. Sunnybrook is an academic tertiary level hospital in Toronto, ON. Its emergency department received greater than 57,000 patients in 2012 with volumes increasing at 4% annually. By 2015, volumes were 60,685. It is a regional trauma, cancer, high risk maternal, neonatal, neurosurgical, interventional cardiology and stroke centre that serves mainly adults with 6% of patients ≤18 years old and 34% ≥65 years old. Onsite pediatric services are unavailable.
Selection of participants, methods, and measurements
Data were retrieved from four administrative databases: Electronic Patient Registry, Emergency Department Information Systems, Emergency Department Stretcher, and Hospital Occupancy Tables. These databases are necessary for patient registration and management. Emergency registration, physicians, nurses, and decision support enter data for each patient encounter. All patient visits were included, irrespective of multiple visits from the same patient at different times.
Using Stata (Version 13.1, StataCorp, College Station, TX), personnel checked administrative data for duplications, missing datapoints, and inaccurate times (e.g., negative durations or physician initial assessment duration [PIAD]>EDLOS). Erroneous duplicated entries of the same patient visit were removed. For missing and discrepant datapoints, chart reviews were performed (by IC) to find the information. If the datapoint was available through the chart, it was changed manually. If the data were still missing post chart review, they were defined as missing and excluded. All other data entries were included. Descriptive statistics were determined for selected variables.
The Canadian Triage and Acuity Scale (CTAS) recommends the ideal time for a physician to see the patient,Reference Beveridge 35 not EDLOS. However, the Ministry uses the scale to define high (CTAS 1 to 3) and low acuity (CTAS 4 to 5) patients for its Pay for Results Program. 36 Patients are grouped into the following government classifications with EDLOS targets for discharges (high and low acuity) and admissions (Table 1).
Discharged high acuity patients are discharged home with an acuity score between 1 and 3. ICU admissions are defined as hospital admissions under the ICU service.
Figure 1 outlines the durations of EDLOS, PIAD, bed request duration (BRD), and AB. AB is defined as the duration waiting for the ward bed – specifically, the duration between bed request and departure time.
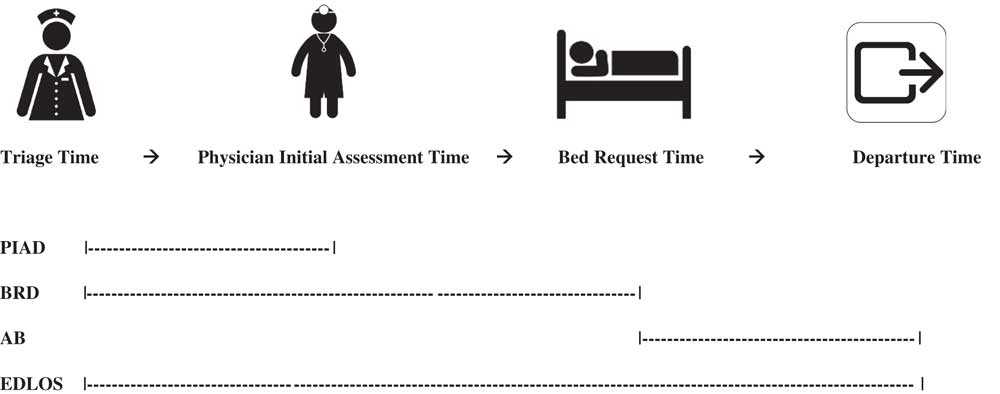
Figure 1 Durations: Physician Initial Assessment Duration (PIAD), Bed Request Duration (BRD), Access Block (AB), Emergency Department Length-of-Stay (EDLOS).
EDLOS factors were selected by literature searches, expert clinical consensus,Reference Pines, Hilton and Weber 1 , Reference Derlet and Richards 4 , Reference Forero, McCarthy and Hillman 8 , Reference Schull, Slaughter and Redelmeier 20 , Reference Schiff 29 , Reference Pitts 37 and whether they were available in emergency administrative databases. Hospital-uncontrolled factors were patient factors such as demographics, acuity, ambulance arrival, shift, weekday/weekend, and patient volume by hour or day. Hospital-controlled factors were resources such as diagnostics, hospital occupancy, consultations, and physician initial assessment time.
Outcomes
The primary outcome was predicting failure of Ministry targets for discharged high acuity patients and ICU admissions. The secondary outcome was predicting EDLOS target failure for all Sunnybrook admissions and low acuity discharges in 2012, as well as documenting a PDSA cycle outlining three interventions that affected ICU EDLOS and reaching government targets between 2015 and 2016. In 2009–2010, the ideal EDLOS objective was that 90% of the low acuity discharges, high acuity discharges, and admissions achieve their respective targets of ≤ 4, 8, and 8 hours, respectively. By 2012, the Ministry changed to a 90th percentile EDLOS value of 4, 8, and 25 hours. Both targets were used in the analyses. For the PDSA cycle run chart, ICU admission volume, mean, and 90th percentile EDLOS were monitored at monthly increments for almost 2 years, during which the interventions occurred.
Statistical analysis
Stratified by discharged high acuity, discharged low acuity and admissions, multivariable logistic regression was performed. EDLOS was made binary by its disposition category and government targets: EDLOS ≤4, 8, and 8 hours for discharged low acuity, high acuity and admissions, respectively.
Determined by a literature search, factors were examined by two-by-two tables of odds ratios with the Woolf approximation for confidence intervals. Significant factors (p<0.05) were chosen for multivariable logistic regression analyses. Models were derived by the forced entry, stepwise backwards method – keeping significant factors only (p<0.05). The model with the lowest Akaike information criterion for best fit was chosen. To control for heteroskedasticity, models were run robust. Odds ratios were provided with their 95% confidence intervals.
By varying the combination of the top three factors associated with failure of targets, a descriptive, stepwise table of mean EDLOS +/- standard deviation and 90th percentile EDLOS was created for discharged high acuity patients and ICU admissions. The run chart plotted mean EDLOS by month. All analyses and descriptive statistics were performed with Stata.
Sunnybrook Research Ethics Board granted approval.
RESULTS
Characteristics of study subjects
From January 1 to December 31, 2012, there were 57,208 emergency patient visits to Sunnybrook. Less than 1% of datapoints were missing, duplicated, or discrepant. The median age was 53 years with more female visits than male. Greater than 85% were high acuity patients (CTAS 1 to 3). The emergency department received 23% of patients by ambulance. About 5.5% of patients bypassed the emergency physician and were direct to service, such as trauma, code stroke, or admission. The proportion of low acuity (CTAS 4 to 5) discharges, high acuity (CTAS 1 to 3) discharges, and admissions was 11.5%, 62.7%, and 21.9%, respectively. Among high acuity patients, 24.7% and 71.5% were admitted and discharged, respectively. Overall consultation and admission rates were 26.5% and 22.3%, respectively. Computed tomography (CT) scans and troponins were ordered on 20.4% and 22.6% of all patients, respectively (Table 2). The PDSA cycle for ICU admissions occurred between January 2015 and October 2016. During this time, there were three changes: 1) decrease of four ICU beds (April 2015), 2) ICU residents for consultation increased to two (August 2015), and 3) increase of four ward beds for patients transitioning from ICU (March 2016).
Table 2 2012 emergency patients – demographics, acuity, resource consumption, and disposition

CT=computed tomography; CTAS=Canadian Triage and Acuity Scale; MRI=magnetic resonance imaging; US=ultrasound; XR=X-ray.
* Provides the number and percent of admissions and discharges by CTAS level (left-without-being-seen and deaths are not included).
MAIN RESULTS
Discharged high acuity patients
The factors most associated with failing to meet the 8-hour time target were having a PIAD>2 hours or undergoing one of the following in the ED: consultation, CT scan, ultrasound (US), and a magnetic resonance imaging (MRI). Factors less strongly associated with failing to meet the 8-hour target included arrival by ambulance, being direct-to-service, being seen on an evening shift, nightshift, receiving an X-ray, troponin I, increasing emergency department stretcher occupancy with admissions, increasing daily volume, and increasing age (Table 3).
Table 3 Multivariate analysis: 2012 odds ratios of failing emergency department length-of-stay time targets

The 2012 Ministry’s wait-time target for discharged high acuity patients was 90th percentile EDLOS of ≤8 hours. Sunnybrook failed the target. The proportion of high acuity discharges having PIAD>2 hours, receiving a consultation, or CT was 47.5%, 12.2%, and 16.7%, respectively. In high-acuity discharged patients where these factors were absent, all had EDLOS within the target time.
Table 4 outlines the effect of PIAD>2 hours, consultation, CT and MRI on EDLOS, and reaching government targets for discharged high acuity patients.
Table 4 Effect of high odds-ratio factors on mean and 90th percentile emergency department length-of-stay (EDLOS) for discharged high acuity Sunnybrook emergency department patients (CTAS 1-3) in 2012

CTAS=Canadian Triage and Acuity Scale; PIAD=physician initial assessment duration.
ICU admissions
Factors most associated with failure of meeting the 8-hour time target were BRD greater than 6 hours and AB greater than 1 hour. Factors weakly associated with failure were being seen on a nightshift, percentage emergency medicine stretchers occupied by admissions per day, and patient arrival per hour. Having an acuity score of 1 and having an X-ray were variables predicting target achievement (see Table 3).
The 90th percentile of EDLOS for all ICU admissions was 28.8 hours, exceeding the Ministry target of 25 hours. There were three different possibilities to be admitted to the ICU: 1) zero-consult, 2) one-consult, or 3) two-consult. The zero-consult ICU admission was from the “direct” population; because Sunnybrook is a regional trauma and stroke centre, teams led by trauma leaders or neurologists “directly” see these critically ill patients in the ED and admit them to ICU with no consultation through the ED. The one-consult ICU admission is referred to the ICU after being assessed by the emergency physician, seen by the ICU service in the ED, and possibly accepted for admission. For the two-consult ICU admission, the emergency physician initially refers the patient to a non-ICU service. The consult occurs in the ED. The service decides whether the patient is too ill for a ward bed and is referred to ICU. The second ICU consult occurs in the ED, and the patient is usually accepted for admission. Zero-, single-, and two-consultations were 20.0%, 38.4%, and 41.6% of ICU admissions, respectively.
Irrespective of the number of consultations, ICU admissions reached Ministry targets if PIAD ≤2 hours, BRD ≤ 6 hours, and AB ≤ 1 hour. Less than 12% of ICU admissions fulfilled the criteria and had a 90th percentile EDLOS of 5.8 hours.
Eleven percent of ICU admissions had all three factors. The 90th percentile EDLOS was 37.9 hours. For the two-consultation subgroup, the 90th percentile EDLOS increased to 41.5 hours.
Table 5 outlines the effect of the three high odds ratio factors for all ICU admissions and subgroups.
Table 5 Effect of high odds-ratio factors on mean and 90th percentile emergency department length-of-stay (EDLOS) for ICU admitted Sunnybrook emergency department patients in 2012

AB=access block; BRD=bed request duration; Cons=consult; PIAD=physician initial assessment duration.
Legend:
No Consult – Directs to ICU ex. Trauma
One Consult – Through Emergency Physician to ICU
Two Consult – Through Emergency Physician to Non-ICU Service and re-Consulted to ICU
All – All ICU Admissions
All ICU admissions increased between January 2015 and October 2016 (Figure 2). Figure 3 is the PDSA run chart. With the loss of four ICU beds, the mean EDLOS shifted above the median, but not the 90th percentile. With the addition of another resident for emergency department ICU consultations and the addition of four transitional ward beds, the mean and 90th percentile EDLOS trended downwards below the median. In the latter months of the cycle, the 90th percentile EDLOS began to reach the 25-hour target. As the volume increased in the later months of 2016, EDLOS began to increase.
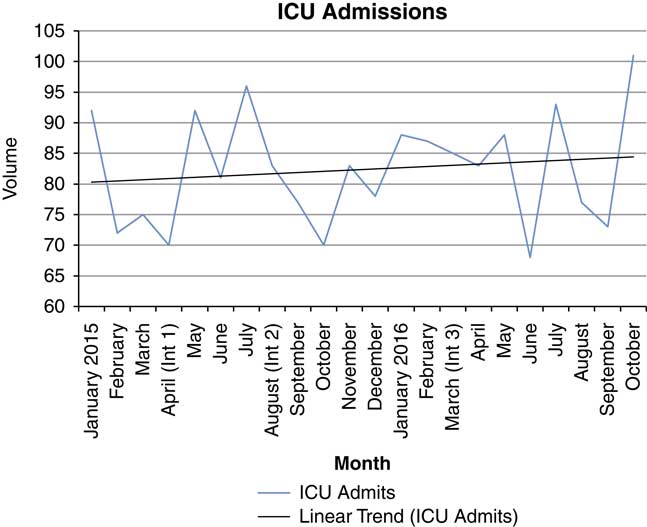
Figure 2 Volume of ICU admissions by month (January 2015 to October 2016). Int 1 (Intervention 1): Loss of 4 ICU beds; Int 2 (Intervention 2): Increase to 2 ICU residents for ED consultations; Int 3 (Intervention 3): Increase of 4 ward transitional beds for ICU transfers.
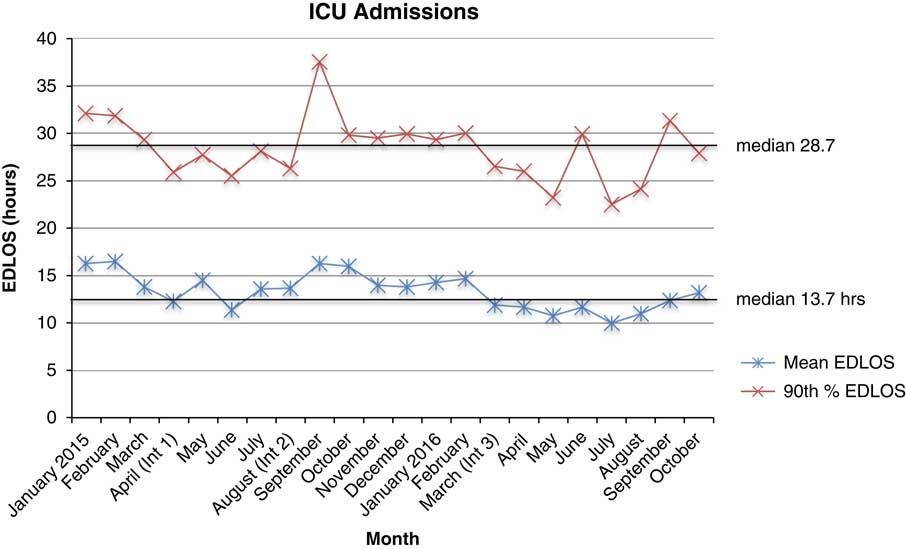
Figure 3 PDSA Cycle Run Chart: Mean and 90th% EDLOS of ICU Admits by Month. Int 1 (Intervention 1): Loss of 4 ICU beds; Int 2 (Intervention 2): Increase to 2 ICU residents for ED consultations; Int 3 (Intervention 3): Increase of 4 ward transitional beds for ICU transfers.
Discharged low acuity patients
The factors most strongly associated with failing the 4-hour time target were PIAD>2 hours, receiving a consultation, CT scan, MRI, troponin I, or US. Other factors with lower odds ratios included ambulance arrival, night shift, receiving an X-ray, increasing emergency stretcher occupancy with admitted patients, increasing patient age, additional patient arrival per hour, and weekends (see Table 3).
LIMITATIONS
This study’s strength was its large sample size with few missing datapoints; however, there were limitations. User error, such as entering wrong time values, could compromise database accuracy. A solution is to use radiofrequency identification technology, where time stamps are automatically collected during the patient’s physician encounter, departure, or admission. We deliberately focused on a single hospital to demonstrate how a hospital can analyse its own administrative databases to find tailored solutions to crowding, which consequently limited generalizability. The model did not include all factors that could affect EDLOS, such as medical student supervisionReference Gerbeaux, Ledoray and Liauthaud 38 or staffing. We did not include variables such as elective surgeryReference Rathlev, Chessare and Olshaker 39 or family physician accessReference Moineddin, Meaney and Agha 40 given that these were not modifiable by ED operations. For influential factors, comparisons with another hospital or system would provide further context. Finally, the run chart could not determine process stability.Reference Perla, Provost and Murray 41
DISCUSSION
Factors associated with prolonged EDLOS can be divided into input, throughput, output, and system factors.Reference Handel, Epstein and Khare 18 , Reference Asplin, Magid and Rhodes 19 Examples of input factors are increasing patient volumes,Reference Derlet and Richards 4 , Reference Mason 14 complexity, and acuity,Reference Derlet and Richards 4 , Reference Pitts, Pines and Handrigan 22 and higher expectations on professional health care.Reference Mason 14 Throughput factors include prolonged specialty consultation turnaround times,Reference Schull, Slaughter and Redelmeier 20 , Reference Horng, Pezzella and Tibbles 42 delays in diagnostic services,Reference Derlet and Richards 4 , Reference Schull, Slaughter and Redelmeier 20 , Reference Kanzaria, Probst and Ponce 43 increased demand for high technology,Reference Pines, Hilton and Weber 1 , Reference Pitts, Pines and Handrigan 22 diagnostic testing,Reference Forero, McCarthy and Hillman 8 , Reference Kocher, Meurer and Desmond 30 mismatched staffing to patient demand,Reference Derlet and Richards 4 variations in physician decision-making,Reference Derlet and Richards 4 , Reference Schull, Slaughter and Redelmeier 20 communication and cultural barriers with patients,Reference Derlet and Richards 4 , Reference Bekmezian, Chung and Cabana 44 and computerized order entry.Reference Derlet and Richards 4 , Reference Gray, Fernandes and Van Aarsen 45 Output factors include AB or limited access to alternate level care beds.Reference Schull, Slaughter and Redelmeier 20 Finally, in the United States, systems factors include the avoidance of an expensive admission by “intensive therapy” in the EDReference Derlet and Richards 4 , Reference Pitts, Pines and Handrigan 22 to save the hospital resources. Educational models in academic centersReference Weber 46 require patients to be seen by multi-level trainees before management is complete, resulting in increased EDLOS. Given the multitude of factors associated with prolonged EDLOS, which one should a hospital prioritize?
Factors associated with failing Ontario government EDLOS targets at Sunnybrook were determined. For high acuity discharges, factors strongly associated with failing to meet EDLOS targets were potentially modifiable at the physician/hospital-level: waiting to see an emergency physician for more than 2 hours, requesting consultations and the use of advanced diagnostic imaging (CT, MRI, US), troponin I. For ICU admissions, factors were hospital-controlled: bed request and AB duration.
These findings are concordant with previously published results from a small, retrospective chart review in 1999Reference Yoon, Steiner and Reinhardt 47 and a comprehensive 2006 – 2008 study of the American National Hospital Ambulatory Medical Care Survey (NHAMCS) by Kocher et al.Reference Kocher, Meurer and Desmond 30 However, the NHAMCS study’s limitation was the inability to generalize its results to individual hospitals because of differences that exist between them. Kocher et al. recommended that each hospital examine its patient population to determine bottlenecks for quality improvement. With this study, we have been able to incorporate multiple factors that have been outlined in the literatureReference Forster, Stiell and Wells 24 , Reference Kocher, Meurer and Desmond 30 , Reference Yoon, Steiner and Reinhardt 47 - Reference Glasser, Zacher and Thompson 50 and apply them to Sunnybrook. We deliberately chose factors that are routinely collected such that they could be readily used for Sunnybrook quality improvement initiatives.
If the hospital’s operations focus on strongly associated factors, there are evidence-informed interventions available. For example, CT and US imaging volume can be decreased by best-practice guidelines and team approach.Reference Kharbanda, Madhok and Krause 51 - Reference Suen, Hayes and Thomson 53 Eliminating oral contrast speeds up abdominal CT scans and shortens EDLOS.Reference Schuur, Chu and Sucov 54 Consultation processes and EDLOS can be shortened by a computer management system,Reference Cho, Jeong and Han 55 dedicated emergency consultation teams,Reference Suen, Hayes and Thomson 53 , Reference Qureshi, Smith and Wright 56 or by communicating daily performance metrics.Reference Horng, Pezzella and Tibbles 42 Physician-triage shortens PIAD.Reference Cheng, Lee and Mittmann 57 - Reference Abdulwahid, Booth and Kuczawski 60 In some settings, point-of-care troponin I or stat laboratory can shorten EDLOS.Reference Loten, Attia and Hullick 61 - Reference Singer, Viccellio and Thode 65 Interventions to manage AB include early hospital discharges,Reference Khanna, Boyle and Good 66 streaming,Reference Lowthian, Curtis and Straney 67 full-capacity protocols, 68 , Reference Villa-Roel, Guo and Holroyd 69 and medical assessment units.Reference Scott, Vaughan and Bell 70
It is important to understand Sunnybrook’s EDLOS in the context of its population, programs, and complexity.Reference Taylor, Dy and Foy 71 Compared to the rest of Ontario, Sunnybrook has more admissions, consultations, and CT scans. Because Sunnybrook is a regional trauma, stroke, neurosurgical, and oncology centre with an elderly patient population, more hospital resources are required to care of its complex ED population. Sunnybrook admission rate is high because of its acuity. In 2012, 87.7% of patients were CTAS 1 to 3 with 4.6% being CTAS 1. In comparison, 58.4% of all Ontario ED visits were CTAS 1 to 3, and 0.7% was CTAS 1. 72 Sunnybrook’s admission rate was 22%, which was three times greater than Ontario’s rate of 7.0%. 72
In 2012, the Ontario CT rate was 5.9%,Reference Berdahl, Vermeulen and Larson 73 whereas Sunnybrook’s was 20%. CTs have become an essential diagnostic tool to provide quality patient care.Reference Pandharipande, Reisner and Binder 74 Between 1996 and 2007, American CT use in EDs had increased by 330%Reference Kocher, Meurer and Fazel 75 and associated with a decrease in admissions. As discussed earlier, a hospital can save money by providing “intensive therapy” and diagnostics in the emergency departmentReference Derlet and Richards 4 , Reference Pitts, Pines and Handrigan 22 to avoid admissions. Consequently, to stop ordering CT scans in the ED may be an intervention with unintended consequences. Such a policy could increase the number of avoidable admissions or discharge patients with incorrect diagnosis, leading to increased morbidity or mortality. This is not to say that the increasing diagnostic demand should not be examined. There is a need to decrease the number of CTs and diagnostics being ordered.Reference Kocher, Meurer and Fazel 75 More research is required to ensure that CTs and other diagnostics are ordered to maximize patient benefit and minimize risk and cost.
Could EDLOS reflect the patient complexity and associated hospital resource consumption, rather than process inefficiencies? This study hints that the relationship between patient complexity, hospital resource use, EDLOS, disposition, and CTAS is unclear. Consequently, should government targets be changed to incorporate these relationships? Further scrutiny of the Ministry pay-for performance targets based on CTAS groupings and disposition is suggested.
The largest contributing factor for Sunnybrook ICU and all admissions’ failure to reach EDLOS targets was AB.Reference Innes 5 , Reference Forero, McCarthy and Hillman 8 , Reference Schull, Slaughter and Redelmeier 20 , Reference Pitts, Pines and Handrigan 22 , Reference Bond, Ospina and Blitz 23 - Reference Schiff 29 In 2012, ward bed capacity for acute admissions decreased from 351 to 341 beds, and average hospital occupancy was 97.6%. Sunnybrook ICU had 58 beds with an occupancy of 96%. The daily average occupancy level of Sunnybrook’s 36 emergency stretchers with admitted patients was 51.8%. The unintended consequence is multiple management pathways for admissions, including the critically ill. Prolonged EDLOS is associated with higher mortality, longer inpatient length of stay, and higher cost.Reference Chalfin, Trzeciak and Likourezos 34 , Reference Duke, Buist and Pilcher 76 Therefore, one of the solutions to reach government targets is to balance the supply-demand for hospital resources.
The run chart reflects the influence of AB, BRD, and tailored Sunnybrook interventions. Losing four ICU beds exacerbated AB and increased EDLOS. The ICU decreased BRD by increasing the manpower for ED ICU consultations. Four ward transitional beds were added to mitigate AB. Subsequently, the mean and 90th percentile EDLOS decreased, despite increasing ICU admissions. The 90th percentile target was almost reached; however, increasing volumes may explain the inability to achieve the target. Therefore, interventions addressing high influence factors, AB and BRD, shortened the mean and 90th percentile EDLOS.
In summary, this study found that the high-impact factors predicting Sunnybrook’s failure to reach Ministry EDLOS targets were hospital-controlled. Hospitals with complex patients requiring more resources will have prolonged EDLOS if demand is not adequately supported. Evidence-informed solutions to factors highly associated with time target failure are an approach to shorten EDLOS. Hospital quality improvement plans are encouraged to tailor their approach for shortening EDLOS by examining its patient population and resource demands.


