


Within our food range, products with a savoury taste are in general higher in protein levels, while food products with a sweet taste are more related to carbohydrate content(Reference Blundell, Green and Burley1, Reference Luscombe-Marsh, Smeets and Westerterp-Plantenga2) (i.e. savoury taste refers to non-sweet, salty taste, closely linked to the ‘umami taste’, and is also described as ‘brothy’ or ‘meaty’(Reference Yamaguchi and Ninomiya3)). It has been shown that hungry subjects show a marked preference for high-protein foods, while after being satiated, an aversion for high-protein foods emerges(Reference Hill and Blundell4, Reference Barkeling, Rossner and Bjorvell5). In addition, a high-protein meal produces a significantly greater reduction in liking for high-protein foods than high-carbohydrate foods(Reference Hill and Blundell4, Reference Barkeling, Rossner and Bjorvell5). These findings are in concurrence with the ‘protein-leverage’ hypothesis, which poses that protein intake is tightly regulated in the human body, and prioritised over the intakes of carbohydrate and fat(Reference Simpson, Batley and Raubenheimer6, Reference Simpson and Raubenheimer7). This might also explain why protein has been found to be the more satiating macronutrient. However, the role of sensory qualities in the satiating effects of protein requires further clarification.
It has been shown that sensory properties of food play an important role in food selection and intake(Reference Blundell, Rogers, Hill, Solms, Booth, Pangbourne and Raunhardt8–Reference Sørensen, Møller and Flint10). When a food is eaten to satiety, the hedonic value of the sensory properties of that food decreases more than of foods that have not been eaten(Reference Rolls, Rolls and Rowe11). And not only eaten foods, but also foods that share sensory characteristics of the eaten foods decline in pleasantness relative to foods that do not share these properties(Reference Rolls, Vanduijvenvoorde and Rolls12). In addition, the strength of this transfer effect for different tastes is not equal. It appears that savoury taste has a stronger modulating effect on subsequent food choice than sweet taste(Reference Griffioen-Roose, Finlayson and Mars13).
The objective of the present study was to determine separately the effect of within-meal protein content and taste on subsequent food choice and satiety. Our approach consisted of measuring the effect of four different preloads (rice meals), varying in protein content (low and high) and taste (sweet and savoury) on subsequent food choice and intake of sixteen food products differing in protein content and taste.
We postulated that the high-protein preloads would be more satiating than the low-protein preloads, and that this effect would be most evident when this high protein content was linked with the appropriate savoury taste. In addition, we hypothesised that after the low-protein preloads the intake of products with a high protein content at the buffet would be higher than after the high-protein preloads, but that this effect would be most evident when the low-protein preload was linked with sweet taste.
Subjects and methods
Subjects
Healthy, normal-weight subjects, aged 18–35 years, were recruited. Exclusion criteria were restrained eating (Dutch Eating Behaviour Questionnaire, men: score>2·25; women: score>2·80)(Reference Van Strien14)), lack of appetite, an energy-restricted diet during the last 2 months, change in body weight>5 kg during the last 2 months, stomach or bowel diseases, diabetes, thyroid disease or any other endocrine disorder, having difficulties with swallowing/eating, hypersensitivity for the food products under study, smoking, being a vegetarian, and, for women, being pregnant or lactating. Body weight and height were measured. In total, sixty subjects (twenty-three males and thirty-seven females) aged 20·8 (sd 2·1) years, with a mean BMI of 21·5 (sd 1·6) kg/m2 completed the study.
Subjects were unaware of the exact aim of the study and were informed that we were interested in comparing several methods of assessing palatability of rice products. The present study was conducted according to the guidelines laid down in the Declaration of Helsinki and all procedures involving human subjects were approved by the Medical Ethical Committee of Wageningen University. This trial has been registered with the Dutch Trial Register (NTR) (registration no. NTR 2162). Written informed consent was obtained from all subjects.
Design
We used a randomised cross-over design with four conditions (Fig. 1). Subjects were offered one of four isoenergetic preloads for lunch: a low-protein sweet, a high-protein sweet, a low-protein savoury, or a high-protein savoury. This was followed by an ad libitum lunch buffet. In addition, after the preload and before the buffet, several components of food reward were measured using the Leeds Food Preference Questionnaire (LFPQ) (procedure explained in ‘procedure and data collection’). The four sessions were scheduled in four subsequent weeks with a minimal wash-out of 5 d (preferably subjects came to the laboratory on the same day of the week, but this was not always possible). The order of the sessions was randomised for each subject according a generalised Latin square design. Preceding the experiment there was one practice day to familiarise participants to the test conditions without consumption of the test foods.

Fig. 1 Overview of the study design. LFPQ, Leeds Food Preference Questionnaire.
Test foods
Preload
A rice meal was used as the preload. For each individual the amount of rice was determined by individual energy needs estimated by means of the Schofield I equation(15), taking into account age, weight, sex and a physical activity level of 1·6. About 10 % of energy of daily estimated energy needs was provided by the preload, which is about half the amount of energy provided by lunch in The Netherlands(Reference Hulshof, Ocké and Van Rossum16). The calculated amounts were categorised per 25 g: five subjects received 200 g, twenty-two subjects received 225 g, twelve subjects received 250 g, nine subjects received 275 g, nine subjects received 300 g, and three subjects received 325 g (equal to an average intake of 252 (sd 35) g).
Palatability and composition of all preloads are given in Table 1. The low-protein preloads derived about 7 % of their energy from protein, the high-protein versions about 25 %. Energy content and macronutrient composition were calculated before the study using the Dutch nutrient database(17). In addition, macronutrient content was determined afterwards by chemical analysis of a homogeneous mixture of samples that were collected every testing day.
Table 1 Palatability ratings and nutritional composition (energy content and macronutrient composition) of the sweet and savoury low- and high-protein preloads
(Mean values and standard deviations)
Mean value was significantly lower than for the sweet preloads: ** P < 0·01, *** P < 0·001. No differences existed between the low- and high-protein preloads.
† Ratings after the first bite, measured on a 100-unit visual analogue scale.
‡ Shown per average serving of 252 g preload. N was determined by the Kjeldahl method (method 920·87(46)), and the amount of protein was calculated using a conversion factor of 6·25. Fat was determined by the acid hydrolysis method (method 14·019(46)); available carbohydrate was calculated by subtracting moisture, ash, protein, dietary fibre and fat from total weight. Energy content was calculated from the macronutrient composition by using the following energy conversion factors: protein, 16·7 kJ/g; fat, 37·7 kJ/g; carbohydrate, 15·7 kJ/g.
The core component of all preloads was risotto rice (Lassie, Wormer, The Netherlands) (65 %). The sweet versions were made with semi-skimmed milk (22 %), butter (4 %), water (4 %), cinnamon (0·08 %) and sucralose (0·05 %). The savoury version was made with semi-skimmed milk (17 %), crème fraîche (11 %), bouillon (0·3 %), garlic powder (0·02 %) and salt (0·8 %). The low-protein versions contained 6 % maltodextrin (Fantomalt; Nutricia, Zoetermeer, The Netherlands), the high-protein versions contained 6 % whey protein (Whey Premium Natural; EWP, Breda, The Netherlands). We used a standardised protocol to make fresh preloads every morning before the test and they were kept warm with an average temperature of 66°C (range 61–75°C). The preloads were served in bowls and were consumed with a tablespoon. Subjects were instructed to finish their bowl.
Food products
The ad libitum buffet consisted of sixteen food products that were selected on the basis of their protein content (low/high) and taste (sweet/savoury). Energy content and macronutrient composition of the selected products are shown in Table 2. The food products were offered in portions of 40 g (there were four exceptions, as multiplying the weight of a single piece did not add up to an exact 40 g. Therefore all-butter biscuits and Dutch cookies were served in quantity of three (adding up to servings of 35 g), and little frankfurters and Dutch tiny pancakes in quantity of five (little frankfurters 35 g; Dutch tiny pancakes 42 g). The LFPQ, which was run before the buffet, included photographic images of all the food products present at the lunch buffet. Before the experiment the general liking of these sixteen foods was assessed with a food questionnaire containing pictures of these foods. Ratings were performed on a nine-point hedonic scale. For inclusion, at least one product of a category should be scored 5 or higher.
Table 2 Energy content and macronutrient composition of the food products offered during the ad libitum lunch buffet and shown in the Leeds Food Preference Questionnaire (per 100 g)†

* An analysis was run to investigate whether the energy content and macronutrient composition of the food products offered during the ad libitum lunch buffet (per 100 g) differed between the food categories using ANOVA (SAS proc GLM with protein content of product (low and high) and taste of product (sweet and savoury) as independent variables). It was shown that the high-protein categories indeed contained more protein (g) (F(1, 12) = 14·77; P < 0·01) and less carbohydrates (g) (F(1, 12) = 12·47; P < 0·01). The categories did not significantly differ in fat content (g) and energy content (kJ).
† Values derived from the Dutch nutrient database 2006(17).
Procedure and data collection
Subjects were asked to refrain from eating and drinking energy-containing beverages from 23.00 hours on the day before each test day, and were instructed to standardise both their morning activity and breakfast. Before the experiment subjects received a list of high-protein products that were not allowed to be consumed during breakfast, including the following products: cheese, peanut butter, curd, egg products, meat products and fish products. Subjects had to consume their breakfast at least 3 h before the start of the test and report the time of breakfast and products consumed in a diary. Energy-free beverages were allowed up to 1 h before the test session. Furthermore, subjects were asked not to eat anything until 1 h after the test session. Food diaries were used to monitor compliance with these procedures.
Assessment of the food diaries showed that subjects indeed consumed a standardised breakfast at least 3 h before the test and that the main taste of the breakfast that all subjects ate was predominantly sweet (for example, bread with jam, or milk with muesli, etc).
Subjects were tested either at 11.30–12.30, 12.30–13.30 or 13.30–14.30 hours. All experimental measurements of one individual took place at the same time of the day.
When subjects arrived at the laboratory they were seated in an isolated sensory booth and given specific instructions shown on a computer screen. All test sessions started with subjects filling out an appetite questionnaire, consisting of five dimensions: hunger, fullness, prospective consumption, desire to eat something sweet, and desire to eat something savoury. The 100-unit visual analogue scale was anchored with ‘not at all’ to ‘extremely’. Next, subjects were presented with a preload. Before starting to eat, they had to taste a bite and rate their liking (‘how pleasant do you find the taste of this food right now?’) and wanting (‘how much do you want to eat this food right now?’). Then, subjects were instructed to start their meal. After finishing their bowl, they were asked to re-rate the preload on liking and wanting and to repeat appetite ratings.
During consumption of the preload, a hidden scale (model KERN 440; ATP-Messtechnik, Balingen, Germany), connected to a computer, recorded food intake every 2 s (precision 0·1 g), enabling calculation of eating rate and total eating time of all preloads.
At 30 min after eating the preload, different components of food reward were assessed by the LFPQ, which is a validated tool developed and extensively described by Finlayson et al. (Reference Finlayson, King and Blundell18, Reference Finlayson, King and Blundell19). The program was translated to Dutch and included photographs of the sixteen food products shown in Table 2. For explicit measures, a single presentation of a food product was shown and individuals had to rate their liking (‘how pleasant would you find the taste of this food right now?’) and their wanting (‘how much do you want to eat this food right now?’) on a 100-unit visual analogue scale. In addition, a paired presentation of food products was shown where subjects had to select their most wanted food (‘select the food which you most want to eat right now’) as quickly and accurately as possible. During this last procedure both frequency of preferred choice (relative food preference) and reaction time were measured. As participants were not informed about the measurement of their reaction time for each choice, this measure provided an indication of non-verbal, implicit processes of motivation (implicit wanting). Reaction times (RT) were transformed to a standardised ‘d-score’ (D-RT) using a validated algorithm(Reference Greenwald, Nosek and Banaji20): the smaller the D-RT, the greater the implicit wanting for that food category relative to other categories in the task.
After finishing the LFPQ, subjects were escorted to an adjacent room where an ad libitum lunch buffet was present and where separate individual eating areas had been created. At the buffet, subjects were allowed to choose as many products as they wanted, and they could re-visit the buffet as many times as they liked. Subjects were not obliged to finish their plate. The buffet area only allowed one subject at the time. The buffet was continuously refilled, so that twelve portions of every product were displayed at all times. Ad libitum intake of the food products was measured by weighing the remaining amount in the food packages.
Throughout the test sessions, both during the preload and at the buffet, water was freely available and served in cups of 200 ml. Ad libitum intake of water was measured by weighing remaining water in the glasses. Intake of water was not significantly different during the four sessions; mean intake of water during the low-protein sweet preload session was 320 (sd 107) g, during the high-protein sweet session 337 (sd 119) g, during the low-protein savoury session 329 (sd 89) g, and during the high-protein savoury session 352 (sd 126) g.
Between finishing the preload and starting the LFPQ subjects remained in the isolated sensory booths but were allowed to read or play a computer game.
Statistical analyses
Data are presented as mean values with standard deviation unless otherwise specified.
An ANOVA was used to compare eating time and eating rate (total intake divided by total eating time) between the four preloads (SAS proc GLM with protein content of preload (low and high) and taste of preload (sweet and savoury) as independent variables). The cumulative food intake was fitted for each person for each preload to a quadratic equation: y = a+bt+ct 2, where b is the constant slope of the curve over time, i.e. initial eating rate, and c is the change in the slope of the curve over time, i.e. rate of deceleration(Reference Kissileff, Thornton and Becker21, Reference Dovey, Clark-Carter and Boyland22). To investigate whether cumulative food intake differed between the four preloads the a's, b's and c's were analysed using an ANOVA. Due to measurement errors, there were in total eight missing values on eating time. Pre- and post-appetite ratings for the preload were analysed using ANOVA (SAS proc GLM with protein content of preload (low and high), taste of preload (sweet and savoury), and time of rating (pre- and post-preload) as independent variables). Differences between the four preloads on total intake (kJ) of the food products at the ad libitum buffet and the choice of food products from the different categories at the buffet were analysed using ANOVA (SAS proc GLM with protein content of preload (low and high), taste of preload (sweet and savoury), protein content of product at the buffet (low and high), and taste of product at the buffet (sweet and savoury) as independent variables). The choice of food products from the different categories at the buffet is expressed in percentage of the total, irrespective of amount. For example, if a subject chose sweet low- and high-protein products, both categories represent 50 % of the total, even if of one category more products were chosen and eaten than of the other category. As one subject refrained from eating at the buffet during two out of four sessions, no percentages could be calculated for the four categories for these sessions (missing data). In addition, macronutrient intake (g) at the ad libitum buffet, irrespective of food categories, was calculated for each preload and analysed for each macronutrient separately (protein, carbohydrates and fat) using ANOVA (SAS proc GLM with protein content of preload (low and high) and taste of preload (sweet and savoury) as independent variables). In all analyses, both main effects and interactions between the independent variables were analysed. In addition, participants were included in the model (within-subject design).
The ad libitum intake (kJ) and food choice (%) were tested for correlation (Pearson's correlation coefficient) with the measures of the LFPQ. In addition, the predictive values of the measures of the LFPQ on intake (kJ) and food choice (%) were investigated using a multiple linear regression analyses with backward elimination. As one subject refrained from choosing one particular food category during one session of the four sessions, no implicit wanting could be calculated for the four categories for this session (missing data).
Post hoc analyses were made using Tukey's correction. Results were considered significantly different at a P value of < 0·05. Analyses were conducted using SAS v. 9.1 (SAS Institute, Inc., Cary, NC, USA).
Results
Preload
The four preloads were eaten within a similar time period of 4·4 (sd 2·1) min and at a similar pace of 64 (sd 29) g/min; neither protein content nor taste of the preloads had a significant effect on eating time (protein content, F(1, 170) = 0·79 (P = 0·38); taste, F(1, 170) = 0·19 (P = 0·66)) or eating rate (protein content, F(1, 170) = 1·02 (P = 0·31); taste, F(1, 170) = 0·22 (P = 0·64)). In addition, there were no differences between the four preloads regarding cumulative food intake.
Pre-preload appetite ratings (hunger, fullness, prospective consumption, appetite for sweet and appetite for savoury) were similar across conditions and therefore averaged (Table 3). Eating a fixed amount of preload irrespective of protein content and taste decreased hunger, prospective consumption and increased fullness (all P values < 0·05). Appetite for something sweet was only decreased after eating the sweet preloads, but not after the savoury preloads. In addition, post-preload rating appetite for something sweet was lower after eating the sweet preloads (both low- and high-protein preloads combined) than after the savoury preloads (P < 0·0001). Post-preload rating appetite for something savoury was lower after the savoury preloads than after the sweet preloads (P < 0·0001). No main effect of protein content of the preloads was seen in either of the appetite ratings.
Table 3 Pre-preload and post-preload appetite ratings (100-unit visual analogue scale) according to preload
(Mean values and standard deviations)

* Mean value was significantly different from that for the pre-preload rating (P < 0·05).
† P values of differences in post-meal ratings between the four preloads.
Effect of protein content of the preloads on food choice and satiety
No effect of protein content of the preloads was seen on total intake (kJ) at the ad libitum buffet (F(1, 885) = 0·01; P = 0·93) (Fig. 2(a)). When investigating the intake of the different food categories, no differences were seen in intake of the different food categories after the low-protein preloads (both sweet and savoury preloads combined) in comparison with intake after the high-protein preloads (F(1, 885) = 0·16; P = 0·69).
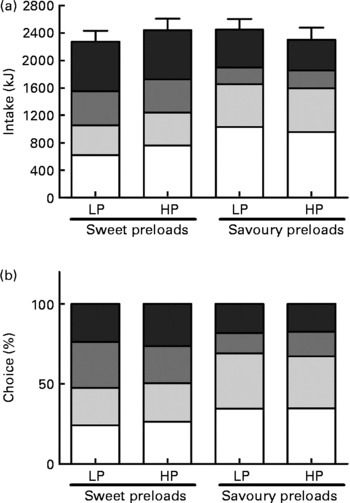
Fig. 2 (a) Total intake (kJ) of the high-protein savoury (HPSA; ■), low-protein savoury (LPSA; ![]() ), high-protein sweet (HPSW;
), high-protein sweet (HPSW; ![]() ) and low-protein sweet (LPSW; □) products at the ad libitum buffet after eating the sweet and savoury low-protein (LP) and high-protein (HP) preloads. Values are means (n 60), with standard errors represented by vertical bars. Analysis showed that there was no effect of protein content (P = 0·93) or taste (P = 0·89) of the preloads on total intake (kJ). No differences were seen in intake of the different food categories after the LP preloads (P = 0·69). Taste of the preload significantly interacted with the taste of the food products; after eating the savoury preloads intake of the sweet foods was higher than of the savoury foods (P < 0·0001). (b) Choice (%) of the HPSA, LPSA, HPSW and LPSW products at the ad libitum buffet after eating the sweet and savoury LP and HP preloads. Values are means (n 59), with standard errors represented by vertical bars. Analysis showed that there was no effect of protein content on preferences for the different food categories (P = 0·35). Taste of the preload significantly interacted with the taste of the food products chosen at the buffet; after eating the savoury preloads a large preference for the sweet foods appeared in comparison with the savoury foods (P < 0·0001).
) and low-protein sweet (LPSW; □) products at the ad libitum buffet after eating the sweet and savoury low-protein (LP) and high-protein (HP) preloads. Values are means (n 60), with standard errors represented by vertical bars. Analysis showed that there was no effect of protein content (P = 0·93) or taste (P = 0·89) of the preloads on total intake (kJ). No differences were seen in intake of the different food categories after the LP preloads (P = 0·69). Taste of the preload significantly interacted with the taste of the food products; after eating the savoury preloads intake of the sweet foods was higher than of the savoury foods (P < 0·0001). (b) Choice (%) of the HPSA, LPSA, HPSW and LPSW products at the ad libitum buffet after eating the sweet and savoury LP and HP preloads. Values are means (n 59), with standard errors represented by vertical bars. Analysis showed that there was no effect of protein content on preferences for the different food categories (P = 0·35). Taste of the preload significantly interacted with the taste of the food products chosen at the buffet; after eating the savoury preloads a large preference for the sweet foods appeared in comparison with the savoury foods (P < 0·0001).
When investigating choice of food products from the different categories at the buffet (Fig. 2(b)), also no differences were seen in preferences for the different food categories after the low-protein preloads in comparison with preferences after the high-protein preloads (F(1, 877) = 0·87; P = 0·35).
The overall macronutrient intake (g) after the different preloads at the ad libitum buffet, irrespective of the four different food categories, is shown in Table 4. No effect of protein content of the preloads was seen on intake of the different macronutrients (g) (protein, F(1, 177) = 0·05 (P = 0·82); carbohydrates, F(1, 177) = 0·70 (P = 0·41); fat, F(1, 177) = 0·16 (P = 0·69)).
Table 4 Total energy intake and macronutrient intake at the ad libitum lunch buffet after the sweet and savoury low- and high-protein preloads
* Mean value was significantly higher than after the sweet preloads (P < 0·05).
Effect of taste of the preloads on satiety and food choice
No effect of taste of the preloads was seen on total intake (kJ) at the ad libitum buffet (F(1, 885) = 0·02; P = 0·89) (Fig. 2(a)). When investigating the intake of the different categories, it was shown that the taste of the preload significantly interacted with the taste of the food products at the buffet (F(1, 885) = 51·92; P < 0·0001); after eating the sweet preloads (both low- and high-protein preloads combined) no difference was seen in intake between the sweet foods (1148 kJ) and savoury foods (1211 kJ) at the buffet (P = 0·90). After the savoury preloads, however (both low- and high-protein preloads combined), the intake of the sweet foods (1624 kJ) was higher than of the savoury foods (751 kJ) (P < 0·0001). No interaction was evident between taste of the preload and intake of food products differing in protein content (F(1, 885) = 0·67; P = 0·41).
When investigating choice of food products at the buffet (Fig. 2(b)), it was shown that the taste of the preload significantly interacted with the taste of the food products chosen at the buffet (F(1, 877) = 71·15; P < 0·0001); after eating the sweet preloads (both low- and high-protein preloads combined) no preference for a certain category existed (P = 0·93). After eating the savoury preloads, however, a large preference for the sweet foods appeared (68 %) in comparison with the savoury foods (32 %) (P < 0·0001). There was no difference in preferences for low- or high-protein foods after any of the preloads.
No effect of taste of the preload was seen on intake of protein (g) (F(1, 177) = 1·34; P = 0·25) and fat (g) (F(1, 177) = 2·42; P = 0·12) at the ad libitum buffet (Table 4). The intake of carbohydrates (g), however, was slightly higher after the savoury preloads (63 g) in comparison with after the sweet preloads (58 g) (F(1, 177) = 6·45; P < 0·05).
Leeds Food Preference Questionnaire
Pearson's correlation analyses of the ad libitum intake (kJ) and food choice (%) with the measures of the LFPQ are shown in Table 5. All measures of the LFPQ were significantly correlated with ad libitum intake (kJ) and food choice (%). The multiple linear regression analyses showed that the intake (kJ) of the food products at the ad libitum buffet was predicted only by the explicit wanting and relative food choice measures of the LFPQ (R 2 0·33). Food choice (%) at the buffet was predicted by the relative food choice and implicit wanting measures of the LFPQ (R 2 0·38).
Table 5 Pearson's correlation analysis (r) of intake (kJ) and food choice (%) at the ad libitum buffet with the measures of the Leeds Food Preference Questionnaire (LFPQ)
*P < 0·0001.
Discussion
With the present study we investigated the effect of within-meal protein content and taste on subsequent food choice and satiety. Results showed that food choice at the ad libitum buffet differed between the preloads but seemed to be mainly determined by taste and not by protein content. That we did not find an effect of protein content on subsequent food choice and intake was actually unexpected. Hill & Blundell(Reference Hill and Blundell4) investigated the effects of consuming a high-protein or high-carbohydrate meal on subjective feelings of appetite. They showed that the high-protein meal produced a significantly greater reduction in liking for high-protein than high-carbohydrate foods, but that the converse was not true for the carbohydrate meal. In addition, it was shown that hungry subjects showed a marked preference for high-protein foods, and that after eating, when satiety was high and hunger low, a relative aversion for high-protein foods and a preference for carbohydrate foods were displayed. Barkeling et al. (Reference Barkeling, Rossner and Bjorvell5) replicated these results and showed that in a satiated state, a relative aversion for high-protein foods was present, and that this aversion was greater after having eaten a high-protein lunch meal than after a high-carbohydrate lunch meal. Recently, Chung Chun Lam et al. (Reference Chung Chun Lam, Moughan and Awati23) showed that after a protein preload, but not after a carbohydrate preload, subjects choose subsequent foods higher in carbohydrate and lower in protein.
The strength of the present study, however, is that we varied both taste and protein content, in order to separate the course of action of these two components. To our knowledge this is the first study using this approach. As the majority of earlier studies did not do this, this might have affected their results (for example, like the earlier mentioned studies(Reference Hill and Blundell4, Reference Barkeling, Rossner and Bjorvell5, Reference Chung Chun Lam, Moughan and Awati23)). If you consider that in general savoury products contain higher protein levels than sweet products, the finding that the savoury preloads had a stronger modulating effect on subsequent food choice than sweet does seem to be in concordance with the protein-leverage hypothesis, which poses that protein intake is tightly regulated in the human body(Reference Simpson, Batley and Raubenheimer6, Reference Simpson and Raubenheimer7). After the savoury meal, a strong preference for sweet products was shown, while after the sweet meal, no preference was evident.
Through consumption of foods during our lifetime, we learn to estimate their satiating effects(Reference Brunstrom, Shakeshaft and Scott-Samuel24), and it has been suggested that this also plays a central role in the development of specific macronutrient appetites(Reference Baker, Booth and Duggan25, Reference Gibson, Wainwright and Booth26). It might be that the ‘learned’ link between taste and macronutrient composition is quite strong and cannot be affected within one eating episode. It would be interesting to investigate whether this link between taste and macronutrient composition could be learned over a longer period of time.
Results showed that both protein content and taste had no effect on satiety. The preloads were eaten at a similar pace, no differences were seen in cumulative intake and no effects were seen on the appetite ratings. In addition, at 30 min after the preloads there was no difference seen on total intake at the ad libitum buffet. That we did not find a difference between the sweet and savoury preloads was no surprise and concurred with our previous research where we showed that taste had no effect on satiety parameters(Reference Griffioen-Roose, Mars and Finlayson27). The lack of effect of protein content of the preloads, however, was not what we expected. Several studies have shown that protein seems to be more satiating than the isoenergetic ingestion of carbohydrate or fat (for a review, see Halton & Hu(Reference Halton and Hu28)). However, although it appears that the relationship between satiety and protein is clear, it is actually still quite ambiguous. For example, de Graaf et al. (Reference de Graaf, Hulshof and Weststrate29) did not find any effect of macronutrient composition of a preload on energy and macronutrient intake during the remainder of the day. Akhavan et al. (Reference Akhavan, Luhovyy and Brown30) reported a suppressive effect of whey protein on appetite, but when inspecting the cumulative intake of the total day, no effect on intake was seen. And when investigating the results of Vozzo et al. (Reference Vozzo, Wittert and Cocchiaro31), Hursel et al. (Reference Hursel, van der Zee and Westerterp-Plantenga32), Leidy et al. (Reference Leidy, Armstrong and Tang33), Chung Chun Lam et al. (Reference Chung Chun Lam, Moughan and Awati23) and a recent study by Potier et al. (Reference Potier, Fromentin and Lesdema34), no effect of protein on short-term appetite is evident. In addition, the European Food Safety Authority (EFSA) concluded recently that a cause-and-effect relationship has not been established between the dietary intake of protein and a sustained increase in satiety leading to a reduction in energy intake(35). The cause of the heterogeneous finding regarding the satiating effect of protein might lie with some methodological issues concerning this type of research. Satiety appears to be influenced by a wide variety of factors, including palatability, food mass, energy density, fibre and glycaemic index. It is very hard to control for all of these influences at the same time while still delivering different amounts of protein(Reference Halton and Hu28). In addition, many study designs do actually not allow us to draw conclusions on whether the effects observed can be attributed to dietary protein or to the concomitant modification of carbohydrate and/or fat as it is impossible to vary dietary protein, carbohydrate and fat content independently of one another using a single control preload(35).
There are some limitations to the present study that could have influenced our findings. It could be that our intervention was too subtle; although the relative energy percentage derived from protein differed largely between the low- and high-protein preloads, the absolute difference in protein intake averaged about 13 g (with a preload intake of 250 g). However, when considering that the average daily intake of protein in The Netherlands is about 80 g(Reference Hulshof, Ocké and Van Rossum16), which is similar to that reported in other parts of the world(36), a difference of 13 g within one lunch meal is still quite substantial. But it might be that subjects need to be more deprived of protein to shift their choice to high-protein foods, or be more protein satiated to shift their choice to low-protein foods. In the literature, many studies use larger amounts of protein to investigate the satiating effect (for example, more than 40 % of energy derived from protein(Reference Halton and Hu28)), and most often in liquid preloads. We chose a more naturalistic approach, with ranges of protein that were still within the normal (Dutch) range(37). In addition, we chose a solid product to ensure adequate sensory exposure, as this has been shown to be very important for satiety(Reference Zijlstra, Mars and de Wijk38). Solids do bring the difficulty, however, of being less flexible in terms of manipulating macronutrient composition. Although there are some studies showing effects of protein on satiety with only minor differences in protein content (for example, Bertenshaw et al. (Reference Bertenshaw, Lluch and Yeomans39)), as mentioned before, the relationship between satiety and protein is still ambiguous.
It has also been suggested that a mild protein deficiency is needed to be sensitive to protein manipulations(Reference Gibson, Wainwright and Booth26). Although we instructed subjects to have an overnight fast and avoid high-protein food products at breakfast, we cannot claim with certainty that our subjects were mildly protein deficient. Moreover, it might be that an interval of 30 min between the preloads and ad libitum buffet is too short to see an effect of protein, although Bertenshaw et al. (Reference Bertenshaw, Lluch and Yeomans40) showed an effect of protein with this small interval. Also our preloads were not similar in palatability. Although in the past it has been shown that palatability has no effect on satiety(Reference de Graaf, de Jong and Lambers41), we ran an extra analysis on a subgroup of subjects who rated the preloads < 20 units apart on a 100-unit visual analogue scale (n 37). This analysis yielded similar results to the results for the group in total, strengthening our view that this issue did not influence our findings.
Another issue that needs to be touched upon is the macronutrient content of the different food categories that were offered at the ad libitum buffet. As shown in Table 3, it appears that the savoury categories contain more fat (g) than the sweet categories (although not significantly). Recently there have been more and more indications that humans might have a fat receptor in the oral cavity that might influence food choice and intake(Reference Simons, Kummer and Luiken42, Reference Mattes43). This might have interfered with the present results. To gain more insights into the intake of the participants an analysis was run on their macronutrient intake, irrespective of the different food categories. As shown in Table 4, no effect of protein content or taste of the preload had an effect on fat intake. The intake of carbohydrates was slightly higher after the savoury preloads. This result strengthens us in our view that the fat content of the food products did not affect the intake and food preferences differently after the preloads.
In previous research we have shown that the LFPQ can be an appropriate tool to investigate food reward(Reference Griffioen-Roose, Finlayson and Mars13). In the present study, the results of the LFPQ provided interesting insights regarding human eating behaviour. All measures of the LFPQ correlated with both intake and food choice, implying that both conscious (explicit) and subconscious (implicit) processes, measured by the LFPQ, are involved in self-determination of meal sizes and in the self-selection of foods within a meal; it is not just conscious decisions that determine what we eat or how much. Moreover, the regression analyses show that the amount of food that individuals ingested was significantly predicted by explicit wanting and food choice. The choice for a specific food category, however, was more predicted by the implicit measurement. This suggests that the choice of food to ingest might be made on a more subconscious level, whereas the amount of intake is a more conscious event. Of course, the laboratory setting is not the optimum environment to investigate human eating behaviour(Reference Meiselman44), but by creating a buffet with free choice in a more relaxed eating environment in comparison with the sensory booths, we strived to create a more natural situation. In our opinion the LFPQ, or other psychological tools that can assess underlying processes (for example, Calitri et al. (Reference Calitri, Pothos and Tapper45)), is a valuable tool to use in human eating studies, not to replace measuring actual eating behaviour, but to use to unravel underlying mechanisms involved in human eating behaviour.
To summarise, the present results show that within one eating episode within-meal protein content in these quantities seems not to have an effect on subsequent food choice. This appears to be mostly determined by taste, whereby savoury taste exerts the strongest modulating effect.
Acknowledgements
The present study was supported by the Technology Foundation STW (grant no. 07438).
We thank Karin Borgonjen, Pauline Claessen, Fabian Griens, Maaike Hagen, Nhien Ly, Corine Perenboom, Tineke van Roekel, Els Siebelink and Betty van der Struijs for their help in carrying out the study.
The authors' responsibilities were as follows: S. G.-R. and C. de G. designed the study; S. G.-R. collected the data; S. G.-R. and G. F. analysed the data; all authors interpreted the data; S. G.-R. wrote the manuscript; all authors critically revised the manuscript.
None of the authors had a personal or financial conflict of interest.


