


Introduction
Shape and size are among the most basic and obvious characteristics of a cell (or of any physical object, for that matter). When a cell is observed through a microscope, one only sees its projection onto the image plane. Rather paradoxically, there are no easy techniques to visualize and measure cell's third dimension—thickness. For example, confocal microscopy requires fluorescent labeling, multiple scanning with a high-power objective, possibly correction for the refractive index mismatch, and even then, generation of a complete three-dimensional profile is not very straightforward or precise. Other techniques for imaging the cell vertical profile, such as ion conductance [Reference Korchev, Gorelik, Lab, Sviderskaya, Johnston, Coombes, Vodyanoy and Edwards1], digital holographic [Reference Kemmler, Fratz, Giel, Saum, Brandenburg and Hoffmann2], or atomic force microscopy [Reference Hessler, Budor, Putchakayala, Mecke, Rieger, Banaszak Holl, Orr, Bielinska, Beals and Baker3], are rather complex and not available to most users.
The related parameter of cell volume has also been elusive for traditional microscopy. Sometimes, the volumes of adherent cells are estimated from their diameters, even though it is evident that the extent of cell spreading cannot always correlate with the volume. Others detach cells prior to measurement and analyze them on a Coulter sizer; not only does this preclude continuous observation of the same cell, but the effect of detachment on cell volume has not been sufficiently characterized. Relative changes of the volume during rapid swelling or shrinkage can be observed by loading a fluorescent dye into the cytosol and measuring the fluorescence intensity with a confocal microscope [Reference Crowe, Altamirano, Huerto and Alvarez-Leefmans4]; to our knowledge, applicability of this method to slowly developing processes has not been investigated. These and some other techniques have been reviewed [Reference Verkman5]; it seems that a method that would combine high precision, high speed, and low cost is still lacking.
The question is important, though. Although the significance of cell thickness per se has been little explored, cell volume regulation has been a subject of intensive research. Cell volume is critical for understanding the cell response to anisosmotic environment [Reference Lang, Busch, Ritter, Völkl, Waldegger, Gulbins and Häussinger6], the development of apoptosis [Reference Cidlowski7], and the cellular basis of a number of diseases, including ischemic injury [Reference Leaf8] and brain edema [Reference Kahle, Simard, Staley, Nahed, Jones and Sun9]. Much evidence has accumulated that cell volume can have direct impact on cell behavior [Reference Hoffmann, Lambert and Pedersen10].
The Principle of TTD
The recently developed method that we call transmission-through-dye (TTD) microscopy [Reference Model, Khitrin and Blank11, Reference Gregg, McGuire, Focht and Model12] may at least partially address the problem of imaging the third dimension (and hence facilitate cell volume measurements). The principle of the method is quite simple: cells are placed in a very shallow compartment filled with a concentrated solution of a strongly absorbing, cell-impermeant dye. Because cells displace the dye, the brightness of transmitted image taken at the wavelength of maximal dye absorption reflects cell thickness (Figure 1). Lighter areas in a TTD image correspond to thicker parts of a cell, making qualitative interpretation of raw images quite intuitive (Figure 2). For quantitative analysis, cell thickness h is calculated from intensity I as
where α is the logarithmic absorption coefficient of the dye solution. To compute the total volume of a cell, the integrated intensity can be determined within a contour of area A drawn on the h-image around the cell of interest, and the result is further corrected for the background:
The vertical resolution achievable with this method inversely depends on α and on the signal-to-noise ratio of the gray level per pixel, and can be estimated [Reference Model, Khitrin and Blank11] as
Thus, if S/N = 100 (a typical value for a cooled CCD camera), then α = 0.1 μm−1 will ensure thickness resolution on the order of 0.1 μm; a much higher resolution may be possible with more concentrated dyes. At the same time, the lateral resolution is still limited by diffraction, as in regular transmission microscopy.
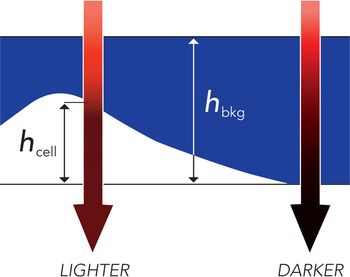
Figure 1: Contrast generation in TTD microscopy (reproduced with permission from [Reference Gregg, McGuire, Focht and Model12]).
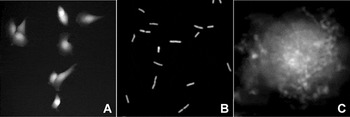
Figure 2: Examples of TTD images: (A) live T24 cells, (B) live E. coli, (C) surface of a fixed T24 cell displayed on the logarithmic scale, where gray levels are directly proportional to the vertical coordinate (reproduced with permission from [Reference Pelts, Pandya, Oh and Model13]).
The Dye
A dye suitable for TTD imaging of live cells should be cell-impermeant, nontoxic, and with sufficiently strong absorption to produce good contrast between the cell and surrounding area. The food colorant Acid Blue 9 (AB9), also known as Brilliant Blue FCF, has an absorption peak at 630 nm with α630 ≈ 0.22 μm−1 for a 1% solution. The purity of AB9 does not appear to be consistent among different manufacturers; we use the product from TCI America (TCI America, Portland, OR, catalog No. B0790). When added to normal culture medium at 0.5–1% w/v, AB9 is well tolerated by all cell types that we have tested: cells continue to proliferate, exhibit normal overall morphology, and have bright mitotracker staining [Reference Gregg, McGuire, Focht and Model12]. Another food colorant, Patent Blue V, is also compatible with living cells, but we have not tested it as thoroughly.
Penetration of the dye into a cell would result in underestimation of its thickness and volume by the factor 1 − αin/αout; thus, endocytosis of a significant amount of dye might in principle affect the measurements. We found, however, that an overnight incubation of T24 or HeLa cells with 0.5% AB9 barely stains the cells and should not produce an error greater than a few percent. By contrast, cells with severely damaged plasma membranes immediately absorb AB9 and become darker than the background in TTD images; in this case, absorption of AB9 correlates with propidium iodide staining. Moderate leakage of AB9 can be detected and possibly quantified by the degree of quenching of intracellular red fluorophores [Reference Pelts, Pandya, Oh and Model13].
Generally, the choice of the dye concentration should be dictated by the following considerations:
1. The lack of effect on cells. Although we have not seen any indication that at 0.5–0.7% w/v extracellular AB9 affected cell behavior in our experiments, such a possibility should always be kept in mind and checked whenever possible. Much higher concentrations of AB9 (up to 10%) can be used with formaldehyde-fixed cells [Reference Pelts, Pandya, Oh and Model13] or with live bacteria [Reference Lababidi, Pelts, Moitra, Leff and Model14], producing the vertical resolution in a low nanometer range. Formaldehyde fixation keeps cell membranes impermeable to AB9 (with possible exception of sperm cells), but only as long as the fixative remains in the medium. However, prolonged chemical fixation by itself may alter cell properties; for example, we observed cell swelling and bleb development after 20–30 minutes of exposure of HeLa cells to 4% formaldehyde [Reference Pelts, Pandya, Oh and Model13].
2. For thickness/volume measurements (as opposed to qualitative surface topography), both the cell and the background must be well resolved; if the dye is made too concentrated, it may become impossible to measure the gray level of the background with sufficient precision. In other words, high resolution of the surface profile comes at the expense of reduced thickness range. One way around this complication would be to collect a second image at a wavelength removed from 630 nm, where AB9 absorbs less strongly, allowing the entire depth to be imaged (Figure 3).
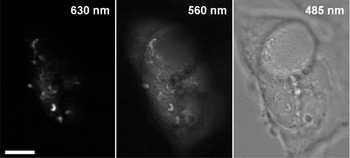
Figure 3: Formaldehyde-fixed HEK 293 cells immersed in 10% AB9 and imaged with a ×60/1.2 water-immersion objective through 630 nm, 560 nm, and 485 nm bandpass filters. At maximum absorption at 630 nm, 0.1–0.5 μm ruffles on the top of the cell are clearly visible, but the rest of the cell is dark; at 560 nm, where the dye absorbs 5 times less, the background is substantially brighter than the camera dark level, allowing the measurement of the total cell height (about 6 μm). The third image is taken at 485 nm; AB9 does not absorb there, and the image is essentially brightfield. Scale bar = 10 μm.
The absorption of dye solutions used for TTD is too strong to be measured on a spectrophotometer; therefore, we use the lens-immersion method for the measurement of α [Reference Model, Khitrin and Blank11]. In this method, a drop of a dye solution is placed on a coverslip or on a slide, and a small plano-convex lens is immersed in it with its spherical surface facing the slide; this creates a narrow and gradually widening gap between the lens and the slide filled with the dye. Because the depth of the gap is a simple function of the distance to the center of the lens, the absorption coefficient can be easily derived from the distribution of intensity in transmission image.
The Chamber
A gap slightly deeper than typical cell thickness can be formed between a coverslip and a slide. For example, cells can be grown on a coverslip and mounted on a slide in a dye-containing medium. For prolonged observations, stability of the gap can be ensured by supporting the coverslip with a piece of polyethylene film used for food packaging and/or a small amount of silicone vacuum grease. With some practice, one can adjust the gap by gently pressing on the coverslip and judging the depth by the color of liquid—not too small, where cells could be crushed, and not too large, which would make the sample too opaque. Such a sample can be placed in a thermostabilized chamber and observed repeatedly or continuously for many hours. For prolonged experiments we keep coverslips unsealed and in contact with extra medium to avoid oxygen or nutrient depletion. The liquid can easily spread under the coverslip when added from the side; for example, cells can be additionally stained with fluorescent markers in this manner. For experiments that require rapid solution changes, we use a Bioptechs perfusion chamber FCS2 (Bioptechs Inc., Butler, PA) fitted with a second inlet port; a 30 μm spacer is used to create the required small depth.
The Microscope
Any microscope equipped for transmission imaging can be used for TTD. The only additional requirement is a bandpass filter, such as 630/10. It can be mounted anywhere between the lamp and the camera, but we prefer to have it on the condenser wheel, so that cells do not get exposed to excessively bright light. A laser scanning confocal microscope can be used as well, with a 633 nm or a 635 nm laser line to generate transmission images.
Because light in a microscope propagates as a cone, attenuation is accumulated over a slightly longer than vertical path. The difference is, however, slight (a 5% longer travel for marginal rays, assuming a 0.4 NA dry condenser and an aqueous specimen) and can be accounted for by using the same condenser for absorption measurement. An often unappreciated fact (including our own publications) is that, in the absence of strong scattering, brightness in transmitted illumination depends mostly on direct, and not on diffracted, light (as the popular formula (NAob/M)2 assumes) and thus on the smallest NA between the objective and condenser; this can be easily verified by using an objective with a variable numerical aperture. Therefore, contrary to our earlier statement [Reference Model, Khitrin and Blank11], high-magnification, high-NA objectives can be used for quantitative TTD imaging. Figure 4(A–C) shows the same group of cells imaged with ×10/0.4, ×20/0.75 and ×60/1.2 objectives; the difference in the calculated volume was less than 3% for all cells. For the same reason, when using the lens-immersion method to measure the absorption coefficient, it is acceptable to use an objective with lower NA than what is used for actual imaging. (Low-magnification objectives capture a larger area of the lens, resulting in improved accuracy of measurement.) We have previously reported that high-NA objectives overestimate α [Reference Model, Khitrin and Blank11]. The reason for the discrepancy appears to be excessive light scattering by the lens; if the condenser aperture is kept at a small opening, the values measured with high- and low-NA objectives turn out to be identical (not shown).
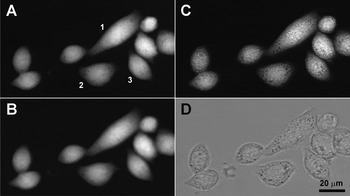
Figure 4: Volume measurements remain consistent regardless of the objective NA, the plane of focus, or the presence of additional brightfield contrast from intracellular structures. TTD images of the same group of HeLa cells were collected with three different objectives: water-immersion ×60/1.2 (A) and two dry objectives, ×10/0.4 (B) and ×20/0.7 (C); all images were brought to the same scale for display. The ×20 objective was focused inside the cells, rather than on the surface, so that intracellular vesicles appear sharp; a control brightfield image taken through a 485 nm bandpass filter shows the same vesicles (D). The calculated volume of cell 1 was 5642, 5810, and 5721 μm3 with ×60, ×20, and ×10 objectives, respectively; for cell 2, the corresponding values were 3025, 3056, and 3038 μm3, and for cell 3 they were 2600, 2668, and 2643 μm3. Thus, the differences in all cases were below 3%.
Processing and Interpretation of Images
We use ImageJ to convert raw images into depth units. The first step is to change the image type to floating 32-bit format; if the dark level of the camera is significant, it should be subtracted from the image prior to computing the logarithm (Equation 1). Unless one is interested in the absolute values of cell thickness (rather than relative changes), division by the absorption coefficient is optional. The background in TTD images can vary across the field, and therefore we determine it in the area adjacent to the cell of interest. Cells can be isolated on the image either using intensity threshold or by manually drawing a contour encompassing the cell. Note that inclusion of some background area within the contour will not affect the results, because the background value is later subtracted from the cell intensity (Equation 2).
Cytoplasmic inclusions, that are often present in cells, may produce contrast of brightfield origin, unrelated to cell thickness (Figure 4C, D). It mainly results from refraction on curved boundaries that separate areas with different refractive indices [Reference Agero, Mesquita, Neves, Gazzinelli and Mesquita15], in which case the effect is known as Becke lines. This spurious contrast may cause some problems when analyzing the fine structure of the cell surface. To alleviate this effect, several approaches can be used: (a) increasing the dye concentration to reduce the relative contribution of Becke lines; (b) fixing and keeping cells in formaldehyde to make possible the use of still higher dye concentrations; (c) focusing the objective on the apical surface rather than on the middle section of the cell (this is, in any case, necessary for high-resolution surface mapping); (d) collecting control images at a wavelength outside the range of dye absorption (for example, 485 nm) to identify features with strong Becke lines (Hearn et al., manuscript in preparation). The effect of Becke lines is less detrimental for volume measurements because the contributions of darker and brighter areas more or less cancel each other out. The remaining error can be further corrected by applying Equation 2 to a control brightfield image:
To test the effectiveness of correction, we imaged 10.3 μm polystyrene beads with refractive index 1.59 (Spherotech, Lake Forest, IL). The beads were immersed in a solution of Sudan IV (Sigma-Aldrich, St. Louis, MO) with α520 ≈ 0.1 μm−1 prepared in an oil with refractive index 1.54 (Cargille Laboratories, Cedar Grove, NJ); the difference between the refractive indices was approximately the same as between cells and aqueous media. A water-immersion ×60/1.2 objective produced relatively weak Becke lines (the absolute value of V con/V abs ≈ 5%) and a nearly perfect (>99%) match between V cor and the theoretical value. With a ×10/0.4 objective, the relative contribution of V con to the overall contrast was much greater (20%), and V cor underestimated the bead volume by 7%.
Thus, it appears that imaging with high-power objectives followed by correction by the brightfield contrast gives the most accurate results with strongly scattering objects. However, for practical purposes, the amount of improvement may not be worth the extra work required for correction; Figure 5 shows the time course of volume changes in a HeLa cell undergoing apoptosis. Apoptosis produced a temporary volume decrease and dramatic shape changes accompanied by strong Becke lines. Nevertheless, uncorrected volume measured with a ×10/0.4 objective only slightly differed from corrected values obtained with a ×20/0.75 objective. Note that the largest difference (6%) was observed when the cell volume was at its lowest. This can be explained by the fact that light scattering at this point was the strongest (due to the loss of water), and more photons scattered on the cell missed the small acceptance aperture of the ×10/0.4 objective.
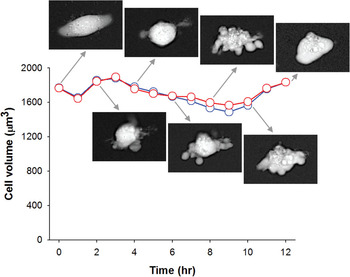
Figure 5: Time course of volume changes in a single HeLa cell undergoing apoptosis. The volume was measured both with a ×10/0.4 objective without correction (blue) and with a ×20/0.75 objective with brightfield correction (red).
In interpreting TTD images, one should keep in mind that the method measures cell thickness and not the profile of the apical surface; the two are identical only for intact cells that tightly adhere to the substrate. Two examples illustrating possible differences between thickness and profile are shown in Figure 6. Figure 6A shows the comparison between confocal restoration and TTD-derived thickness; a good match is observed in all areas except where the basal membrane of a cell is separated from the coverslip. The second example shows ionomycin-treated HeLa cells that have developed something that looks like dark craters on the surface (Figure 6B). However, fluorescence confocal imaging of GFP-actin revealed that those were not surface features but voids in the cytosol, with actin present both above and below (not shown). Because TTD images indicate that the dye-free depth was reduced at the voids, we conclude that they were filled with extracellular medium.
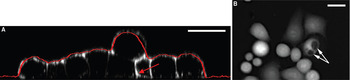
Figure 6: Two examples illustrating a possible difference between thickness and profile. (A) A cross section of a group of formaldehyde-fixed HeLa cells based on confocal images of WGA-Alexa 488 staining; the intensities are shown in black-and-white. The profile obtained from a TTD is shown with a red line. The red arrow points to a spot where the basal surface of a cell is elevated over the coverslip, thus reducing the overall cell thickness in that area. (Reprinted with permission from [Reference Pelts, Pandya, Oh and Model13].) (B) The dark spots correspond not to recesses in the surface, but to internal cavities filled with the dye. Scale bars = 20 μm.
Assessment of the Method
The advantages and disadvantages of the method can be summarized as follows:
Advantages:
1. The technique can be easily realized on any brightfield or a laser scanning microscope.
2. Image collection is fast because all the thickness information is contained in a single image.
3. Image processing can be accomplished with a standard software, such as ImageJ.
4. The results are insensitive to possible instability in the light source, because the intensity of the cell and of the background will be affected in the same way. (This may not be the case with laser scanning.) This also means that adjustments in image acquisition parameters (such as exposure time or lamp brightness) can be done on the fly.
5. TTD achieves high vertical resolution that exceeds the diffraction limit.
6. Volume measurements are relatively insensitive to defocusing.
7. Dead cells with ruptured membranes are easily recognized.
8. No photobleaching or phototoxicity is involved.
9. TTD is compatible with fluorescence. Although the dye can absorb photons in the orange-red range (whether excitation or emission), the effect is mild when the cells are grown on the coverslip and illuminated from their basal side.
Disadvantages and limitations:
1. Due to limited thickness range, large cells or multilayer clusters may become saturated at settings optimized for smaller cells.
2. A shallow cell container is required. Care should be taken to avoid the development of hypoxia during prolonged observations in the absence of liquid flow.
3. The volume of cells that form a confluent layer cannot be analyzed because the background intensity is unavailable.
4. In measuring the volume of round cells, a high-NA objective is preferred, and additional correction may have to be applied.
5. Subtle effects of the dye on cell functioning during long incubations cannot be ruled out.
6. Investigation of very fast response kinetics may be limited by the ability to rapidly exchange the medium in a shallow channel.
7. In some cases we have observed thermal cell damage when using intense green illumination from the mercury lamp.
8. Working with concentrated dyes can be messy. The dye easily stains hands or clothes (however, it is nontoxic [Reference Flury and Flühler16] and comes off with soap).
Possible Applications
It would be premature to attempt an overview of possible applications of TTD microscopy. Generally, the method can be used in most situations where the cell profile or the cell volume is of interest. We are currently using it to study volume regulation in cells during apoptotic and necrotic death. The mechanics of cell deformation is another area where TTD would be natural to apply. It would be interesting to see if high-resolution TTD is capable of resolving small membrane invaginations associated with budding endocytic vesicles to help dissect the stages of their formation. We have previously demonstrated dramatic changes in the structure of the membrane caused by the actin-depolymerizing drug latrunculin [Reference Pelts, Pandya, Oh and Model13], suggesting that the method could be valuable for studying the cytoskeleton. The volume and the shape of sperm cells have a proven diagnostic value [Reference Grimes and Lopez17], and the method may have potential in fertility analysis. The volume of bacteria is used by microbial ecologists for estimation of the biomass, and TTD appears to be an effective way to measure bacteria [Reference Lababidi, Pelts, Moitra, Leff and Model14]. The knowledge of cell volume in combination with quantitative fluorescence imaging [Reference Model, Reese and Fraizer18] can yield data for intracellular concentration of fluorescent proteins or fluorescently labeled drugs to assess their effectiveness in situ. By combining cell volume and mass measurements [Reference Mir, Wang, Shen, Bednarz, Bashir, Golding, Prasanth and Popescu19], one can study water transport between the cell and environment.
Acknowledgments
The author is grateful to Neda Kasim for expert technical help. The work was supported by the NIH grant 1R15GM186816, by the Kent State Initiative for Clinical and Translational Research, and by the Ohio Board of Regents.


