

Disclaimer
The views expressed in this publication are those of invited contributors and not necessarily those of the Institute and Faculty of Actuaries. The Institute and Faculty of Actuaries do not endorse any of the views stated, nor any claims or representations made in this publication and accept no responsibility or liability to any person for loss or damage suffered as a consequence of their placing reliance upon any view, claim or representation made in this publication. The information and expressions of opinion contained in this publication are not intended to be a comprehensive study, nor to provide actuarial advice or advice of any nature and should not be treated as a substitute for specific advice concerning individual situations. On no account may any part of this publication be reproduced without the written permission of the Institute and Faculty of Actuaries.
1. Summary of the Paper and Conclusions of the Working Party
1.1 Introduction
The risk margin is part of the Solvency II regime which came into force in the European Economic Area (EEA) in 2016. It has proved to be controversial in the United Kingdom (UK), where it has been criticised for being too large and too sensitive to interest rate movements, particularly in relation to business subject to long-term guarantees, such as annuities.
This paper examines the need for the risk margin and considers a range of possible alternatives, ranging from amendments to the calibration of the existing methodology to more radical changes. The working party hopes that the paper will inform the debate both in the context of reviews of Solvency II and more particularly within the UK, if changes to the solvency regime are under consideration following Brexit – the withdrawal of the UK from the European Union (EU).
1.2 The Risk Margin and Its Problems
1.2.1 Overview of the risk margin
The risk margin is part of the technical provisions under Solvency II. The technical provisions are defined as the amount required to be paid to transfer the business to another undertaking, in order to ensure that they meet the Solvency II requirement for market consistency. The risk margin is the difference between the technical provisions and the best estimate liabilities (BEL).
In practice, the technical provisions cannot normally be directly calculated as the transfer amount, and the risk margin is determined separately from the BEL, using a specified proxy methodology. The proxy methodology chosen for Solvency II is called the cost-of-capital method. It defines the risk margin as the discounted value of the future cost of capital relating to risks (other than hedgeable market risks) required to be held under Solvency II rules by the hypothetical transferee company (called the reference undertaking under Solvency II). In other words, the existence of the risk margin allows for the reference undertaking to be fully capitalised to Solvency II standards after the transfer.
Section 2 of the paper examines the purpose of the risk margin and sets out a detailed description of its calculation. This section is supplemented by Appendices B and F.
Appendix B describes the initial development of the risk margin under Solvency II, and in particular indicates why the cost-of-capital method was selected ahead of alternative methods. Appendix F is for reference: it lists the parts of the Solvency II Directive, Regulations and Guidance which are directly relevant to the risk margin.
The impact of the risk margin in the UK was mitigated on the implementation of Solvency II by the Transitional Measure on Technical Provisions (TMTP), which was introduced as part of the long-term guarantee measures package. For most UK insurers, the TMTP enables the introduction of the risk margin in respect of existing business to be scaled in over 16 years.
1.2.2 Summary of problems
Following the implementation of Solvency II, it became clear that for UK life insurers, the risk margin was both larger than expected and very sensitive to interest rate movements. The UK regulator, the Prudential Regulatory Authority (PRA), pointed out that between December 2015 and September 2016, the overall risk margin of major UK life firms rose from £30bn to £44bn (Rule, Reference Rule2017).
Although existing business was protected by the TMTP, there is significant concern about the risk margin causing volatility of insurers’ balance sheets, resulting in reinsurance of longevity risk outside the EU and encouraging procyclical investment behaviour.
Furthermore, new business is fully exposed to the risk margin, and there is concern about the impact on the price of annuities, including bulk purchase annuities. These not only form a major source of new business for many life insurers, but are very important to the overall system for retirement provision in the UK, both in relation to individuals and for pension schemes wishing to close down or transfer risk.
These criticisms of the risk margin are discussed in detail in section 3 of the paper, which also includes a summary of the treatment of the criticisms of the risk margin in post-implementation reviews of Solvency II.
1.2.3 Political ramifications
As a result of these concerns, the risk margin became politically significant. It was even specifically mentioned in a letter from the then Chancellor of the Exchequer, Phillip Hammond, to the Governor of the Bank of England (Hammond, Reference Hammond2017), which included the following:
The government also welcomes the work being undertaken to examine the design of the Risk Margin feature in the insurance regulation to limit the sensitivity to changes in the risk-free interest rates, which will have beneficial macroprudential and financial stability impacts.
In 2016 −17, the Treasury Committee of the House of Commons carried out an inquiry into EU Insurance Regulation in order to consider the extent to which Solvency II would be appropriate to the UK after Brexit, and whether changes to the regime should be considered.
The risk margin featured strongly in this inquiry, and written and verbal submissions relating to the risk margin were made by many parties, including the PRA, the Institute and Faculty of Actuaries (IFoA), the Association of British Insurers (ABI) and a number of insurers. The inquiry concluded that criticisms of the risk margin were justified, and that the PRA should act to resolve them (Treasury Committee, 2017b).
The PRA responded in February 2018 that it is considering changes to the risk margin (PRA, 2018), but in June 2018 it added that it cannot act at present owing to uncertainty about the future relationship of the UK with the EU (Woods, S., Reference Woods2018). This situation remains unchanged.
More details about the Treasury Committee inquiry are given in section 3.5.2.
1.3 The Working Party
In the light of the problems that had been identified and the political background, our working party was established in September 2017.
Our brief was to address two key objectives, in the context of life insurance business:
What can be done to fix known issues with the risk margin, either within Solvency II or using potential post-Brexit flexibility?
What should be the purpose of the risk margin and how can that purpose best be fulfilled?
We aim to address both of these objectives through the production and presentation of this paper.
In order to inform our conclusions, we carried out a survey of life insurers. The results of the survey are given in sections 4 and 6 of the paper, with a list of the questions in Appendix C.
We have also developed a simple model to illustrate features of the risk margin and assess the impact of various alternatives – the model is described in section 5 of the paper, with more detail in Appendix D. The main results of the model are presented throughout the paper.
In addition to the above, we have
contributed to the response from the IFoA to a consultation by the European Insurance and Occupational Pensions Authority (EIOPA) reviewing Solvency II;
presented at Current Issues in Life Insurance (CILA) in the form of a debate and at the IFoA Life Conference; and
engaged in a debate on the risk margin in The Actuary magazine.
1.4 Potential Amendments to the Risk Margin
In section 6 of the paper, we analyse a number of alternatives for re-calibration within the framework of the existing Solvency II Directive, retaining the cost-of-capital methodology.
These include
reducing the assumed cost-of-capital rate;
allowing the cost-of-capital rate to vary with interest rates; and
amending the discount rate from the risk-free rate.
The working party’s view is that more fundamental changes should be considered. In section 7 of the paper, we examine the following alternative methodologies:
a run-off percentile approach originally considered for Solvency II, for example, the risk margin might be defined as the difference between the 75th percentile of the probability distribution of the liabilities and the BEL;
a Provision for Adverse Deviation (PAD), for example, the impact of a specified adverse scenario;
a Value-at-Risk (VaR)-based approach;
a run-off capitalisation approach;
market reinsurance pricing in relation to longevity risk; and
removal of the risk margin altogether or replacing it with an increase in the solvency capital requirement (SCR).
In addition, section 7 includes a description of the margin over current estimate (MOCE), which is under consideration for the framework for International Capital Standards (ICS) being developed by the International Association of Insurance Supervisors (IAIS). To supplement this, Appendix E includes an overview of measures similar to the risk margin used in various solvency regimes outside the EEA.
In section 8 of the paper, we consider the properties of a desirable risk margin. We also evaluate the alternatives considered in sections 6 and 7 against these properties.
1.5 Practical Issues
Appendix A considers briefly a number of practical issues relating to the risk margin.
In section A1 of this Appendix, we consider the calculation of the risk margin and describe some of the simplifications which are necessary to carry out the calculations in practice.
In section A2 of this Appendix, we consider the question of stressing the risk margin in calculating the SCR.
An analysis of whether and how the risk margin can be hedged is given in section A3 of this Appendix.
1.6 Impact of Brexit
The future of the risk margin in the UK is likely to be highly dependent on Brexit.
At the time of writing, it remains unclear when and in what form Brexit will take place, and indeed even whether it will happen at all. As indicated in section 1.2.3, uncertainty over Brexit is already inhibiting the PRA from implementing changes considered to be desirable.
However, one of the working party’s aims in producing this paper is to inform any future debate on the development of the risk margin, and so we have to consider all possible outcomes.
One outcome is that following Brexit, the UK will have a relatively free hand in determining the solvency regime that is considered appropriate for UK insurers. In that situation, given the consensus in the UK that the risk margin is flawed, the alternative methodologies described in section 7 of the paper should be considered.
It is possible that following Brexit, the UK wishes to obtain Equivalence with Solvency II. Although Equivalence is likely to be more relevant to general insurance business than life business, a major change to the risk margin for life business may be a significant barrier to this. This could constrain potential changes to the risk margin in the UK.
Furthermore, the outcome of Brexit may be that the UK is constrained to be subject to Solvency II, either through a UK–EU agreement covering insurance business or through the UK remaining a member of the EEA. In this case, the UK would have no direct influence on the future of Solvency II, including the risk margin, and it is likely that changes to the risk margin to resolve problems specific to the UK would be difficult to achieve.
Nevertheless, irrespective of whether or not the UK remains a member of the EU, the working party hopes that this paper will be of direct use to EIOPA in reviewing the risk margin within the forthcoming review of Solvency II. We also expect the paper to inform the profession’s response to the consultation for the review.
1.7 Conclusions
The working party’s analysis has not reached a firm conclusion on one specific alternative method. Indeed, the different objectives are at times in conflict, so there is no one solution that meets all of them. Furthermore, the range of possible changes will be dependent on the outcome of Brexit.
Nevertheless, having regard to our evaluations of the various alternatives, the working party sees merit in considering the following changes:
to allow for an automatic change in the assumed cost-of-capital rate when risk-free rates change;
to allow a prudent illiquidity premium to be used in the calculations of the projected future SCRs and in the risk-free rate used in discounting the future costs of capital;
to allow certain longevity risk to be treated as hedgeable and the relevant part of the risk margin to be replaced by the cost of the hedge; or
to move to, or to allow as an alternative, the Percentile-MOCE, which is being considered under ICS.
More details are given in section 8.4, including our reasoning for selecting these alternatives.
The working party believes that a risk margin in some form is necessary. However, our view is that striking the balance between protecting policyholders and ensuring value for money is primarily a political choice, which affects the definition of both the risk margin and the SCR. This choice can be reflected in the calibration of any method that may be chosen. We hope that this paper will be useful in informing any deliberations regarding this balance.
1.8 Literature Review
A brief literature review is given in Appendix G.
2. The Risk Margin – Purpose and Calculation
2.1 The Case for a Margin
The idea that people are risk-averse is a well-known concept in many branches of economics and finance. Given a choice between receiving a guaranteed £50 and spinning a coin to decide whether they receive £100 or nothing at all, we expect the majority of people to choose the guaranteed amount.
We similarly expect firms to prefer liabilities where the value is known with certainty, rather than liabilities where the value cannot be known in advance. It seems sensible to reflect this preference in the value placed on the liabilities, with this value reflecting not only the expected cost, but also the uncertainty around this cost.
In the Solvency II framework, the starting point for determining technical provisions is to project a set of best estimate cash flows, each of which represents the mean outcome. Uncertainty around market risks is allowed for using a risk-free discount rate to value these cash flows, albeit subject to adjustments. The risk margin is then intended to reflect the “price” that is placed on the uncertainty relating to non-hedgeable risks.
We believe, therefore, that the underlying purpose of the risk margin is to ensure that technical provisions are struck on a market-consistent basis, that is, that a market price of risk is incorporated in respect of all risks, not only those risks for which deep and liquid markets exist. The hypothetical construct of the reference undertaking (see section 2.3), under this interpretation, is simply a means to arriving at a transfer value for the firm’s liabilities, rather than an end in itself. We now consider market consistency in more depth.
2.2 Market Consistency of Technical Provisions
One potential way in which the price of uncertainty can be included in the liability value is by setting the liability value equal to the amount required to settle the liability in the financial markets. If market participants are indeed risk-averse, then the amount for which they are prepared to settle the liability will presumably include the price of risk.
This is the approach taken by Solvency II, with Article 75, paragraph 1.(b) of the Directive stating that:
…liabilities shall be valued at the amount for which they could be transferred or settled between knowledgeable willing parties in an arm’s length transaction.
One key argument in favour of market-consistent valuation is that it results in liability values that reflect the cost of hedging the liabilities. If this is the case, and the insurer covers its liabilities with assets, then the insurer should be able to remove risk from its balance sheet should this become necessary, and thereby ensure that it does not default on its obligations.
An insurer’s solvency capital requirement (SCR) represents the 99.5% 1-year VaR in “basic own funds” (broadly equal to the excess of assets over liabilities). If an insurer holds own funds equal to its SCR then, in theory at least, there is a 99.5% chance of it surviving the next year. After 1 year has passed, if the insurer no longer covers its SCR it should still have sufficient assets to de-risk its balance sheet and therefore have a reasonable certainty that it will discharge its obligations in full.
This description of the Solvency II regime relies on the risk margin acting as a bridge between the SCR – which provides protection for policyholders over the next year – and the term of life insurance policies – which is typically much longer than a year.
While this description of the protection afforded by the Solvency II regime has a certain logic to it, it should be noted that this is only one interpretation of the intention behind the regime and this objective is not stated in the Solvency II Directive.
As indicated in Appendix B section B1.2, in developing the risk margin, the Committee of European Insurance and Occupational Pensions Supervisors (CEIOPS) – the forerunner of EIOPA – stated that it should have regard to a number of criteria including “achieving an appropriate level of policyholder protection over the run-off period of the liabilities” (CEIOPS, 2007, page 13). We should therefore also regard policyholder protection as an objective of the risk margin.
2.3 The Risk Margin Calculation
While a market-consistent valuation may look like an attractive option, the challenge it faces is that the cost of settling insurance liabilities cannot be observed directly from the financial markets.
This has required the architects of Solvency II to attempt to model this cost, and this modelled cost is necessarily dependent on a number of assumptions. Key features of the model are
the transfer takes place to a “reference undertaking” which has no assets or liabilities before the transfer, and which remains closed to new business after the transfer;
the reference undertaking will de-risk its assets so as to minimise market risk;
the reference undertaking is subject to Solvency II on an ongoing basis. It is required to hold technical provisions plus an SCR in respect of its remaining risks at all times – it therefore raises sufficient capital at the beginning of each year to cover this SCR for that year;
the amounts set aside to raise future capital are assumed to earn the basic risk-free rate of return inside of the reference undertaking;
however, the providers of capital require a return equal to 6% above the basic risk-free rate, since the capital is at risk (e.g. if assumptions are worse than best estimate).
These assumptions give rise to the following formula for calculating the risk margin:
 $$Risk\;Margin = CoC.\sum\limits_{t \ge 0} {{{SCR\left( t \right)} \over {{{\left( {1 + r\left( {t + 1} \right)} \right)}^{t + 1}}}}} {\rm{ }}$$
where
CoC denotes the cost-of-capital rate – for which a value of 6% is prescribed;
SCR(t) denotes the projected SCR after t years;
r(t + 1) denotes the basic risk-free interest rate for maturity t + 1 years.
It should be noted that the Solvency II Delegated Regulation prescribes the risks that insurers should assume will be included in the reference undertaking’s SCR. The only exception to this is where the insurer has actually hedged the risk – in which case it is assumed that the reference undertaking will maintain the hedge. The prescribed risks are
underwriting risk;
market risk which cannot be eliminated through the de-risking of assets;
certain credit risks (including reinsurance); and
operational risk.
The Solvency II rules also set out a number of other key assumptions which insurers should make when calculating the risk margin:
any reinsurance contracts held by the insurer transfer to the reference undertaking;
the SCR is calculated using the same model as is currently used by the insurer: be that the standard formula or a partial or full internal model that has been approved by the regulator;
the SCR makes no allowance for the loss-absorbing capacity of deferred tax;
the reference undertaking adopts future management actions that are consistent with those of the insurer.
In addition to these explicitly stated assumptions, Huber and Kinrade (Reference Huber and Kinrade2017) point out that the risk margin methodology also relies on a number of implicit assumptions not set out in the rules. These include
capital is raised in the form of equity;
the investment return on the assets in which the capital is invested is not subject to tax; and
the cost-of-capital rate is charged only on the SCR even though, in practice, most insurers aim to hold a multiple of the SCR.
3. Perceived Problems with the Risk Margin
3.1 Challenges for the Insurance Industry
The risk margin has faced much criticism, from the UK life insurance industry in particular. In the working party’s experience, the bulk of this criticism has not focused on the assumptions underpinning the risk margin model but has instead focused on the result that emerges. Specifically, the risk margin is said to:
be too large;
be too volatile;
incentivise the transfer of risk to jurisdictions that are not subject to Solvency II;
be too inflexible.
This section discusses each of these areas in turn.
3.1.1 Size of the risk margin
The PRA has estimated that, as at 30 September 2016, the aggregate risk margin held across the UK life industry was around £44bn. (Rule, Reference Rule2017) This is a similar order of magnitude to the total benefit that the UK life industry derives from use of the matching adjustment (MA) (estimated to be £59bn in Woods, S., Reference Woods2017). Given how contentious the issue of the MA was when the Solvency II rules were being agreed, it is not surprising that the risk margin generates significant debate.
The introduction of the risk margin is one of key differences between the Solvency II regulatory regime and the Individual Capital Adequacy Standards which preceded it in the UK. All else being equal, the requirement to hold a risk margin results in insurers holding greater financial resources (i.e. technical provisions plus capital requirements) to support given set of obligations than would otherwise be the case.
Insurers understandably want to minimise those parts of their balance sheet liabilities and capital requirements which are over and above the expected cost of meeting obligations to policyholders. These additional provisions – which include the risk margin, the SCR and the margin between the expected return on assets and discount rate embedded in the calculation of the BEL – tie up financial resources and delay the distribution of profits to shareholders.
The industry often argues that delaying distributions to shareholders raises the cost of capital for insurers, and that this is passed on to policyholders in the form of higher premiums. The counterargument to this is that anything that delays distributions to shareholders will improve the chances that insurers will have sufficient financial resources to weather future adverse experience and ultimately fulfil their obligations to policyholders.
Striking a balance between protecting policyholders and ensuring that policyholders receive value for money is an ever-present challenge for legislators and prudential regulators. As indicated in section 2.2, policyholder protection is one of the objectives of the risk margin, and the design and calibration of the risk margin must therefore be considered in this regard. The working party’s view is that striking this balance is primarily a political choice, which affects the definition of both the risk margin and the SCR.
3.1.2 Volatility of the risk margin
The PRA has estimated that a 100 basis points (bps) fall in the basic risk-free rate would result in the risk margin increasing by around 27% (Rule, Reference Rule2017). Illustrative modelling carried out by the working party, as described in section 5, shows a similar picture. Figure 1 illustrates how the size of a typical risk margin might have changed from the point at which Solvency II came into force, up to the end of 2018.

Figure 1. Variation of risk margin with risk-free rates.
Insurers understandably dislike sources of volatility on their balance sheets. Volatile balance sheets increase the likelihood that an insurer may be temporarily unable to meet its SCR, an event which can disrupt the insurer’s business plans by, for example, preventing it from paying dividends, forcing it to change its investment strategy and/or restricting its ability to write new business.
It is worth noting that the risk margin is typically significantly more volatile than the BEL for the same business. This can be seen by calculating the risk margin as a percentage of BEL, and then looking at how this metric has moved from 31 December 2015 to the end of 2018. This is illustrated in Figure 2.

Figure 2. Variation of risk margin as proportion of BEL with risk-free rates. Note: The RM/BEL ration for Dec 2015 is 7.7%. This is shown as 100% in the graph.
When faced with a volatile balance sheet item, the standard response is generally to look to hedge the volatility. The working party’s experience is that insurers have sometimes been reluctant to hedge the risk margin. Possible reasons for this include
there is a reluctance to lock in to long-term interest rates at a time when rates are low compared to historical levels. This is particularly true for the risk margin, which does not represent a true liability in the sense that it does not represent future payments to policyholders;
there is a cost associated with those hedging options which will simultaneously protect the insurer against future falls in interest rates and allow the insurer to benefit in a scenario where rates revert to historical averages; and
the risk margin does not normally feature as part of the accounting balance sheet under current International Financial Reporting Standards (IFRS) and UK Generally Accepted Accounting Principles. It therefore seems that hedging the risk margin may increase the volatility of the accounting balance sheet.
In section A3 of Appendix A, we discuss some of the issues relating to hedging the risk margin.
3.1.3 Incentive to transfer risk by reinsurance (including to jurisdictions that are not subject to Solvency II)
While insurers may have generally been reluctant to hedge the risk margin, many annuity writers have been keen to reduce their risk margins by reinsuring longevity risk.
Publicly available data on reinsurance pricing are very scarce. Anecdotally, the working party has heard that longevity swaps may have a profit loading of around 5% built in to them. This means that each of the fixed leg cash flows that the insurer has locked into paying is around 105% of the equivalent floating leg cash flow that the insurer will receive if experience works out as it expects. The result of this is that entering into a swap might be expected to increase the BEL for the affected business by around 5%, but will also remove the longevity risk component of the risk margin. Reinsuring longevity risk will also remove the SCR component for this risk.
Illustrative modelling carried out by the working party suggests that the risk margin may be around 8.4% of the BEL for a typical annuity book (based on market conditions at 31 December 2018). If this is correct, then reinsuring the longevity risk could lead to an increase in BEL that is smaller than the increase in risk margin, resulting in an overall reduction in technical provisions. After the reduction in SCR has been factored in, it is understandable why insurers might believe that current reinsurance pricing is attractive.
As noted in section 2.1.2, the risk margin is intended to be an addition to the BEL which brings the total technical provisions up to the level required to allow the insurer to transfer the risk to another firm. The fact that some insurers have managed to reinsure longevity risk at a price that is materially lower than the technical provisions might be regarded as prima facie evidence that the risk margin is too large – at least for longevity risk.
An important question to consider is whether or not the increased use of longevity reinsurance since the start of 2016 has improved the security of policyholders’ benefits. When answering this question, it may be useful to consider why reinsurers might be able to offer such attractive pricing.
On the one hand, it has been postulated that current reinsurance pricing has been driven by a desire from reinsurers to acquire UK longevity risk, which they may regard as diversifying against their large back-books of United States mortality risk, in particular, senior life insurance. If one accepts this view, then increased reinsurance may well be in policyholders’ interests, since the longevity risk is ending up with firms that are better placed to manage it than UK direct insurers.
However, there is an argument that reinsurance pricing may reflect the fact that many reinsurers are based in jurisdictions that are not subject to Solvency II, and so do not have to hold a risk margin themselves. If this is the case, then the transfer of longevity risk would be a form of regulatory arbitrage, with the risk being transferred to jurisdictions with lower regulatory requirements. This may lead to lower protection for policyholders overall.
The view that increased use of longevity reinsurance may be driven by the introduction of the risk margin has been expressed by Bulley (Reference Bulley2016, page 10) on behalf of the PRA:
Solvency II potentially provides firms with an additional incentive to undertake transactions to transfer longevity risk by way of reinsurance (especially for new business which does not benefit from any transitional measures), as doing so may ease the requirement for holding a risk margin in respect of the reinsurance liabilities. We recognise that the current design of the risk margin makes it acutely sensitive to interest rate conditions.
The increased use of reinsurance does mean that the success or failure of an annuity writer is now predominantly driven by how well it manages its assets. This is a stark change from the traditional role of life insurers, which was to manage insurance risk.
3.1.4 Inflexibility of the risk margin
Another common criticism of the risk margin is that its calculation is inflexible. There is a single formula, with a single set of prescribed parameters, which must be used for all lines of life and general insurance business in all territories of the EEA.
This inflexibility can bring stakeholders into conflict. For instance, some in the life insurance industry have argued that the cost-of-capital rate should vary with interest rates. This could reduce the volatility of the risk margin for long-term business, since changes in the cost-of-capital rate may offset changes in the discount factors. However, when responding to this suggestion, EIOPA noted that this proposal would increase the volatility of the risk margin for short-term business, which is much more sensitive to the cost-of-capital rate than it is to the discount factor.
3.2 Potential Issues with the Market Consistency Objective
Section 3.1 outlines some of the main concerns expressed by the industry in relation to the risk margin. This section and section 3.3 examine how the method and assumptions used to calculate the risk margin have given rise to these concerns.
Before considering the detail of the method and assumptions, it is worthwhile considering whether the risk margin’s primary purpose – to ensure market-consistent valuation of technical provisions – is appropriate.
The following considerations are particularly relevant:
Is market-consistent valuation appropriate for life insurance liabilities? Arguably, there are aspects of the Solvency II regime which, paradoxically, are not market-consistent, despite its original intentions (although it is not yet known whether these aspects will be retained in the UK post-Brexit). Market-consistent valuation may also have other drawbacks, such as introducing additional volatility to the regulatory balance sheet. This can undermine insurers’ ability to invest through the cycle: the more the balance sheets deteriorate in times of stress, the greater the incentive to de-risk balance sheets in times of stress, which can lead to procyclical investment behaviour. Solvency II has recognised this and, in an effort to reduce excessive volatility, has introduced various concepts such as the MA and volatility adjustment (VA) which have moved the regime away from pure market consistency.
A common variant of the arguments against market consistency is that, while base liabilities should be struck on a market-consistent basis, solvency capital should be struck using a run-off obligation-based approach, causing the risk margin effectively to disappear from the stressed balance sheet. The Solvency II regime aims for a situation where each insurer has at least a 99.5% probability of surviving the next year (i.e. having assets in excess of its liabilities in 1-year’s time) and then being able to fully de-risk its balance sheet. There is, however, a question about whether this two-stage aim is too complicated. In particular, if this aim is to be achieved, then insurers will need to model the cost of transferring risk during times of stress. Given that one cannot even readily observe the current cost of transfer, and given the contention around the debate about how the current cost of transfer should be modelled, modelling the cost of transfer under stress is ambitious to say the least.
Why is mortality/longevity risk treated as non-hedgeable, whereas almost all market risks are treated as being hedgeable? Reinsurance markets are arguably deeper than a number of the markets from which market-consistent assumptions are derived, for example, long-term equity or property volatility. Should reinsurance pricing therefore be given greater weight within the calculation of technical provisions? If so, this can be incorporated in a number of different ways.
In general, it is worth re-considering the set of risks within scope of the risk margin calculation.
3.3 Critique of Risk Margin Method and Assumptions
As well as considering whether a market-consistent valuation is appropriate for technical provisions, it is also worthwhile discussing whether the method and assumptions used to estimate this market-consistent value are appropriate.
3.3.1 Cost-of-capital method
Several concerns around the cost-of-capital approach have been raised.
The risk margin is driven by the insurer’s own SCR whereas, in a traded market, the market price of risk would reflect the average risk preferences across all market participants. Under the current methodology, two insurers may hold different risk margins against similar blocks of business owing to differences in their internal models.
Similarly, an insurer’s risk margin may be reduced if its risks diversify. Thus, an insurer with both protection and annuity business on its books may hold a proportionately lower risk margin than one that has solely annuity business.
Given the existing allowance for the insurer’s own risk profile including diversification benefits, however, the current risk margin construction precludes diversification benefit between life and general insurance business within the same entity or group. This too is worthy of further consideration.
3.3.2 Explicit calibration assumptions
Criticism of the calibration of the risk margin has to date focused on the prescribed 6% cost-of-capital rate, that is, the relevance of historical equity risk premium data, and the analysis and conclusions drawn from it. Additional concerns have been raised relating to the constancy and “through the cycle” calibration of the assumption, and the implications for balance sheet volatility.
Also worthy of critical review is the requirement to use a risk-free discount rate, both in the projected capital requirements, and in the discounting of the resulting cost of capital amounts to the valuation date.
3.3.3 Implicit calibration assumptions
An implicit assumption is that the cost-of-capital rate itself is fixed. This reflects EIOPA’s desire to produce a through-the-cycle calibration. There is therefore no allowance for movement in the cost-of-capital rate within the one-in-200-year all-risks SCR scenario.
Another implicit assumption is that the aim of the risk margin is to ensure the security of the policy proceeds to full Solvency II standards for the complete run-off period. In other words, should a one-in-200-year event occur at any future point, there should be sufficient capital available to cover the SCR for the next year, and then similarly for further adverse events. Although this provides a high level of security to policyholders, a lower level of security, with correspondingly lower costs, could also be considered.
Finally, under the prescribed approach, the SCR is projected deterministically over the lifetime of the liabilities, based on best estimate assumptions. In reality, the future SCR is an unknown quantity with a statistical distribution. A stochastic calculation of the risk margin could well lead to a different result compared with the existing deterministic calculation.
Randomness in future SCRs is caused by all of the same factors affecting the base liabilities (interest rates, policies in force, etc.) as well as changes to the level of the 99.5th percentile stresses for the calculation itself. The level of stress applied could change for a number of reasons:
changing views on the nature of the risks, for example, new medical data suggests a greater variance in the distribution of mortality improvements than previously assumed; or
underwriting risks might not be stationary, for example, following an increase in assumed longevity, future 99.5th percentile increases might be lower (the “cancer can only be cured once” argument).
3.4 Impact of the Risk Margin on the Pricing of Annuities
The availability and cost of annuities is very significant to the system of retirement provision in the UK, and indeed to the economy as a whole.
Individual annuities still have an important role to play in retirement provision, although there are now alternative means of using built-up funds. In particular, they provide insurance against living longer than expected.
The bulk purchase annuity market enables company pension funds to transfer current or future pensions to insurers in order to remove longevity risk or indeed close down. This can be beneficial both for reducing risk to the sponsoring employer and improving the security of benefits for the members.
Furthermore, the provision of individual and/or bulk annuities is seen as an area of opportunity for the UK life insurance industry, at a time when other products are subject to competition from outside the industry.
However, concern has been expressed that these benefits are jeopardised by the size of the risk margin, which represents economic capital, the cost of which must be allowed for in pricing.
This concern was a significant theme in submissions to the Treasury Committee inquiry (see section 3.5.2).
However, the PRA, in its response to the Treasury Committee (PRA, 2018, page 11) stated
We have also examined whether Solvency II is having a detrimental impact on policyholders as firms pass on increased costs of regulation, looking first at annuities. We conclude that risk-free market interest rates and corporate bond spreads continue to be the dominant driver of annuity prices, and the relationship does not appear to have changed since Solvency II came into effect.
This conclusion was based on Figure 3. The working party’s view is that it is clear that interest rates continue to be the dominant driver, but the limited data in the figure do not conclusively indicate that the relationship has not changed.
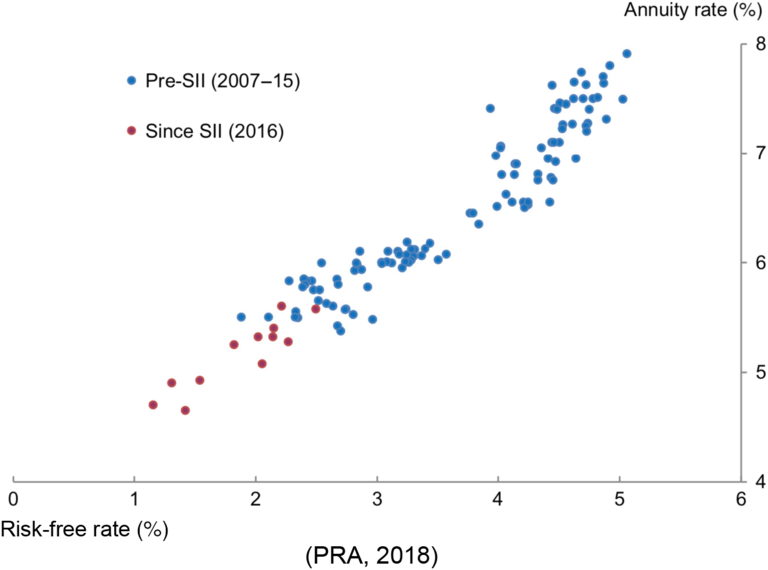
Figure 3. Relationship between annuity rates and risk-free market interest rates.
3.5 Solvency II Reviews and Industry Proposals
During 2017 and 2018, there were two main enquiries into the operation of Solvency II generally, and the risk margin in particular.
-
1. EIOPA advice on specific items in the Solvency II Delegated Regulation
The consultation, which included the risk margin, took place in 2017 and EIOPA’s final advice was published in February 2018 (EIOPA, 2018).
2. In the UK specifically, the Treasury Committee inquiry into EU Insurance Regulation
This inquiry took place in the first quarter of 2017 and, following the General Election and the reconstitution of the Committee, the report was published in September 2017 (Treasury Committee, 2017b).
3.5.1 EIOPA advice
The Call for Advice from the European Commission (2016) to which EIOPA responded was generally focused on the Level 2 Delegated Regulation, rather than the Level 1 Directive, and also primarily on the “methods, assumptions and standard parameters used when calculating the Solvency Capital Requirement with the standard formula” (ibid., page 2).
Given the discussion below, it should be noted that there is a separate and wider-ranging review of the long-term guarantees measures, which is due for completion by 1 January 2021, that is, 5 years after implementation.
As part of the 2017−18 review, EIOPA was asked specifically on the risk margin to:
provide information on the relative size of the risk margin in insurers’ balance sheet;
assess if the methods and assumptions applied in the calculation of the risk margin continue to be appropriate, in view of a changed market environment. In particular, EIOPA is asked to review the cost-of-capital rate. (ibid., page 8).
Interested parties had two opportunities to respond to EIOPA’s consultation, first to the initial call for views and second to the draft advice.
The main frustration for respondents to the consultation, including the IFoA, was that EIOPA interpreted the scope of its advice too narrowly. To quote from the profession’s response, IFoA (2018, page 8), to which this working party had input:
The scope of the call for advice was very broad, with EIOPA asked to “Assess if the methods and assumptions applied in the calculation of the risk margin continue to be appropriate”. However, EIOPA’s proposed advice to the Commission focuses narrowly on whether the cost-of-capital rate parameter is consistent with market indicators.
Indeed, the final advice from EIOPA (2018, page 370) was that
The review of other aspects of the risk margin should be done as part of the review of Solvency II that the Commission is required to undertake after 5 years of implementation.
The conclusion of the review in relation to the cost-of-capital rate was that if anything that 6% rate is too low, but nevertheless, it should not be changed. This is discussed in more in detail in section 6.1.
This conclusion was accepted by the Commission who made no changes to the risk margin following the EIOPA review of the Delegated Regulation.
3.5.2 Treasury Committee inquiry
The Treasury Committee’s inquiry in 2016−17 was into the effect on the UK insurance industry of the introduction of Solvency II. The risk margin was a major theme of the inquiry.
The submission of the ABI (2016, page 3) included
Our top concern is the Risk Margin …: Its size and sensitivity to interest rate movements are both significantly higher than expected and reflect unintended consequences of its design. This makes the writing of new business, in particular annuities and other long-term guarantee-based products, unattractive to firms.
The submission of the IFoA (2016, page4) commented on the aims of capital frameworks:
Solvency capital frameworks seek to ensure that insurers are capitalised at a level which allows the survival of a rare event. However, should insurers then:
have sufficient margins to recapitalise, or
have sufficient assets to mean a solvent run-off is possible?
Solvency II adopts the former more stringent approach, but the cost of capital is ultimately borne by the consumer and the level of security which they would willingly pay for needs to be taken into account.
The IFoA (2016, page 13) commented further, specifically on the risk margin:
Although the purpose of the risk margin may seem reasonable, the mechanism and parameters chosen tend to result on excessively high risk margins that are disproportionately high for long duration business, such as annuities. We therefore agree that there is merit in revisiting the design of the risk margin.
A significant part of the risk margin is more of the nature of an additional capital requirement as opposed to an allowance for the cost of transferring liabilities. It is very sensitive to long-term interest rates, particularly when interest rates are low (as has been the case recently). This can drive behaviour (such as reducing longevity exposure in order to reduce the risk margin) that might not otherwise be taken, as it erodes insurer profitability and/or feeds back into pricing for consumers.
Andrew Chamberlain, chairman of the Life Board of the IFoA at the time, gave oral evidence to the Committee. His evidence included (Treasury Committee, 2017a, Question 17)
There is a trade-off between the level of security and the price the consumer has to pay for that insurance – it is an insurance against the failure of the insurance … The price the consumer has to pay for that is something that they will not get a choice in. That choice is made by the regulatory system.
Following the General Election, a new Treasury Committee was formed, which in September 2017 released its own report, (Treasury Committee, 2017b), based on the previous Committee’s work. The parts of the report relating to the risk margin are summarised below.
In contrast to the results of the EIOPA consultation, the Committee appeared to have more sympathy with evidence received from the industry, and in particular with issues caused to the annuity market by the risk margin.
The PRA’s evidence did not disagree with the diagnosis – indeed the Committee’s report indicates that Sam Woods, Deputy Governor for Prudential Regulation and Chief Executive Officer (CEO) of the PRA, stated that “the biggest and most obvious bug is the risk margin” (ibid., page 20) – but disagreed as to the ability to effect change.
The Committee’s recommendations relating to the risk margin (ibid., pages 54−57), made after analysing the evidence submitted, were not entirely clear on what the Committee believes can be achieved within the existing Solvency II rules, and what would require amendments to the rules or indeed the UK to have more freedom to set its own rules. Indeed, the Committee strongly encouraged the PRA and the industry to come to a mutual understanding on this.
However, the Committee believes, including in respect of the risk margin, that “an excessively strict interpretation of the requirements of Solvency II, and of its own obligations has limited [the PRA’s] thinking”. It also urged the PRA to take “more of a post-Brexit mentality”.
Specifically on the risk margin, the Committee commented that:
An additional margin which purports to represent the additional capital that a third party would need in order to run off the insurance firm in the case of an extreme event makes conceptual sense [and] should continue to form part of the UK’s solvency regime.
The Committee’s response indicates that it believes a risk margin should be held even if the UK were no longer bound by Solvency II.
However, the Committee was concerned by the PRA’s “apparent reluctance quickly to address some of the problems of the risk margin” and recommended that the PRA, “working in close collaboration with the industry, should provide a solution for the risk margin to improve its calibration”, and this should be done “irrespective of the Commission review process”.
In February 2018, the PRA (2018, page 21) responded to say that it was actively looking at steps it might take to address the risk margin. The working party understands that this included the idea of accepting the “management actions” solution proposed by the industry (see section 6.2).
However, in June 2018, Sam Woods, CEO of the PRA, wrote to the Committee (S. Woods, Reference Woods2018) to say that the PRA had decided not to take this forward, pending further clarity on the Brexit negotiations:
We have been considering our supervisory approach to the use of future risk mitigation and transfer mechanisms in a number of contexts, including the calculation of the risk margin. We have looked at this option very carefully, and think it has some merit as a solution to the problem the risk margin is causing. However, in the context of the ongoing uncertainty about our future relationship with the EU in relation to financial services we do not yet see a durable way to implement a change with sufficient certainty for firms to be able to rely on it for pricing, capital planning and use of reinsurance.
3.5.3 Industry arguments
The submissions from the insurance industry to both of the above enquiries covered similar themes. The published responses from individual UK insurers and from industry organisations where they are strongly represented – the ABI (2018), Insurance Europe (2018) and the European Insurance Chief Financial Officers Forum (CFO Forum, 2018) – were also broadly consistent.
When we describe the key proposals from the industry, these can be taken as referring to the collective response to the two enquiries from these groups.
The key proposals from the industry for amendments to the risk margin were
1. reducing the cost-of-capital rate from 6% and potentially allowing it to vary with interest rates;
2. allowing for the market cost of reinsuring longevity in place of the risk margin calculation, including a mechanism by which this could be done without any need to amend the regulations;
3. allowing for the MA or VA when projecting future SCRs;
4. allowing for diversification between life and non-life business within the same entity and, more relevantly for the UK given the relative lack of composite insurers, between different entities in the same Group; and
5. allowing for the non-independence of risks over a lifetime, for example, by applying a tapering adjustment to projected SCRs.
Our analysis of these proposals is given in sections 6.1 to 6.5, respectively.
Responses to EIOPA from non-UK insurers and national industry bodies and actuarial associations outside of the UK were often different, largely in placing less emphasis on the risk margin as a key topic.
4. Survey of Insurers
4.1 Introduction
The working party has carried out a survey of selected UK life insurers, with the aim of providing insight into how the UK life insurance industry currently approaches the valuation and management of the risk margin, the main issues faced and potential future design changes.
The survey took place in the third quarter of 2018. In the period since implementation of Solvency II, the methodology and approach used by firms to measure the risk margin have largely bedded down, while the management and optimisation of it continue to date.
However, there are areas relating to the measurement of risk margin and management that are still open to debate.
The working party hopes that the results of the survey are useful in summarising industry attitudes at this point in time and as a comparator in future years.
4.2 Survey Structure
The structure of the survey was designed to capture
the key methodology points for determining the risk margin, rather than details of calculations;
the main issues being faced in managing it, particularly the volatility of interest rates; and
the main areas to re-think or modify post-Brexit.
The survey questions were therefore grouped in two parts; first on the current approaches and practices and the second on the design issues and potential changes. Appendix C details the questions we asked in the survey.
The survey was sent to the Chief Actuaries of most major life insurance groups in the UK, in particular those with material volumes of immediate annuity business. In addition, the survey was also sent to firms writing a mix of other business such as protection and unit-linked and with-profits savings business.
We attempted to keep the length of the survey reasonable and hope it was not too onerous to complete. We are grateful to those who took the time to contribute to the results.
4.3 Survey Results
The response rate is considered healthy for this type of survey. The responses have been from firms of varying sizes, which cover a wide variety of product offerings in the UK. In the interests of data protection and commercial confidentiality, individual responses have been treated in strictest confidence. For the purpose of this report, all results have been presented in an aggregate format or have been made anonymous.
The survey results on the profile of respondents and current practice are presented in this section, whereas the results on the current challenges and aspects of the risk margin where firms would like to see changes, particularly post-Brexit, are presented in section 6, where we discuss these issues and potential options.
When presenting our analysis, we have also included the context of our findings, by including a profile of respondents, where relevant.
4.4 Respondent Profile
4.4.1 Size of respondents
The survey received participation from a wide spectrum of respondents (14 responses in total) ranging from small to large businesses in terms of their in-force liabilities. We have categorised respondents by the size of their technical provisions at 31 December 2017 and the results are summarised in Figure 4.

Figure 4. Size of respondents.
We use the following definitions when referring to the technical provisions of the respondent:
Small: less than £5bn;
Medium: more than £5bn, but less than £10bn;
Large: more than £10bn.
The technical provisions include unit reserves, and are before allowance for TMTP, which mitigates the impact of the risk margin at the date of Solvency II implementation.
4.4.2 Lines of business
We asked respondents about their material lines of business.
As shown in Figure 5, unit-linked and protection were the most common lines of business offered by the respondents. There was also a broad range of other lines of business.

Figure 5. Lines of in-force business.
Although there were a few monoline respondents, most offered two or more lines of business. About 45% of the respondents offered three or more lines of business.
Firms are however expected under Solvency II to manage the impact of risk margin for new business written under the new regime. We therefore expect firms open to new business to be more active in managing the risk margin.
Consequently, we also asked the respondents about their material lines of new business.
As shown in Figure 6, unit-linked and protection were the most common lines of new business. There was also a broad range of other lines of business.

Figure 6. Lines of new business.
4.4.3 Solvency model used by respondents
As shown in Figure 7, the standard formula was the most common model used by the respondents, although some respondents used internal models.
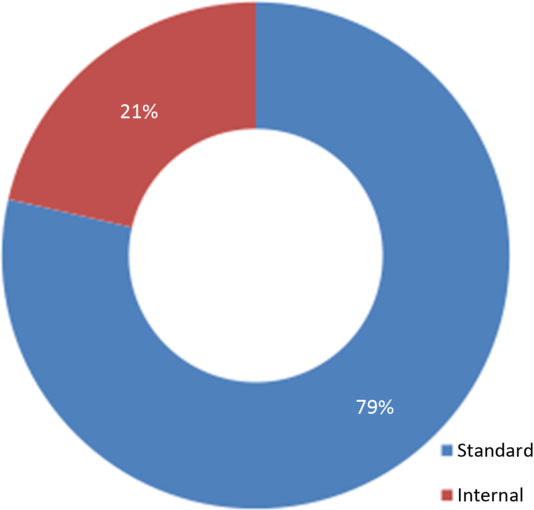
Figure 7. Solvency model.
The internal model respondents include those using partial internal models.
For these respondents, we also asked which risks were internally modelled. The main response is that the model is partial because some blocks of business are on the standard formula.
All respondents using internal models are large firms.
4.4.4 Risk margin measurement
One of the main inputs to the risk margin calculation is the underlying time-zero risk capital amount. The calculation of risk capital used for risk margin purposes (RM SCR) can differ from the SCR for Pillar 3 disclosure purposes. For example, the RM SCR cannot recognise the impact of the MA or VA on SCR stresses.
We asked if there is any material difference in the methodology (apart from those required by the regulations) to calculate the underlying risk capital between RM SCR and SCR for risks included in the risk margin. None of the respondents mentioned any differences – presumably other than these inherent differences.
We asked if there are any underwriting risks treated as hedgeable for risk margin. The results confirmed that all respondents, including the internal model ones, include full allowance of underwriting risk capital in their calculation.
We asked if there any market risks treated as not hedgeable or residual. We expected the internal model firms to have some allowance; however, only one respondent makes allowance for certain non-traded risks (and potentially interaction between market and underwriting risks). As expected, none of the standard formula respondents have any residual market risk capital within risk margin calculations.
We asked the respondents about their RM/RM SCR and RM/BEL ratios, and, where they offer material annuity business, to split the results by annuity and non-annuity portfolios.
The survey results confirmed that at 31 December 2017, the RM/RM SCR ratios varied from 70% to over 100% for annuity business and from 45% to 60% for non-annuity portfolios. For the same period, the RM/BEL ratios varied from 5% to 8% for annuity and from 1% to 4% for non-annuity portfolios.
The respective RM/BEL ratios at 31 March 2017 varied from 7% to 11.5% for annuity and from 1.2% to 5% for non-annuity portfolios, showing the relative sensitivity of different business to movements in interest rates. The EIOPA risk-free rates were then about 30% lower at initial durations, reducing to 15% near 10 years and 6% at 20 years.
The ratios varied materially depending on the solvency model used, with the ratios being higher for standard formula respondents compared with internal models. Similarly, the mix of business also impacted the results, with higher ratios for monoline business, presumably owing to the relative lack of risk diversification.
4.4.5 Risk margin under own assessment – Pillar 2
Pillar 2 of the Solvency II regime includes firms’ own assessments of the risks faced. We were interested in how firms view the risk margin within their Pillar 2 assessments. We therefore asked whether firms hold some form of risk allowance for non-hedgeable risks on their Pillar 2 balance sheet.
The survey showed that two-thirds of the respondents do hold a risk margin within their Pillar 2. We asked these respondents whether it is calculated on the same basis (the same one-in-200-year non-hedgeable stresses and methodology) as Pillar 1, and, if it is different, in which areas do they diverge, for example, cost of capital, risks, run-off method, discount rate, etc.
We expected the internal model firms in particular to have a different allowance for the risk margin in Pillar 2 and expected the main areas of divergence to be more realistic firm-specific cost-of-capital and discount rates. The survey revealed that 83% of respondents hold the risk margin on the same basis as Pillar 1, including all internal model respondents. Where respondents use a different basis, this mainly relates to a different discount rate being used instead of EIOPA’s risk-free rates.
Overall, we consider that it shows that firms may view the risk margin as a necessary component of the market value of liabilities, rather than an unnecessarily prudent margin or additional capital, on top of the risk capital. However, in some cases, it may reflect operational simplicity.
4.4.6 International Financial Reporting Standards
The International Accounting Standards Board (IASB, 2017) have published International Financial Reporting Standard 17 (IFRS 17), which includes a risk adjustment similar to the risk margin. Given that firms are preparing for the implementation of IFRS 17, we asked if they have considered the approach to be used for calculating the IFRS 17 risk adjustment. See section 8.1.7 for further information on the IFRS risk adjustment and a comparison with the risk margin.
The responses to this question were limited.
Three respondents had considered their approach to IFRS 17. Of these, one unit-linked insurer expected to be in line with the Solvency II risk margin and two are exploring other approaches including a confidence interval and a PAD.
A further three respondents had not considered their approach at the time of the survey.
A further three respondents either stated that they are not subject to IFRS or that they are considering moving away from IFRS. These may be non-listed or mutual insurers.
5. The Working Party’s Risk Margin Model
5.1 High-Level Summary of Model and Purpose
The working party has developed a simple model to carry out sensitivity analyses to show the volatility of the risk margin to key assumptions built in the current risk margin methodology and to assess the impact of alternatives to the current approach discussed later in the paper.
The model projects the results for a monoline annuity firm, writing immediate annuity business with no reinsurance. It projects benefit and expense cash flows for an assumed age/gender mix. Details of the model are set out in Appendix D.
The modelled SCR assumes no market and counterparty default risk (since no reinsurance is assumed) and allows for only longevity, expense and operational risks, in each case in accordance with the standard formula.
We are aware that the longevity stresses typically used by internal model firms for annuity business are somewhat larger than those required by the standard formula, because internal models stress both the mortality rate and the trend, whereas the standard formula stresses only the mortality rate. As an illustration of this, PwC (2018) states that the average increase in life expectancy at the age of 65 years resulting from the longevity stresses in internal models at 31 December 2017 is an increase of around 3 years, whereas the increase in our model is less than 2 years. Therefore, our model is likely to underestimate the amount of the risk margin for internal model firms.
The working party believes that our model is a reasonable means of illustrating simply the properties of the risk margin.
For the purpose of presentation in this paper, we have mainly used relative measures to show the impact on the risk margin, such as the percentage of BEL or SCR and/or the change in risk margin relative to December 2015.
The working party believes that the risk margin as a percentage of the modelled SCR is a useful metric, as most of the sensitivity testing and proposals considered in the paper are not likely to have any direct impact on market risk.
5.2 Base Model Results
The base position includes an allowance for MA of 100 bps in the calculation of BEL. Neither the RM SCR nor the discount factors used for the cost of capital allow for the MA. The allowance for MA relates only to the BEL used in the denominator in the ratios or in the calculation of the SCR. Unless stated otherwise, the results do not allow for transitional measures or reinsurance.
Table 1 presents the base modelled results at 31 December 2018 for key metrics. Appendix D also presents the sensitivity of base results to various changes in assumptions made.
Table 1. Base Results

5.3 Sensitivity to Interest Rates
The risk margin is particularly sensitive to changes in risk-free rates. To show this volatility, we have run the model with monthly EIOPA risk-free rates from December 2015 to December 2018 and have shown the results in section 3.1.2 for both movements in the risk margin as a percentage of the December 2015 risk margin and movement in the risk margin/BEL ratio as percentage of December 2015 risk margin/BEL ratio.
Figure 8 shows the movement in risk margin/BEL ratios for each year-end since the implementation of Solvency II, along with the sensitivity to a parallel shift of 50 bps down and up to the December 2018 curve. The Figure also shows the 12-year EIOPA spot rates, corresponding to the duration of modelled liabilities.

Figure 8. Variation of risk margin with and sensitivity to risk-free rates.
This volatility of the risk margin to interest rates represents one of the challenges in managing it in a rapidly changing interest rate environment. Interest rate changes have a dual impact on risk margin. With a reduction in the risk-free rate curve, firstly the BEL is re-valued upwards and so is the stressed BEL to calculate the individual risk capital, resulting in larger risk capital.
This effect is amplified for firms using MA or VA, as these measures are ignored for the purpose of the risk margin calculation. The BEL and stressed BEL used to calculate the risk capital for risk margin purposes cannot use the MA or VA, thereby increasing RM SCR in comparison with the SCR for Pillar 3 disclosures.
Secondly, the costs of capital are discounted at lower rates, resulting in a higher overall present value for the risk margin.
5.4 Assessment of Alternative Risk Margin Proposals
We have used the model to assess and present the financial impact of certain alternative options, and where relevant we have shown this impact relative to the base results. Furthermore, to assess whether the alternative proposals are helpful to mitigate the volatility issues highlighted in earlier sections, we have presented the results over time to show the volatility of the proposal in comparison to the base result.
The summary results are presented throughout section 6..
6. The Cost-of-Capital Method – Recalibration
In this section, we focus on suggested changes to the cost-of-capital method, based on amendments proposed by the insurance industry and also the IFoA, after Solvency II came into effect. Many of these changes were proposed in the post-implementation enquiries summarised in section 3.5.
We set out the key areas of change proposed and our views, including the results of our modelling and of our survey.
6.1 Cost-of-Capital Rate
The Level 2 Delegated Regulation, rather than the Level 1 Directive, specifies the 6% cost-of-capital rate used in the risk margin.
As stated in section 3.5.1, EIOPA (2018) focused in the review almost entirely on the cost-of-capital rate, and the conclusion was that if anything 6% was too low:
In view of the results of the CoC calculations in the range from 6.7% to 7.8%, EIOPA recommends that the currently applicable CoC rate of 6% should not be changed.
Not surprisingly, this conclusion received, and indeed continues to receive, significant pushback from the industry, who have consistently argued that 3−4% would be a more appropriate rate, as was typically used for embedded value calculations.
Table 2 sets out summaries of the key points made in support of a lower rate, EIOPA’s responses and the views of the working party relating to the responses from EIOPA.
Table 2. Proposals for a Lower Cost-of-Capital Rate

Offsetting these reductions is the view that the cost-of-capital rate could well increase following an extreme stress, that is, in the scenarios envisaged within the SCR calculation. Although not required by regulators to date, the SCR is meant to represent a stress to the full balance sheet, including the risk margin, and that firms should be required to reflect this. (Note that we are concerned here only with the cost-of-capital rate and not the cost of capital overall. It may well be that following a large stress, the non-hedgeable SCR itself reduces materially.)
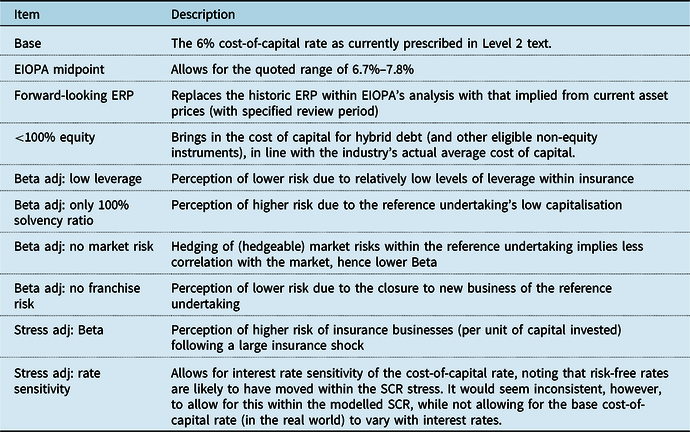
It is noted, however, that the 6% cost-of-capital rate will be reviewed as part of the 2020 EIOPA review. While we do not express a view here on the rate itself, we set out below the analysis steps that we believe should be allowed for. This is on the assumption that a cost-of-capital approach, calibrated independently of reinsurance pricing or market transaction data, is retained and is notwithstanding the various weaknesses of the cost-of-capital approach described elsewhere in this paper. Figure 9 is illustrative only and not to scale.

Figure 9. Illustration of steps that should be considered in defining the cost-of-capital rate.
Each step in Figure 9 is described in Table 3.
Table 3. Descriptions of Steps in Figure 9
The members of the working party do not have a consensus view on whether, having regard to the above factors, the current cost-of-capital rate of 6% is correctly calibrated.
A solution was also proposed and designed to reduce the sensitivity of the risk margin to interest rates, namely that the cost-of-capital rate (which it should be noted is already an excess cost over risk-free) should depend on the risk-free rate:
 $$Cost \hbox- of\hskip-1pt\hbox-capital = \left[ {x\% *risk \hbox-free\,rate} \right] + \left[ {y\%\ fixed\, addition} \right]$$
The Chief Risk Officers Forum (CRO Forum, Reference Forum2008, page 35) researched the cost-of-capital rate during the development of Solvency II. The Forum’s report includes
The Cost-of-Capital rate is sensitive to changes in the level of risk-free rate, increasing by 0.3% to 0.4% for every 1% increase in the risk-free rate.
This suggests that x% might be 30−40%.
The field testing of ICS described in IAIS (2018), discussed in more in detail in section 7.7, is also considering an approach where the cost-of-capital rate = 3% + risk-free rate (i.e. x% = 100% in the formula above), albeit the working party is unaware of any theoretical justification for this particular choice.
EIOPA (2018, page 347) also argued that “empirical and academic evidence to support a theoretical link between the risk-free rate and the equity risk premium is mixed” and quoted the work of Damodaran (2016), amongst others, which suggests that although long-term historic data suggest a positive relationship between the equity risk premium and the risk-free rate, more recent experience, if anything suggests no relationship or even the opposite.
We note that while allowing the cost-of-capital rate to itself vary with interest rates would reduce the sensitivity of the risk margin to interest rates, it could add to practical hedging difficulties.
6.1.1 Working party survey on cost of capital
In our survey, we asked firms if they would support making the cost-of-capital rate dynamic that is linking cost of capital with the interest rate environment and/or firms’ actual cost of capital, and the reasons why.
As shown in Figure 10, a large majority supported making the cost-of-capital rate dynamic. The respondents who did not support it explained that it may not work for their block of business – potentially making managing the risk margin more difficult.

Figure 10. Support for dynamic cost-of-capital rate.
The main points gleaned from the respondents were
Help with interest rate sensitivity – it may help with volatility or reduce the size of risk margin, possibly making volatility impacts less material.
Theoretical arguments – intuitively, it seems reasonable for the cost-of-capital rate to have some dependency on the level of market interest rates, since investment decisions are made within the wider economic context including the level of risk-free rates.
Ease of implementation – a change to the cost-of-capital rate would probably be the easiest to achieve with almost no to little change.
Potential challenges – however, depending on the how cost of capital is linked to interest rates – it may be difficult to identify suitable parameterisation of the cost-of-capital rate to achieve the desired risk margin behaviour for different lines of business. If not considered carefully, we might end up in situation where risk margin behaviour could be unintuitive, for example, a rising risk margin as interest rates increase.
6.1.2 Model results on cost of capital
Figure 11 presents the model results for relative movement of RM/BEL as a percentage of the December 2015 ratios for a change in the cost-of-capital rate from the current 6% to being calculated as 35% of risk-free interest + 5.4%, where 5.4% is chosen so that the formula provides similar results to the base at December 2015.

Figure 11. Impact of changing the cost-of-capital rate to dynamic.
The results are shown relative to the base results.
The results show that relative to the base position, the change in cost-of-capital parameters will result in lower volatility in the risk margin. The proposal results in 50% lower volatility over this time period when measured by the standard deviation of RM/BEL.
In practical terms, this alternative will result in different cost-of-capital rates being applied to the amount of capital for every period. Note that the cost-of-capital rate (based on average duration for the modelled portfolio) for December 2018 is just under 6%. However, during times of high interest rates, this alternative could also result in materially higher risk margins.
6.2 Allowance for Longevity Reinsurance/management Actions
One key argument made against the risk margin for annuity business is that longevity is, unlike some other demographic risks, largely hedgeable.
The Comité Européen des Assurances (CEA) and the Groupe Consultatif Actuariel Européen (Groupe Consultatif) define a hedgeable risk under Solvency II as (see CEA and Groupe Consultatif, 2007, page 31):
A risk associated with an asset or an obligation that can be effectively neutralised by buying or selling a market instrument (or engaging in a contract with a third party in an arm’s length transaction under normal business conditions), whose value is expected to change in such a way as to offset the change in value of the asset or liability caused by the presence of the risk.
Longevity risk arguably falls within this definition.
However, although the exclusion of hedgeable risks was a major criterion in the development of the Solvency II risk margin, the wording of the regulations took a different route. The concept of hedgeable risk is not mentioned in the Level 1 Directive or Level 2 Delegated Regulation at all. Rather, in the Level 2 Delegated Regulation, the SCR used in the risk margin projections is calculated under the assumptions that:
market risk is minimised (by de-risking assets and, when required, by hedging), but
the underwriting risk is the same as for the transferred business, allowing for reinsurance in-force.
Therefore, under the current Solvency II regulations, longevity risk cannot be excluded from the risk margin even if it is considered to be hedgeable.
When the ABI gave its initial evidence to the Treasury Committee, it revealed that the industry, in particular Legal & General, had made a detailed proposal to the PRA to allow for the ability to reinsure longevity in the risk margin within the constraints of the Level 1 and Level 2 text.
At the Treasury Committee’s request, the detailed proposal was published as part of the further written evidence (ABI, 2017).
The proposal was outlined to EIOPA in ABI (2018).
In summary, this involves an insurer approving a management action that provides that it would seek reinsurance to cover certain liabilities in specifically defined circumstances, namely when it de-risks its assets.
Owing to the provision in the Delegated Regulation that the reference undertaking is assumed to adopt management actions consistent with those of the insurer, those defined circumstances would be deemed to occur upon the transfer to the reference undertaking, and therefore, the reference undertaking would be treated for the purposes of the risk margin calculation as having put in place longevity reinsurance in line with the management action.
That management action would be reflected in determining the reference undertaking’s SCR for the purposes of calculating the risk margin.
In practice therefore, the longevity risk part of the risk margin would be replaced by the expected cost of reinsurance, allowing for a period to put the reinsurance in place.
This would have the benefit of producing a risk margin consistent with the market price for longevity risk, which would seem consistent with the intention of the risk margin.
As a consequence:
the resulting risk margin would typically be lower than the present method, in current conditions; as indicated in section 3.1.3, we understand anecdotally that the market cost of reinsurance for a typical annuity allows for around 5% margin above the BEL, depending on the characteristics of the portfolio;
the resulting risk margin would be significantly less sensitive to interest rates; and
this would also avoid artificial incentives to transfer risk outside of the UK/EU.
The disadvantages of the approach, which we understand that the ABI acknowledged in its discussions with the PRA and intended to address as part of any implementation, include
technical provisions would potentially be dependent on fluctuations in reinsurance market pricing. Insurers might argue for a through-the-cycle average given the long-term nature of the risk margin calculation but that would then add back incentives to transfer risk in times when market pricing was particularly competitive;
the reinsurance market is arguably not sufficiently deep, liquid and transparent for market pricing to be readily and reliably observable, particularly for insurers who do not participate in the market (or who would not participate if this solution were permitted); and
not all longevity risk is easily hedgeable (e.g. deferred annuities) which would raise the question of where the boundaries of this approach should be drawn.
The PRA (2017) initially rejected this proposal, arguing in its response to the Treasury Select Committee that:
the management action proposed was hypothetical and would apply only in very specific circumstances;
it would therefore reduce the risk margin without any corresponding reduction in actual risk;
the future actions would be binding even if they might not be economically prudent;
the use of such future hypothetical actions might be applied elsewhere to reduce Solvency II capital requirements.
As discussed in section 3.5.2, the PRA later became more sympathetic to this, or similar proposals, but put any implementation on hold pending clarity on the UK’s future relationship with the EU.
6.3 Inclusion of Matching Adjustment in Risk Margin
The Level 2 Delegated Regulation requires the future costs of capital to be calculated using the basic risk-free rate.
However, it is silent on the use of the MA or VA in the calculation of the RM SCR.
EIOPA (2015, page 3) addressed this issue in the Guidelines on the implementation of the long-term guarantee measures, where it states that
Insurance and reinsurance undertakings that apply the matching adjustment, the volatility adjustment, the transitional measure on the risk-free interest rates or the transitional measure on technical provisions should assume that the reference undertaking does not apply any of these measures.
For UK annuity books, where the MA is typically used for the BEL, this means that in the risk margin the projected SCRs held for longevity risk are based on the increase in technical provisions calculated at the risk-free rate, rather than using the MA, and hence are significantly higher.
One seemingly easy change, which requires only changes to EIOPA’s guidelines, is that this restriction be relaxed and that insurers using the MA (or VA) can assume that the reference undertaking does so.
However, the history of the EIOPA consultation on the Guidance shows that this is actually not so straightforward. In order to apply the same level of MA as the insurer, the reference undertaking would need to hold to maturity a similar portfolio of credit assets.
This would logically require, as indeed was initially proposed by EIOPA in the first drafts of its Guidance, that the SCRs projected for the reference undertaking should include a SCR for the credit risk associated with the assets supporting the MA, which would materially offset any gain.
The industry also raised the issue of the discount rate used to value the projected costs of capital, but noted that this required a more fundamental change to Level 2. The proposal made by one commentator to set the discount rate to the cost-of-capital rate (see section 6.6) is also relevant here.
6.3.1 Working party survey on inclusion of long-term guarantee measures in risk margin calculation
We asked firms whether they would support use of VA and MA in calculation of RM SCR and why. We also asked whether they would support use of VA and MA in the risk-free rates to discount the future cost-of-capital amounts.
The survey results are presented in Figure 12, along with the main points put forward by the respondents.

Figure 12. Support for allowing for VA and MA in risk margin calculations.
VA in RM SCR
The main points in favour were that:
VA may not have a material impact on the risk margin but possibly applies to a wider range of firms;
there is some theoretical justification for this, since a third party taking on the liabilities would look to minimise its capital requirements and use the VA to do this in the same way that the current undertaking does; and
it would also reduce calculation complexity by removing the need to calculate SCR with and without VA.
The main points against were that:
it is not clear to respondents whether the proposal will really mitigate volatility in the risk margin; and
applying VA to RM SCR, without including RM SCR for spread risk, seems contradictory. It is unclear how VA can be earned with a fully spread risk-free portfolio.
MA in RM SCR
Even respondents who supported the proposal highlighted that it may not be totally consistent with the non-hedgeable SCR approach that implies a reference portfolio based on de-risked assets. The main issues highlighted were
consistency with the transfer scenario being envisaged in the rules, unless credit risk inherent in the MA was included in SCR run-off calculations or the MA allowed was reduced by removing credit risk;
although the proposal may reduce the size of risk margin, it is not clear whether it will really mitigate its volatility;
applying MA to RM SCR, without including in RM SCR for spread risk, seems contradictory. It is not clear how can the MA be earned with a fully spread risk-free portfolio.
VA/MA in risk margin discounting
Although about 50−60% of respondents supported these proposals, it is clear from comments that they were less convinced, with the main points being:
while some assets may be available providing returns above swaps with minimal additional risk, it is possible that the reference undertaking’s assets backing liabilities might not support the use of a VA and in particular the MA; and
inconsistency with the existing Level 2 Regulations
6.3.2 Modelling results on inclusion of long-term guarantee measures in risk margin
The working party’s model shows that including MA allowance in risk margin does not help materially with the volatility of the risk margin. In comparison with the base position, the proposal reduces the volatility by less than 10% (as measured by standard deviation of RM/BEL) from the implementation of Solvency II to the end of December 2018.
However, the proposal helps with the size of the risk margin. Figure 13 presents the model results for RM/BEL ratios where the risk capital for the risk margin (RM SCR) includes allowance for MA relative to the base results. The figure also shows the impact on the risk margin, if MA is allowed for in the discount rate as well as in RM SCR.

Figure 13. Impact of allowing for MA in the SCR and discount rate for risk margin calculations.
To show the results over time, we have assumed a constant MA throughout this period.
The results show that inclusion of the MA in calculating RM SCR reduces the size of the risk margin by 14%, whereas allowing for MA in the discount rate in addition results in an overall reduction of about 23%.
However, as noted above, there are theoretical challenges to allowing MA within the discount rate to calculate risk margin.
In accordance with our model, allowing for the credit risk associated with the assets held to maturity to back the SCR would result in an increase in RM/BEL% (with MA in discount rate) from 6.5% at December 2018 to 7.8%, thus removing most of the benefit of allowing for MA.
6.4 Diversification
Recital 18 of the Level 2 Delegated Regulation states that the risk margin “should take the diversification of the whole portfolio into account”.
However, the detailed rules require that this is not applied when an insurer writes life and non-life business, with the two blocks of business assumed to be taken over separately by two different reference undertakings, although we note that this is consistent with EU regulation not permitting new composite insurers.
Similarly, for a group, the risk margin is calculated at entity level, but for group purposes the insurer is not allowed to assume additional diversification benefits apply, but must simply add the risk margins from each group entity.
Both of these assumptions are inconsistent with the calculation of the SCR and appear artificial.
Indeed, the working party notes that for a properly market-consistent and objective calculation of the risk margin, the capital required for each risk and the diversification taken into account should be a market level of capital and diversification. This point was made by the IAIS (2006, page 10) in its review of the IASB’s accounting standards project and was quoted in CEIOPS’ (2007, page 31) Advice to the European Commission (see section 1.3 of Appendix B):
Pooling and inter-portfolio offsetting across risk types can give rise to a benefit to be reflected in the measurement of the liabilities, only to the extent that they are recognised in market transactions. To the extent that the market does not reflect such benefits or to the extent that the insurer achieves greater or smaller pooling or offsetting benefit than the market, the effect is company-specific and the IAIS believes this should be included in the solvency capital requirement rather than in the insurance liabilities.
One could argue that one reason that the risk margin, as calculated under Solvency II, exceeds the market price of longevity risk transfer into the international markets is that the Solvency II calculation gives no credit for the diversification benefit relating to longevity enjoyed by international reinsurers who, for example, may have significant exposure to senior life mortality risk in the United States (see also section 3.1.3).
6.5 Non-Independence of Risks
One key point raised by the industry in its response to EIOPA is that the method of projecting the SCRs can lead to an overstatement of the risk to the reference undertaking. To illustrate this, the ABI (2018) submission to the EIOPA consultation includes an example of an annuity where the risk margin, calculated in accordance with the Solvency II standard formula, provides more capital over time than would be required to cover the risk of zero mortality.
Essentially, the risk margin as construed assumes that the reference undertaking is recapitalised at each period end and only holds capital against risk for the next year. The SCRs projected are unconditional on events in previous periods.
However, in practice, the risks in each period over a product lifetime are not independent. For instance, certain risks are non-repeatable: that cancer can only be cured once is a simple example. Therefore, if there were losses in one period, the SCRs in future periods might be expected to be lower. This is important, as the rationale for a 6% cost-of-capital rate in the risk margin calculation is that the capital injected each period is at risk – if losses in one period would mean lower SCRs in future periods, then either the cost of capital may be too high or the projected SCRs too high. To reflect this properly would require a full stochastic projection of the future evolution of the business.
The ABI proposes that an alternative approach, and one more consistent with how an actual reference undertaking would price a transaction, might be to allow for an “extreme but plausible lifetime shock”. The simple approximation proposed to deal with this is to allow in the projected SCRs for a time scaling factor, where a tapering parameter λ (0 < λ < 1) is applied to future projected SCRs:
 $$SCR'\left( t \right) = {\lambda ^t}*SCR\left( t \right)$$
where SCR(t) is the unconditional projected SCR at time t and SCR’(t) is used in the risk margin.
The detailed proposal is the subject of a separate ABI paper “Addressing the Size and Volatility of the Solvency II Risk Margin Using a Tapering Approach”, which is summarised in ABI (2018), page 47. The ABI did not make this paper available to the working party, so we are unable to comment in detail – in particular on how the choice of λ could be justified or even whether the method is theoretically sound.
The ABI submission to EIOPA included illustrations with λ set equal to 0.97, 0.92 and 0.84, with high-level explanations for each. However, it is our view that an assumed 16% or even 8% reduction in SCR in every future year would be difficult to justify on the grounds of non-independence of future risks and would clearly make a very large difference to the result.
The working party notes that the theoretical justification for this tapering approach rests on the argument that the cost-of-capital rate cannot be 6% for capital that cannot be lost.
In practice, the proposal is equivalent to increasing the discount rate used in the risk margin calculation to
 $$(1 + risk \hbox-free)/\lambda - 1$$
There are therefore some similarities with the proposals of Hans Waszink discussed in section 6.6.
We have estimated the impact of this approach by assuming λ = 97.5%, that is, in every future projection year, the SCR would reduce by 2.5%. See Figure 14.

Figure 14. Impact of allowing for non-independence of risks (λ = 97.5%).
It can be seen that it helps with the magnitude of the risk margin. Furthermore, this also marginally helps with volatility when compared to the base position.
6.6 Hans Waszink’s Proposal
An interesting contribution to the risk margin debate was made by Waszink (Reference Waszink2013) in a paper presented to the Actuarial Studies in Non-Life Insurance Colloquium. He argues that:
the cost-of-capital method fails to satisfy a number of desirable properties, in particular that it has no upper bound related to the SCR (or to the maximum value of the liability); and
the issues can be resolved if the cost-of-capital rate is also used as the discount rate in the risk margin calculation, which he reasoned was the theoretically correct approach.
Waszink also made similar arguments to the EIOPA consultations in 2009 and 2017, but it rejected his suggestions, opining that the risk margin could theoretically exceed the SCR.
The Waszink proposals and EIOPA response have also been discussed in the pages of The Actuary magazine, being promoted by Woods, B. (Reference Woods2016; Reference Woods2017).
The working party respectfully disagrees with the arguments made by Waszink and Woods, as outlined in our reply in The Actuary (Risk Margin Working Party, 2018). We note the reply from Woods, B. (Reference Woods2018), but would still argue as follows:
The risk margin is determined as the cost of capital required by the reference undertaking which receives the whole of the firm’s liabilities for run-off and is itself subject to Solvency II. The reference undertaking must itself hold a risk margin, because of the risk of losing its own capital. Waszink developed his approach on the basis that the risk margin should not exceed the SCR. We do not believe that this approach is theoretically justified, as it assumes that the risk capital cannot be lost again during run-off and ignores the requirement for the reference undertaking itself to hold a risk margin, as well as the requirement of the reference undertaking to finance its SCR on an ongoing basis even where it is never lost.
However, as indicated in section 3.3.3, the risk margin is based on the implicit assumption that the security of policy benefits is to full Solvency II standards during run-off. Although this assumption could be challenged, our views above are based on the belief that at present Solvency II clearly intends the assumption to hold.
6.7 Summary
Figure 15 summarises the modelled estimate of the risk margin as percentage of BEL as at 31 December 2018 for the various options discussed in this section.

Figure 15. Summary of impact of various options.
6.8 Amendments to Regulations
These different proposals require different levels of regulatory approval or amendments to the regulation. Our understanding is set out in Table 4.
Table 4. Amendments to Regulations
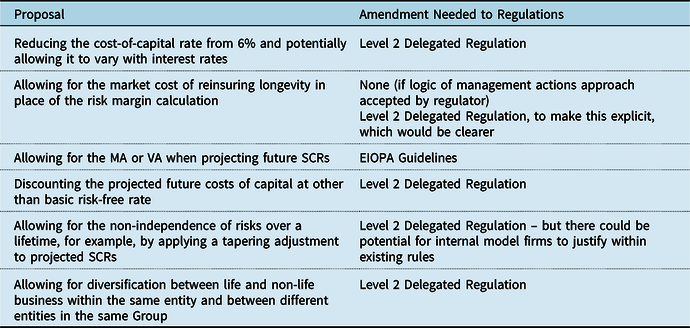
6.9 EIOPA 2020 Review
As no changes are made as a result of the 2018 review by EIOPA and the Commission (see section 3.5.1), the next opportunity for changes to the risk margin within Solvency II will be in the fundamental review of Solvency II that the Commission is required to undertake 5 years after implementation.
In February 2019, the European Commission (2019) sent a request to EIOPA in connection with this review, which requires EIOPA to respond with advice by 30 June 2020. The input sought is technical and does not necessarily prejudge the outcomes of the review nor prevent wider consultation, but nevertheless we feel it can be taken as a guide to the Commission’s thinking.
Rather disappointingly in the working party’s view, the scope specifically excludes any changes to the cost-of-capital method itself. Indeed, EIOPA has been instructed to “assess the appropriateness of the design of the risk margin, without challenging the approach based on the cost-of-capital” (ibid., page 4).
In our view, some of the issues highlighted in this paper and elsewhere, such as the high sensitivity to interest rates, may stem from the cost-of-capital method itself, as much as any particular calibration. Some of the modifications we have considered to the cost-of-capital method (such as a cost-of-capital rate that varies with interest rates) are more short-term fixes to produce a more market-consistent answer, rather than solving the fundamental issues with the risk margin as currently constructed.
Instead, EIOPA has been asked to revisit many of the issues highlighted but dismissed in the 2018 review, specifically:
the design of the risk margin, in light of any information on actual transfer prices of liabilities, itself the subject of a separate Call for Information from the European Commission (2018);
the assumption as to the asset-mix of the reference undertaking, and potential interactions between recognition of market risk and the use of the VA and MA in the risk margin;
the assumptions supporting the cost-of-capital rate, in particular the absence of leverage and the derivation of the equity risk premium; and
the use of a fixed cost-of-capital rate for all insurers and reinsurers.
It is not clear to us whether the scope of these questions, and in particular the final bullet point, might extend to considering a cost-of-capital rate that varies with interest rates or a technique similar to the ABI’s tapering suggestion.
Notwithstanding the above scope, in section 7, we consider potential alternatives to the cost-of-capital method.
7. Alternatives to the Cost-of-Capital Method
In section 6, we considered the various amendments proposed by commentators, particularly the insurance industry, to the Solvency II methodology for the risk margin. However, these all preserved the framework of the Directive and, in particular, the underlying methodology of applying a cost-of-capital rate to projected capital requirements.
The working party’s view is that a more fundamental re-think may be needed, and indeed may be possible as part of the more fundamental Solvency II review due by 2021, or in the UK, post-Brexit.
In this section, we outline some alternative methods that might be considered. In section 8, we set out the criteria against which these alternatives might be judged, together with our evaluation of each alternative and our conclusions on which methods have merit for consideration, depending on the future context.
7.1 Alternatives Considered in Solvency II – Run-off Percentile
As noted in Appendix B, when Solvency II was originally being calibrated, an alternative to the cost-of-capital method was considered, a percentile approach. Here, the risk margin was given by the difference between the 75th percentile of the underlying probability distribution (over a full run-off) and the BEL, subject to a minimum of half a standard deviation to allow for strongly skewed distributions.
The choice of 75th percentile was taken as an appropriate level of confidence for a firm to be able to meet its liabilities over a full run-off after an adverse event. However, CEIOPS (2007) noted that there was no evidence that this was consistent with the market price for transferring liabilities to a third party. Nevertheless, the results of the second quantitative impact study (QIS 2) suggested that, in aggregate, this method produced similar results to the cost-of-capital method for the EU insurers who participated in the study.
It was assumed – in contrast to the VaR methods discussed in section 7.3 and the Prudence-MOCE (P-MOCE) and Percentile-MOCE being considered in ICS (see section 7.7) – that this 75th percentile would be based on a full run-off distribution and would not necessarily be lower than the SCR, which is based on a 99.5th percentile but over only a 1-year time horizon.
CEIOPS noted that this provided protection in a run-off scenario (see section B1.3 of Appendix B), but ultimately rejected this approach on the basis that there was no evidence of a link to actual transfer prices in the market. Indeed, the theoretical rationale for this approach is more an “own fulfilment” value than an attempt to reproduce a market-consistent exit value.
However, as noted in section 8.1.2, the cost-of-capital method that was adopted instead may be more market-consistent in theory, but does not necessarily appear to be so in practice.
Note also that if this percentile were set at 50%, that is, approximately equal to BEL (technically a 50th percentile is only equal to BEL if the mean equals the median of the distribution), then there would be no risk margin (see section 7.6).
7.2 Provision for Adverse Deviation (PAD)
Traditionally, when actuaries were asked to allow for uncertainty in setting assumptions, the approach would have been to add a margin, or PAD, to the best estimate assumptions. Typically, a PAD would be set individually for each assumption, for example, mortality, expenses, etc. These PADs were often judgemental and not set with detailed regard to any probability distribution, nor was there any requirement to calculate the equivalent confidence level for a given set of PADs. Often, diversification benefits were also not taken into account between different risks, that is, to the extent that the PADs did represent a level of confidence, this was typically assessed for each risk in isolation, but then the stresses were applied simultaneously.
In modern actuarial terms, such an overall set of prudent assumptions could be considered as a single combined scenario of risk factor realisations, analogous to a scenario generated by an internal model, albeit fully specified rather than random. In theory, it would then be possible to determine the implied confidence level for a given set of PADs by referencing the internal model capital distribution. If a certain confidence level were to be targeted, the actuary could then adjust some or all of the individual PADs until the desired outcome was achieved. This process might seem a little onerous, however, and is open to the obvious challenge that if the capital distribution is already known, why not simply pick the desired point from that distribution without the need to derive a set of equivalent PADs. This leads us directly to the VaR approaches described in section 7.3, although these approaches do not in general rely upon the existence of an internal model or knowledge of the full capital distribution.
We note in Appendix E, section E3 that a PAD type approach is currently favoured by the regulator in China as part of its new regulatory regime, where a set of combined stresses is prescribed.
Where PADs are set simply for prudence, rather than via some theoretical justification such as to make liabilities market-consistent, then there is an argument that there is some double counting with capital requirements. See section 7.7.1 for further discussion on this topic.
7.3 Value-at-Risk
VaR is the approach required to determine the SCR under Solvency II. It is also known as the confidence level approach. In this approach, the insurer sets its reserves equal to the level at which it is X% confident of remaining solvent over an N-year time horizon. For example, for the Solvency II SCR, X has a value of 99.5 and N is equal to 1 year.
However, VaR approaches can also be used to set the risk margin held in technical provisions on top of BEL. Anecdotally, this is the approach being considered by a number of insurers for the risk adjustment under IFRS 17 (see section 8.1.7 for further discussion).
The Solvency II alternative approach discussed in section 7.1 involves setting X to 75% and N to full run-off of the business.
However, emerging international practice, including ICS, seems to look instead at 1-year time horizons.
We note in section 7.7 that the current field testing of ICS is considering a Percentile-MOCE as an alternative to a cost-of-capital method, based on a range of 1-year percentiles for insurance risks. The field test also suggests a practical way in which these percentiles could be derived without needing a full loss distribution, by simply assuming that overall capital requirement has a normal distribution. As the normal distribution is thinner-tailed than many other distributions commonly used in insurance, this implies a relatively high ratio of the 75th to 99.5th percentile. Of course, while not necessarily applicable to ICS, firms employing internal capital models to produce VaR estimates at a given percentile would not need to apply such simplifications.
The benefits of the VaR approach over the cost-of-capital approach include
computational simplicity, indeed the starting point of the cost-of-capital calculation is the derivation of a VaR-based non-hedgeable SCR. Furthermore, it is possible to derive the risk margin, and hence technical provisions, independently of the SCR;
lower interest rate sensitivity, when compared to a cost-of-capital approach in which the cost-of-capital rate is interest rate invariant.
As with the PAD, some argue that such risk margins involve double counting with the SCR. The working party disagrees, as outlined in section 7.7.1.
The confidence level for the risk margin VaR calculation would likely be specified by the regulator, whether that be EIOPA or the PRA post-Brexit. This differs from IFRS 17, where the calculation is principles-based and the confidence level is based on firm-specific risk appetite.
In section 8.1.9, we consider further the PRA objective of maintaining Solvency II Equivalence, and this would of course have implications for the calibration of any VaR confidence level. Such a confidence level would likely be well below the 99.5th percentile implicitly within the cost-of-capital calculation, as the latter reflects a cost of financing capital as opposed to capital per se; however, this does mean that the resulting risk margin is by definition less that the corresponding SCR for insurance risk.
Under the general VaR approach, there are two main potential calculation methods:
correlation stress testing; and
use of an internal model.
The former is akin to the standard formula calculation for the SCR, albeit with different parameters and in-scope risks. It aims to calculate the required percentile stress directly, through stressing individual risk factors and applying an output correlation matrix to these results. It implicitly assumes multivariate normality of the risk factors, as well as linearity of the aggregate loss function with respect to the risk factors.
The latter involves generation of a full capital distribution, from which the required percentile or confidence level can be read off, and may be preferable to firms who have invested heavily in internal model development for the SCR calculation.
7.3.1 Alternative risk measures
Where risk measures are used as an alternative to a cost-of-capital approach, these might extend beyond simple VaR measures to other measures of risk with more satisfying mathematical properties. Discussions in this area have been a feature of the debate in the non-life sector.
One variant of VaR is Tail VaR (or conditional tail expectation), which attempts to capture the dynamics of the loss function in the tail by taking the expected value of losses beyond a specified confidence level. The main advantage over VaR is that it is allows for the full tail distribution of losses – two risks with the same VaR could have very different exposure beyond the selected confidence level. Mathematically, Tail VaR also satisfies subadditivity requirements, whereas VaR for a set of risks can in theory exceed the sum of the VaRs for subsets of those risks.
Further details on alternatives to VaR, including also proportional risk transforms, are contained in the Educational Monograph published by the International Actuarial Association (IAA; 2018) – see also the discussion in section 8.1.7.
These methods however give rise to computational challenges and have therefore not been considered further in this paper.
7.4 Run-off Capitalisation
Some of the logical flaws in the risk margin highlighted in section 6 result from the way in which the SCR is projected over time, as a succession of 1-year costs of capital.
As stated in section 6.5, the ABI (2018) suggested that the projected SCRs should instead be based on an “extreme but plausible lifetime shock”.
A more appropriate method to derive the total capital requirement for an insurer might look at the lifetime capital required to run-off the book at a defined confidence level, for example, 90% or 95% over a lifetime.
This percentile could be calibrated to a similar level of confidence, for example based on credit rating default data, as the 1-year 99.5th percentile, and be dependent on the term of the run-off.
This could potentially replace both the SCR and the risk margin, thereby absorbing the risk margin into the capital requirements. Alternatively, a risk margin for non-hedgeable risk could still be required within the technical provisions, both in the base balance sheet and in the projected balance sheet simulations. In the latter case, a relatively simple formula for the risk margin would be required. Either way, a run-off approach to capital would represent a more fundamental overhaul of the Directive.
Some insurers used a run-off time horizon in their Pillar 2 Individual Capital Assessment (ICA) under Solvency I, but these suffered from a number of drawbacks or practical concerns at the time. Firstly, the Pillar 2 rules stipulated that firms using run-off models (with some derived run-off confidence level) had to demonstrate that the resulting capital was no weaker than a 1-year one-in-200-year assessment. Secondly, it became clear in the run-up to Solvency II that the new regime would require a 1-year one-in-200-year assessment. A further modelling challenge that existed at the time was around demonstrating intermediate solvency, that is, although the resulting capital may have been sufficient (in, say, 95% of scenarios) to ensure that the firm had positive assets at the end of the book’s lifetime, it was by no means clear for all “pass” scenarios that the firm remained continuously solvent throughout the projection period.
There are some similarities between this and the run-off percentile method (described in section 7.1), except that here the risk margin and SCR would be combined, and the calibration made to an overall failure probability, at a lower (i.e. more prudent) probability of failure.
One example of a proposed regime of annuity-like liabilities based on run-off capitalisation comes in the proposed regime for superfund consolidation vehicles, as per the Department of Work and Pensions (DWP) consultation (DWP, 2018). It essentially proposes regulating these vehicles based on a 99% probability of solvency over the full run-off, with no separate risk margin. The DWP (2018, paragraph 24) define superfunds as:
a superfund is, or contains, an occupational pension scheme set up for the purposes of effecting consolidation of defined benefits pension schemes’ liabilities;
a transferring scheme’s link to a ceding employer is severed on transfer to the superfund;
the “covenant” is a capital buffer provided through external investment that sits within the superfund structure; and
there is a mechanism to enable returns to be payable to persons other than members or service providers.
Developments in this framework could provide a useful pointer for insurance firms which write pension buyout business, which in many respects share similar characteristics, albeit under an insurance rather than occupational pension scheme regime.
7.5 Market Reinsurance Pricing
The risk margin is defined in Recital 55 of the Solvency II Directive as being a margin added to the BEL to ensure technical provisions “correspond to the amount an insurance or reinsurance undertaking would have to pay if it transferred its contractual rights and obligations immediately to another undertaking”.
Therefore, where there is clear evidence of a reliable market price, one could argue that this should be used in place of the prescribed calculation, in the same way that other aspects of the Solvency II assets and liabilities are consistent with observable market prices.
We would contend that this applies for large parts of the longevity risks retained by insurers, and indeed the ABI suggestion discussed in section 6.2 would have essentially replaced the risk margin with a (prudent) market cost via a technical construct in the rules.
We would note that, even if international reinsurers followed a method conceptually similar to the risk margin, they would be unlikely to get a similar answer as:
the reinsurer’s own cost of capital may differ from the prescribed 6%;
for non-EU insurers, capital requirements are unlikely to be the same as the Solvency II SCR; and
reinsurers would typically benefit from greater diversification, for example, against mortality risk on existing books, whereas the risk margin assumes transfer to a new entity.
7.6 No Risk Margin/loading to SCR
Under the Solvency I Pillar 2 ICA, UK insurers were not required to hold a risk margin on top of BEL. Arguably, this could be justified by prudence in the Pillar 1 calculations, but this argument is weaker where the Pillar 2 requirements were the binding constraint.
Indeed, it is the presence of the risk margin in Solvency II technical provisions but not the Solvency I ICA that has given rise to a large TMTP for many UK annuity writers.
As noted in section 3.5.2, in its submission to the Treasury Committee, the IFoA questioned whether the risk margin under Solvency II provided excessive security to policyholders to the detriment to consumer choice and costs.
In particular the current risk margin, when combined with the SCR, means an insurer should be able to withstand a one-in-200-year event and then still have sufficient assets to transfer liabilities to another insurer who would be (re-)capitalised from the risk margin to be able to withstand further one-in-200-year shocks.
An alternative would be to argue that after this one-in-200-year event, policyholders should expect no more than that the firm has assets equal to the BEL, with no additional capital. There would then be a c.50/50 chance of having benefits provided in full from the resources of the firm, with any shortfall potentially borne by industry compensation schemes. It is the view of the working party that this alternative is inadequate.
If this level of security is indeed deemed inadequate, a further alternative would simply be to increase the level of the SCR requirement to a higher level of confidence. As noted previously, the risk margin represents a reduction in capital resources, rather than an increase in capital requirements; however, it has the same bottom line impact.
Another alternative to add more prudence would be to increase the chance of having benefits provided in full following the one-in-200-year SCR event to a desired confidence level above 50%, which essentially leads back to the run-off percentile methods discussed in section 7.1.
7.7 International Capital Standards – Margin over Current Estimate
The IAIS is developing a framework for ICS. This also includes a MOCE, similar in concept to the risk margin.
As documented in IAIS (2018; 2019), the 2018 and 2019 field tests of the ICS include three approaches to the MOCE.
1. Cost-of-capital MOCE (C-MOCE)
This method is essentially consistent with that used currently in Solvency II.
However, two different parameters for the cost-of-capital rate (in excess of the risk-free rate) are being tested.
The main approach is to use a cost-of-capital rate of 5%, similar to but lower than Solvency II rate of 6%.
The alternative is to consider an adjusted cost-of-capital rate dependent on risk-free rates: specifically, a cost-of-capital rate (in excess of risk-free) of risk-free + 3%, with a floor of 3% and cap of 10%. See section 6.1 for a discussion of why the cost of capital might itself vary with risk-free rates. The working party’s view is that it is difficult to justify an excess cost-of-capital rate varying one-for-one with risk-free rates, and that a more reasonable approach may lie between the two parameterisations tested in the 2018 field test.
2. Prudence-MOCE (P-MOCE)
The P-MOCE, as an alternative to a cost-of-capital method, adds a margin to the best estimate for parameter uncertainty.
An estimated standard deviation for insurance liabilities is computed using the relevant aggregated ICS risk charges as a proxy for the stressed current estimate and assuming a normal distribution for the current estimate. Specifically, the standard deviation is assumed to be the ICS risk charge for insurance risk charge/2.576, since under the standard normal distribution, the 99.5th percentile is 2.576.
The P-MOCE is then taken as 66.7% of that standard deviation, which is taken as approximately equal to the 75th percentile. (The 75th percentile for the standard normal distribution is actually 0.6745).
Hence, overall the P-MOCE is simply calculated by taking the SCR equivalent (ICS risk charge) for insurance risk and multiplying this by 0.259 (66.7%/2.576).
3. Percentile-MOCE
The Percentile-MOCE was introduced in the 2019 field tests. For life business, it is identical to the P-MOCE, except that it is not regarded as loss absorbing – see section 7.7.1. The field tests are for calibrations of 80th and 85th percentiles as well as 75th percentile.
The default methodology in the 2018 field tests was to use the C-MOCE at a 5% cost-of-capital rate. The 2019 field tests included only the Percentile-MOCE
7.7.1 Loss absorbency of prudent margins
The P-MOCE tested under the 2018 field tests would also be a deduction from capital requirements, that is, it would be assumed to be loss absorbing (unlike the C-MOCE and the current Solvency II risk margin).
One key difference in the Percentile-MOCE tested in the 2019 field testing is that this is not deducted from capital requirements.
In the 2016 field test, comments were sought on whether the P-MOCE should be loss absorbing, and IAIS (2016) summarises the responses. Notably, the regulators in China (China Insurance Regulatory Commission) and the United States (National Association of Insurance Commissioners) both opined that the P-MOCE should be loss absorbing, the Chinese regulator arguing that “when a company becomes insolvent, P-MOCE can be released to absorb losses” (ibid., p.83), as did a number of United States insurers who argued that any margins in reserves over and above best estimate represented double counting with capital requirements.
In contrast, EIOPA argued that
The purpose of the MOCE should be to ensure the viability of the insurance liabilities on an ongoing basis, hence it should not be considered loss absorbing over the 1-year time horizon. (ibid., page 83)
Given that the P-MOCE is simply a subset of the SCR, one can see why some might argue that it should be treated as a deduction from the SCR to avoid double counting.
However, in the working party’s view, the risk margin or MOCE should be part of technical provisions and not treated as available capital or an offset to capital requirements, for the following reasons:
The risk margin or MOCE is added to the best/current estimate of liabilities to reproduce the market-consistent cost of liabilities or the cost of transferring to a third party.
The SCR is then the additional capital held above this to ensure that a insurer can withstand a 99.5th percentile event and still be able to cover liabilities to customers, including the market-consistent cost of transfer.
Conceptually, it is also not clear to us why C-MOCE should be treated differently to P-MOCE in this regard: in our view, both methods are simply different approximations to this cost.
The choice of approach also relates to whether the regime is considered to be a “going concern” or a “gone concern” approach. Including the risk margin in technical provisions enables an insurer to continue its ongoing activities even after an SCR event, but the risk margin might be considered “gone concern” capital, able to meet creditors in a liquidation scenario.
8. Properties of a Desirable Risk Margin and Evaluation of Alternatives
8.1 Evaluation Criteria
The working party found it instructive to derive criteria for assessing the performance of the current Solvency II risk margin and for assessing the merits and weaknesses of alternative proposals.
In particular, in doing so, we have returned to the original Solvency II Directive and to the stated objectives of Solvency II in general and the risk margin in particular, including those originally proposed by the Groupe Consultatif (2006). We have also updated these in light of experience since (such as the global financial crisis, which highlighted the importance of avoiding procyclicality) and international developments.
We suggest the following are key criteria to be considered. Note that in some cases, these might conflict and we comment on cases where we believe the criteria might need to be relaxed in order to achieve the best overall aim.
8.1.1 Policyholder protection
The overriding requirement of Solvency II regulation is to protect policyholders and beneficiaries, and hence the key question for any changes to the risk margin is whether this is achieved.
The risk margin as calibrated in Solvency II is intended to have regard to this objective and, in particular, to ensure that the technical provisions are (theoretically) enough to allow the assets and liabilities of the insurer to be transferred to a third party in order to ensure full protection to Solvency II standards throughout run-off. See section 3.3.3.
As indicated in section 3.1.1, there is inevitably a conflict between policyholder security and consumer choice and costs, and, as noted in section 3.5.2, in its submission to the Treasury Committee, the IFoA questioned whether the current risk margin provided excessive security.
For example, the construction of the risk margin assumes that the risks can be re-capitalised to Solvency II standards following loss of capital. If a lower standard were required following failure of an insurer, this could logically allow the risk margin to be reduced.
However, as stated in section 7.6, the view of the working party is that simply holding technical provisions equal to BEL, with no risk margin, where this is less than the cost of transferring the risk to a third party, would be insufficient, and therefore that some form of risk margin is necessary.
8.1.2 Market consistency
The stated purpose of the risk margin in the Solvency II Directive is to make technical provisions compatible with the amount required to transfer the liabilities to a third party.
Recital 55
The value of technical provisions should therefore correspond to the amount an insurance or reinsurance undertaking would have to pay if it transferred its contractual rights and obligations immediately to another undertaking.
Article 77(3)
The risk margin shall be such as to ensure that the value of the technical provisions is equivalent to the amount that insurance and reinsurance undertakings would be expected to require in order to take over and meet the insurance and reinsurance obligations.
This suggests that a key criterion should be that the risk margin achieves this aim, and in particular where there is evidence of market pricing, that the two are reasonably consistent.
However, one key contention of the insurance industry, and indeed the PRA, is that for longevity risk on annuity books, this is not the case with the current method.
The cost-of-capital method used for the risk margin was intended to replicate the theoretical approach to a market-consistent exit value that a third party would require to assume the risk. The method should therefore be theoretically capable of approximating market consistency, although one can discuss the calibration as in section 6. However, evidence of longevity risk transfer suggests it is not necessarily market-consistent in practice.
8.1.3 Objectivity
The risk margin forms part of technical provisions, and one underlying concept of Solvency II is that technical provisions should be calculated in an objective and consistent manner. This differs from the approach allowed in the SCR where internal models are permitted, meaning that different insurers can hold different capital against the same risks.
For example, Recital 15 of the Directive states:
Harmonisation should be increased by providing specific rules for the valuation of assets and liabilities, including technical provisions.
This suggests that the parameters and method of the risk margin calculation should also be prescribed, as they are in the Level 2 Delegated Regulation, and should not permit alternative approaches by different insurers, nor too much subjectivity in the calculation.
Indeed, as noted in section 6.4, one shortcoming of the current Solvency II methodology in relation to this criterion is that the SCR capital requirements projected to determine the risk margin can depend on the characteristics (e.g. the level of diversification) of the firm and also on its internal model calibration, where applicable.
Note that IFRS 17, in contrast to Solvency II, appears to permit a greater choice of approaches to its equivalent risk adjustment (see section 8.1.7).
8.1.4 Applicability to different risks
We are conscious that our paper deliberately focuses on life insurance and, within that, the particular issues caused for UK annuity business.
However, as constructed, the risk margin applies to all EEA insurance and reinsurance business, and therefore any approach needs to work equally well for long-dated annuity business as short-tailed general insurance contracts, and for all types of insurance business and risks and in all regions of the EEA. Hence, this requirement should be considered when assessing alternatives.
However, the working party’s view is that the one-size-fits-all approach used in Solvency II may actually be part of the problem: it simply may not be possible to find a single method, such as cost of capital, that works satisfactorily for all business.
8.1.5 Ease of implementing change to calculation
As stated in section 8.1.4, the risk margin needs to be applied by the whole EEA (re-)insurance industry, and that includes both small and simple insurers, and firms using the standard formula, as well as larger or more complex groups, and firms with internal models.
For the former, ease of calculation is a key criterion and this typically applies even for the latter, given the overheads involved in re-programming systems.
The working party notes that the current method, particularly the requirement to project the SCR, arguably failed this test at outset. But it does now have the significant advantage that workable solutions are, of necessity, now in place. Hence, for any new method, or change to the existing method, the more relevant criterion is the ease of transition from current calculation methods and systems.
8.1.6 Avoiding procyclicality
Solvency II has a general requirement set out in Article 28 of the Directive to avoid procyclicality and aid financial stability, albeit one subordinated to the main objective of policyholder protection (see Article 27 quoted in section 8.1.1).
Article 28
Financial stability and procyclicality
Without prejudice to the main objective of supervision as set out in Article 27, Member States shall ensure that, in the exercise of their general duties, supervisory authorities shall duly consider the potential impact of their decisions on the stability of the financial systems concerned in the European Union, in particular in emergency situations, taking into account the information available at the relevant time.
The risk margin itself should be consistent with this objective, and Douglas et al. (Reference Douglas, Noss and Vause2017) have, for example, highlighted that the strong sensitivity of the current risk margin formula to interest rates could itself add to procyclicality by forcing more hedging, and also forced selling of risky assets, when interest rates are low.
The working party would note that if the risk margin had been hedged at inception, as technical provisions are, then further falls in rates would not have created a need for further hedging. In section A3 of Appendix A, we discuss some of the issues relating to hedging the risk margin.
EIOPA (2018, page 345) also appealed to avoiding procyclicality as a reason for not lowering the cost of capital in current relatively benign market conditions, noting that “a cost-of-capital rate that reflects current credit spreads, for instance, would have procyclical effects”. The prescribed 6% cost-of-capital rate is intended to be a through-the-cycle calibration, specifically to avoid this issue.
The working party also observes that the requirement for avoiding procyclicality can often conflict with other objectives, for example, market-consistent valuation may vary with market cycles and reinsurers’ cost of capital (see section 8.1.2).
8.1.7 Consistency with IFRS 17
The Solvency II Directive requires consistency with international accounting standards where possible (although we note that this does not apply to the BEL).
Recital 46
Valuation standards for supervisory purposes should be compatible with international accounting developments, to the extent possible, so as to limit the administrative burden on insurance or reinsurance undertakings.
IFRS 17 is scheduled to come into effect in the following years and includes the concept of a risk adjustment that is similar to the risk margin. Ideally, insurers would be able to use the same approach for both, particularly if any change to the current risk margin is proposed.
IFRS 17, being principles based, permits a range of approaches for the calculation of the risk adjustment. The guidelines for the estimation technique are very high level:
The IFRS 17 Standard (see IASB, 2017, Appendix B, paragraph B91) states
IFRS 17 does not specify the estimation technique(s) used to determine the risk adjustment for non-financial risk. However, to reflect the compensation the entity would require for bearing the non-financial risk, the risk adjustment for non-financial risk shall have the following characteristics:
(a) risks with low frequency and high severity will result in higher risk adjustments for non-financial risk than risks with high frequency and low severity;
(b) for similar risks, contracts with a longer duration will result in higher risk adjustments for non-financial risk than contracts with a shorter duration;
(c) risks with a wider probability distribution will result in higher risk adjustments for non-financial risk than risks with a narrower distribution;
(d) the less that is known about the current estimate and its trend, the higher will be the risk adjustment for non-financial risk; and
(e) to the extent that emerging experience reduces uncertainty about the amount and timing of cash flows, risk adjustments for non-financial risk will decrease and vice versa.
These criteria are almost identical to those stipulated in IAIS (2006) as quoted in section 1.2 of Appendix B, which were taken into consideration by CEIOPS in the original development of the risk margin.
The standard does, however, require that entities not applying the “confidence level technique” (broadly, the VaR approach) disclose the equivalent confidence level that the resulting risk adjustment would correspond to, if such a technique had been applied. This in itself may encourage some firms to employ a VaR approach to the calculation of the risk adjustment, although others may prefer the use of a cost-of-capital approach for consistency with the existing Solvency II risk margin framework.
The IAA has published an exposure draft of International Actuarial Note (IAN) 100 on Application of IFRS 17 Insurance Contracts, IAA (2019, page 74), which states that, for the risk adjustment
Potential methods include, but are not limited to, quantile techniques such as confidence level or conditional tail expectation, cost-of-capital techniques, or even potentially simple techniques such as directly adding margins to assumptions or scenario modelling
This seems to cover both the Solvency II approach and some of the approaches discussed in section 7. Further details of these techniques are provided in an Educational Monograph, IAA (2018).
Conceptual differences between the IFRS 17 risk adjustment and the Solvency II risk margin include the following:
IFRS 17 is generally based on the concept of a fulfilment value, whereas Solvency II is based on an exit value concept. In other words, the value of liabilities is defined with regard to the fulfilment of obligations rather than the transfer of liabilities.
IFRS 17 considers the entity view of risk, that is, the compensation that the particular entity requires for acceptance of non-financial risk, rather than a market view. Accordingly, if two different entities had different tolerances for risk, then they should logically have different risk adjustments; this is in contrast to the market-consistent philosophy of Solvency II and the desire for consistency in a regulatory regime. If a cost-of-capital measure is used, this should reflect the entity’s own view of risk capital, not that required under a particular regulatory regime. As such, no specific guidance exists around parameterisation of any model employed, nor is there any requirement to replicate a (theoretical or practical) exit value for the relevant liabilities.
For entities that are part of a larger group structure, there appears to be scope to allow for a group diversification benefit when calculating the entity’s risk adjustment. This topic has been considered by the IASB (see IASB, 2018a; 2018b).
The risk adjustment is not required to be discounted at the risk-free rate of interest.
There are some minor differences in the scope of risks covered.
8.1.8 Consistency with International Capital Standards
The Solvency II Directive, Recital 15, suggests that the Solvency II framework should generally be
in line with the latest developments in risk management, in the context of the International Association of Insurance Supervisors, the International Accounting Standards Board and the International Actuarial Association.
As described in section 7.7, the IAIS is developing a framework for ICS. This includes a MOCE, conceptually similar to the risk margin. Different approaches are being considered: C-MOCE (which is similar to the risk margin), P-MOCE and Percentile-MOCE.
Ideally, any changes to the risk margin in the EEA, or specifically in the UK, should be consistent with this framework.
At the time of writing, IAIS allows these two different approaches, and so we have assumed in our assessment in this section that either alternative might be permitted.
8.1.9 Solvency II Equivalence for the UK post-Brexit
Under Brexit, the UK intends to apply for Solvency II Equivalence for its post-Brexit regime, although we would note that this is perhaps less important for much of the UK life industry than, for example, for parts of the non-life reinsurance market.
Assuming Equivalence is desired, then any UK-specific reforms to the risk margin would need to be consistent with maintaining this status.
The assessment of Equivalence is as much a political as a technical question, particularly given the political nature of the Brexit negotiations and any subsequent discussions as to the UK–EU relationship.
Furthermore, the UK’s regime starts from the position of being identical to Solvency II, which may aid any initial Equivalence assessment, but could make any significant departures from Solvency II starker and so potentially contentious.
However, there may be an argument that changes introduced to maintain consistency with ICS (see section 8.1.8) could aid the Equivalence assessment.
8.1.10 Creating appropriate incentives
It is important that the operation of the risk margin, and Solvency II generally, creates the right incentives for firms.
There is strong evidence (see e.g. Woods, S., Reference Woods2018) that one key impact of the Solvency II risk margin has been to materially increase the volume of longevity risk reinsured outside of the EU and the Solvency II regime. The PRA highlighted this as one of its key concerns with the operation of the risk margin.
For firms that have retained longevity risks, the risk margin has also created an incentive for artificially hedging interest rates at historically (although it remains to be seen if prospectively) low levels. Furthermore, the risk margin has been cited, for example by the IFoA (2017), as having reduced sales of individual annuity business – although the working party would note that bulk purchase annuity sales have actually increased since Solvency II came into force.
This is a more contentious area than some of the other criteria raised in this section, since one can debate both what constitutes the “correct” behaviours that should be incentivised, and also what really drives behaviour.
Insurers have withdrawn from the annuity market for various reasons, and there have been new entrants into the bulk purchase annuity market post-Solvency II.
Furthermore, the working party does not necessarily regard the transfer of longevity risk to markets, such as the United States which may benefit from greater diversification (e.g. against senior life insurance) as necessarily a bad thing, and indeed many insurers reinsured material volumes of longevity risk prior to Solvency II. We also believe that there has been an increase in reinsurance from the UK but to within the EU, where reinsurers are still subject to the risk margin, but benefit from diversification.
However, there is concern that insurers are incentivised to transfer risks they would otherwise have retained to less regulated markets. In that regard, one way to tackle this perceived regulatory arbitrage would be to achieve greater international consistency (see sections 8.1.7 and 8.1.8)
8.1.11 Theoretical soundness
Potentially, many of the criteria above could be met with simple techniques and other criteria could be met with pragmatic changes to the cost-of-capital method.
However, it is also important that any proposals for the risk margin are theoretically sound and that choices made can be justified by their rationale, rather than just their effect.
As described in section 2, the current Solvency II risk margin does have a sound theoretical underpinning. However, it does involve certain simplifying assumptions, as noted in Huber and Kinrade (Reference Huber and Kinrade2017), and there are certain theoretical inconsistencies, for example, as noted in section 6.5.
8.2 Summary of Evaluation of Current Solvency II Methodology
We can summarise our evaluation of the current Solvency II methodology in Table 5, where we consider each of the 11 criteria detail in section 8.1.
Table 5. Evaluation of Current Methodology

✓denotes a strength of the method, and ✓✓ a particular strength;
x denotes a weakness and xx a particular weakness; and
? denotes where there is some ambiguity
✓x or similar can show where a method has both a strength and weakness in the same category (e.g. that the cost-of-capital method is theoretically market-consistent but seems inconsistent with the price at which risk transfer actually takes place in practice)
8.3 Evaluation of Alternatives
8.3.1 Re-calibration of cost-of-capital method
In this section, we appraise some of the key variations on the cost-of-capital method that we discussed in section 6.
In Table 6, we show our appraisal of these various alternatives on our 11 criteria from section 8.1.
Table 6. Evaluation of cost-of-capital alternatives

Note that all comparisons are relative to the existing Solvency II methodology rather than in absolute terms, so they should not be compared to Table 5, and that our main focus is on application to UK annuity business.
This analysis is of necessity simplistic and also caused some debate in the working party, so it should not be taken as a definitive view. Nor do we believe that any attempt should be made to derive an overall score for each approach. However, we believe it provides a useful visual summary.
The table should be read with the commentary below, highlighting key points for each variation.
8.3.1.1 Reducing the cost-of-capital rate from 6% to a fixed lower %
The biggest advantage of this method is its simplicity: it would typically be easy to parameterise in systems and should not create significant additional issues. Many of the issues associated with the current risk margin are reduced in impact, if not all solved.
The theoretical justification for reducing the cost-of-capital rate is debatable, with strong arguments on either side, as discussed in section 6.1. However, comparing current market pricing with the risk margin, the 6% parameter does appear to produce too high an answer, at least in current conditions.
Cost-of-capital rates of 5−6% are also commonly used internationally where the cost-of-capital method is applied, for example 6% in the SST and, under the main option for field testing, 5% in ICS. Hence, a material reduction of the cost-of-capital rate, in either the EU or unilaterally in the UK post-Brexit, could leave the resulting regime out of line.
This change does not reduce the relative interest rate volatility of the risk margin which, as noted in our modelling, appears too high in comparison with our understanding of actual market pricing. However, it does reduce the volatility in absolute terms, and so could lessen the volume of hedging required and hence the market impact.
8.3.1.2 Reducing the cost-of-capital rate from 6% to a level dependent on interest rates
There is some theoretical justification that the cost of capital, in excess of risk-free rates, may itself reduce as risk-free rates reduce, albeit this is not definitive.
The advantages of this method, compared to simply reducing the cost-of-capital rate to a fixed lower figure, are:
one could defend a re-parameterisation by ensuring that the cost-of-capital rate was 6% when rates were at the levels when Solvency II was originally calibrated;
the volatility of the risk margin in relation to interest rates would be reduced, which in turns aids counter-cyclicality and may produce a behaviour more in line with market prices; and
a cost-of-capital rate, in excess of risk-free, of risk-free + 3% was field-tested in ICS, so if calibrated appropriately this could be more consistent internationally.
This approach also may be easier to implement than many other suggestions. However, it does introduce complexities of its own: notably, the resulting risk margin would have an unusual interest rate sensitivity, may have an artificial sensitivity to whichever rate is used to calibrate the cost of capital and may be very difficult to hedge precisely with standard instruments.
8.3.1.3 Allowing for MA or VA when projecting SCRs
At face value, it may seem reasonable to assume that the receiving undertaking uses the same long-term guarantees measures as the transferring insurer. Furthermore, to do so is consistent with the fact that the risk margin does not allow for any change to the BEL between the insurer and the transferee.
The Level 2 Delegated Regulation is silent on this point: current practice instead is dictated by EIOPA Guidelines, so this is a relatively easy change to implement within Solvency II. It might also be less controversial than some others in an Equivalence context post-Brexit. Furthermore, it appears potentially allowable under IFRS 17 and ICS.
Allowing for the VA and MA in projected SCRs would aid counter-cyclicality in that the risk margin would reduce under times of credit market stress, although it would not make a material difference to issues such as interest rate sensitivity.
However, the biggest challenge to this method is the theoretical justification for including the MA and VA, without also allowing for the ongoing credit risk associated with holding the assets that would support the discount rate. Projecting the cost of capital to support this risk is, according to our model, likely to offset much of the benefit from valuing the projected SCRs using the MA or VA.
There could be more theoretical justification if the liabilities, for SCR purposes, were discounted at an illiquidity premium that it is assumed could be earned at minimal risk, from high credit quality but illiquid assets.
8.3.1.4 Discounting future projected cost of capital at other than basic risk-free
This idea potentially encompasses a range from:
allowing for the MA or VA in the discount rate, similarly to allowing for them in SCRs, on the basis that the risk margin can also be invested in illiquid assets; to
allowing for much higher discount rate, for example, a discount rate equal to the cost-of-capital rate, as suggested by Waszink (Reference Waszink2013)
The comments for the former are similar to those for allowing for the MA and VA when projecting SCRs – in particular the calculations would need to allow for capital supporting the risk on the assets held to back the risk margin.
The working party is unconvinced of the justification for the latter approach, as discussed in section 6.6.
8.3.1.5 Other areas
We do not consider here the full list of variations, as some, such as allowing for diversification within groups, we see as addressing specific issues rather than changes to the overall design.
The management actions proposal in section 6.2 is really a potential path through the Solvency II rules to achieve a more fundamental change to the risk margin, that is, replacing it with the market price of risk transfer, which we discussed in section 7.5 and consider in section 8.3.2.3.
We are unable to comment in detail on the tapering proposal from the ABI (discussed in section 6.5) since we have not had sight of the justification for the approach.
8.3.2 Alternative methods
In Table 7, we consider the alternative methods in section 8 against our desirable criteria.
Table 7. Evaluation of alternative methods
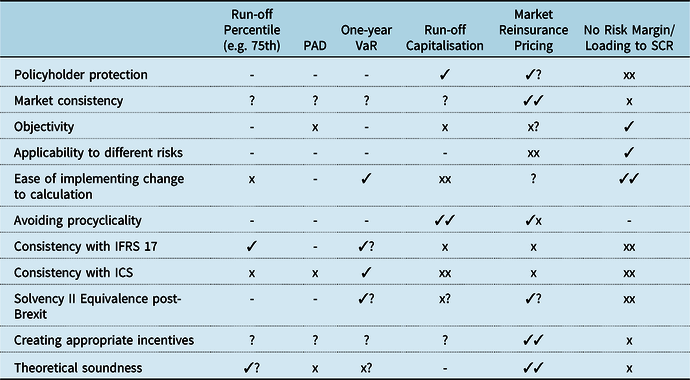
8.3.2.1 Run-off percentile/Provisions for adverse deviation/Value-at-Risk
In many respects, these methods are all variations on a theme, in that they are attempting to replace the cost-of-capital method with a direct addition for risk to the assumptions in the technical provisions.
The key differences, as discussed in detail in section 8, are that:
the run-off percentile method focuses on risks over the full term of the distribution, whereas the VaR approach looks at shorter-term risks, typically 1 year as in the SCR and so may be easier to calculate;
the PADs are applied to individual assumptions, therefore do not reflect diversification, at least at a firm level, and can also be more arbitrary in their calibration. However, it would be possible to make the choice of PADs more scientific and to reflect at least an industry average level of risk correlation (which may, as noted in section 6.4, be in any case more appropriate for a proxy for a market price of risk).
The different variations should each be applicable, on a consistent basis, for a full range of insurance risks.
The exact parameterisation of the methods will dictate issues such as the impact on market consistency, creating the right incentives and policyholder protection.
The run-off percentile makes policyholder protection most explicit in that it calibrates to the desired level of confidence to meet liabilities over time after the SCR has been exhausted.
IFRS 17 is relatively agnostic, so could permit any of these variations, and they are arguably closer to the “fulfilment value” concept of IFRS 17, rather than the “exit value” concept that underpins Solvency II. The key under IFRS 17 is to reflect the compensation the entity itself would require for bearing the risk, rather than a market price.
However, IFRS 17 requires entities not using a confidence level technique (which would include those applying a cost-of-capital method) to provide disclosures as to an equivalent confidence level. The wording of the standard is ambiguous as to what this confidence level means: one interpretation is that this is closest to a “run-off percentile”, in our terminology. However, anecdotally, we believe some insurers are opting for what we could call a VaR approach for the risk adjustment and are interpreting this as equivalent to a confidence level.
ICS field tests also include alternatives to the cost-of-capital method, P-MOCE and Percentile-MOCE, which in our framework equate to the VaR approach. Our analysis of other markets suggests that this approach is gaining ground as the preferred one as Asian markets move to risk-based solvency methods, although the large Chinese market has adopted a PAD approach.
A method permitted in ICS could assist with post-Brexit Solvency II Equivalence, since the UK could argue that it is complying with international standards.
8.3.2.2 Run-off capitalisation
This is the most fundamental change to the existing Solvency II regime and hence the most complex to implement and indeed even design and calibrate – it could be considered more of a Solvency III regime.
In theory, a run-off capitalisation method could be very counter-cyclical as short-term market moves may not necessarily impact the perception of the ability of an insurer to meet liabilities as they fall due. However, the Board and indeed the regulator under such a regime would face a decision as to when they would intervene.
8.3.2.3 Market reinsurance pricing
The use of market reinsurance pricing has the significant advantage that it should be, by definition, market-consistent and is theoretically sound.
It should reduce any artificial regulatory incentives to transfer risks to another regime, although the working party would emphasise that there can be strong economic reasons for such risk transfer.
While not compatible with the letter of the Solvency II Directive, it is arguably compatible with the spirit. The UK could, for example, argue post-Brexit that it would simply be reverting to the original distinction between hedgeable and non-hedgeable risk, and designating (some) longevity risk as hedgeable.
Nevertheless, the proposal does come with significant disadvantages.
Firstly, it does not provide a solution for many other risks such as lapse risk, where complete market risk transfer pricing may not be available. Furthermore, for certain annuity risks, such as deferred annuities, the market is much less deep and pricing less transparent.
Even for annuities in payment, where there is an active market, the market would not satisfy the usual Solvency II deep, liquid and transparent criteria. Without actually completing a transaction, a price is only theoretical and to an extent subjective. This may also cause practical issues for insurers with less access to market pricing. The regulators could prescribe the method for determining the cost of reinsurance, but depending on how this was specified (e.g. as fixed margins on best estimate assumptions), this could make the method closer to the PAD or other approaches.
Depending on how the price is derived and recalibrated over time, procyclicality could be introduced if the risk margin itself became sensitive to supply and demand in the longevity risk transfer market, and, inter alia, to reinsurers’ own cost of capital.
While in theory providing policyholder protection, since the risk margin covers the cost of market risk transfer, reinsurance could become more expensive, or may not even be available, after an event that had caused a large loss of own funds for one or more insurers.
Given the above two points, there is therefore an argument that the market reinsurance pricing used should be a prudent through-the-cycle price, rather than the current price, albeit that then moves away from pure market consistency.
If this solution were adopted, insights into how international reinsurers price longevity risk transfer in practice would be helpful in terms of calibrating the risk margin, and this might represent a useful investigation for EIOPA or PRA.
The use of market reinsurance pricing also appears inconsistent with ICS as drafted, and also with IFRS 17, given the emphasis there on the entity’s own fulfilment cost.
8.3.2.4 No risk margin/loading to SCR
This method is clearly simple and solves the issues with the risk margin by simply eliminating it.
However, the working party would question whether this really provides adequate policyholder protection: policyholders are entitled to assume that after exhausting the SCR that the insurer still has sufficient assets to meet liabilities as they fall due. It also potentially creates an artificial incentive to retain longevity risk given that the market price is in excess of the best estimate.
Policyholder security could in theory be improved by instead increasing the SCR to the desired level, but here we think there is rightly a distinction in treatment between hedgeable risk, which can be eliminated and for which there is a clear market price, and non-hedgeable risk which does not share these characteristics.
The concept of a risk margin (or risk adjustment, or MOCE) is increasingly enshrined in international best practice, and IFRS 17 and ICS specifically. Eliminating the risk margin is also likely to be viewed adversely in any post-Brexit Equivalence discussions.
8.4 Conclusions
The working party’s analysis has not reached a definitive conclusion on recommending one method. Indeed, the different objectives are at times in conflict so there is no one solution that meets all of them. Furthermore, the context in which changes will be considered is highly dependent on unknown factors, such as the outcome of Brexit.
Nevertheless, having regard to our evaluations of the various alternatives, the working party sees merit in considering the following changes:
Cost-of-capital rate varying with risk-free rates
As a short-term fix within the cost-of-capital method, to allow for a cost-of-capital rate that equates to 6% when risk-free rates are at the level that applied when Solvency II was calibrated, but automatically changes the cost-of-capital rate when risk-free rates change.
EIOPA has robustly defended the choice of the 6% cost-of-capital rate, albeit we have some reservations as to the arguments.
However, interest rates have reduced significantly since this was calibrated, and there is some theoretical justification that the cost of capital over risk-free reduces in with risk-free rates. Allowing the cost-of-capital rate to vary with risk-free rates would dampen the excessive volatility of the risk margin to interest rates, which is one of the key issues with the current approach.
Illiquidity premium
To allow a prudent illiquidity premium to be used in the calculations of the projected future SCRs and in the risk-free rate used in discounting the future costs of capital, based on rates that can be earned from high-quality illiquid assets. This might in practice be taken as the VA.
While we can see there is a rationale for assuming that the reference undertaking could use the MA, the undertaking would then logically also need to hold capital associated with the credit risk on assets, which would largely offset the benefit. However, the VA could in theory be earned without investment in credit risky assets.
Longevity risk treated as hedgeable
To allow longevity risk, subject to certain standards, to be treated as hedgeable and the relevant part of the risk margin to be replaced with an addition representing the market cost of risk transfer, on a prudent through-the-cycle basis. The management actions solution could be a way for the PRA to allow insurers to achieve this effect within Solvency II, albeit it could be open to challenge from EIOPA.
This seems consistent with the original spirit of Solvency II and the theoretically logical distinction between hedgeable versus non-hedgeable risk, rather than the one between market versus demographic risk enshrined in the final Directive. It is, by definition, consistent with the market price of risk transfer, albeit we believe that a prudent through-the-cycle price, rather than a variable market price, of longevity risk transfer may be more appropriate in a solvency standard.
Percentile-MOCE
To move to or to allow as an alternative, the Percentile-MOCE as calibrated in ICS, with no deduction from capital requirements.
Use of a margin on assumptions seems to be emerging as a more popular alternative to the cost-of-capital approach in non-EU market-consistent solvency frameworks, notably in Asia, and if a new standard emerges under ICS this may present a viable alternative to the cost-of-capital method, which may produce more appropriate (e.g. less volatile) answers for long-tailed business. This also has the advantage of being compatible with the rest of the general framework of Solvency II: we see some merit in considering pure run-off capitalisation approaches, but this is a more fundamental change to Solvency II.
However, we believe this would require further study once the parameterisation of ICS is finalised, for example, as to the impact on market consistency, creating appropriate incentives and policyholder protection.
As indicated in section 8.1.1, the working party believes that a risk margin in some form is necessary. However, our view is that striking the balance between protecting policyholders and ensuring value for money is primarily a political choice, which affects the definition of both the risk margin and the SCR. This choice can be reflected in the calibration of any method that may be chosen.
Acknowledgements
All of the working party members have contributed to our debates and to this paper, and have given up a lot of personal time to do so. I am very grateful for their commitment and support, given the pressures from their work and home commitments. As a consequence, I’d also like to extend my thanks for the patience of their partners and families.
Within the working party, I would particularly like to thank;
Waqar Ahmed, who organised the survey of insurers, built and operated the model and produced the graphs;
Andy Scott and Paul Fulcher, who represented the working party in presentations at CILA and the IFoA Life Conference; Paul is also responsible for liaison with the Life Board; and
Richard Schneider, who started as our Life Research Committee shadow, but who later combined this role with being a full member of the working party
We are also very grateful to Chris Marsh, who was the first Chair of the working party. Chris ensured that we set off in the right direction, but regrettably left the working party in November 2018.
As stated in the paper, we carried out a survey of insurers in order to provide insight into current practices and inform our conclusions. We’d like to thank the Chief Actuaries of the insurers for agreeing to participate, and in particular the people who actually completed the survey for their time and efforts.
We would also like to thank the peer reviewers for thoroughly reviewing the draft paper and for their helpful comments.
In addition, we’d like to thank Tim Stedman for a positive and encouraging review.
We are grateful to Mairi Russell of the IFoA for the support and organisation that she has provided.
Andy Pelkiewicz
Appendix A: Practical issues with the risk margin
In this Appendix, we consider briefly three practical issues relating to the management of the risk margin:
the calculation of the risk margin, including the use of simplifications;
the possibility of stressing the risk margin when calculating SCR; and
hedging the risk margin
A.1 Practical Calculation Issues
A.1.1 Calculation of the Risk Margin
The cost-of-capital approach was initially recommended by CEIOPS in part on the grounds of relative simplicity (see Appendix B). However, this method requires an annual projection of SCR for the full run-off period of the liabilities, which is anything but straightforward for many insurers.
A capital requirement in respect of the relevant risks is required each year for the full run-off of the business. An accurate method for this would involve projecting forward the business until run-off, then, for each simulation, and at each time point, calculating the capital requirement (possibly itself stochastically), before discounting to get a final number. This approach imposes a significantly high calculation burden, and is therefore impractical, and simplifications are almost always needed.
A.1.2 Simplifications
The EIOPA Guidelines recognise the complexity of this calculation and has provided a hierarchy of approximate methods for calculating the risk margin.
1. Approximate the individual risks or subrisks within some or all modules to be used for the calculation of future SCRs.
2. Approximate the whole SCR for each future year, for example, using a proportional approach
3. Estimate all future SCRs “at once”, for example, using an approximation based on the duration approach.
4. Approximate the risk margin by calculating it as a percentage of BEL
In this hierarchy, the simplifications are in general getting simpler step by step. In order to be able to use the simplifications, appropriate eligibility criteria, based on quality and materiality considerations, have to be fulfilled.
As mentioned above, performing a full calculation is very burdensome, and most firms will opt for a simplification.
Method 1 is the most sophisticated simplification and focuses on individual modules or submodules in order to approximate the individual risks. A commonly used approach within Method 1 is the “risk driver” approach.
A risk driver (which is an item whose value can be determined from the values output from the projection model) is chosen to approximate the run-off of each risk at each time point in the future. It is noted that risk drivers need detailed analysis and careful calibration, in order to approximate how the individual risks will change in the future as accurately as possible.
For example, a firm may consider using the value of BEL as the risk driver for longevity risk, as the impact of a longevity stress might be considered to be proportional to the present value of future annuity payments. However, in practice, the cost of longevity risk (as defined in the standard formula) increases more quickly than the value of benefits, and this method is likely to understate the risk margin when compared to a more accurate calculation.
As shown in Figure 16, we have used our model to demonstrate this point. This shows that BEL/Duration of liabilities is a much better risk driver, under the assumptions used in the model.

Figure 16. Longevity risk SCR run-off using drivers.
Method 2 is typically based on the assumption that the projected SCR for a given line of business is proportional to the projected BEL – the proportion being the ratio of the present SCR to the present BEL. This simplification takes into account the maturity and the run-off pattern of the liabilities. However, the relationship between risk profile and BELs is assumed to be unchanged over the years, which is unsuitable if this does not happen in reality.
For example, where a firm writes regular premium business (within contract boundaries), the current SCR includes risks relating to the benefits secured by the future premiums, whereas the current BEL does not include the value of the future premiums, so projecting the SCR in proportion to the BEL is likely to overstate the risk margin.
Method 3 typically uses the modified duration of the liabilities in order to calculate the discounted sum of all future SCRs in one single step. This simplification takes into account the maturity and the run-off pattern of the liabilities. However, it is based on the assumption that the composition and the proportions of the risks and subrisks do not change over the years. If the business runs off in a non-linear pattern, the duration approach may not accurately capture the changing nature of the best estimate.
Method 4 is likely to be inaccurate due to its simplistic nature and should only be used if none of the above methods can be applied. Although this may not be appropriate for regulatory reporting, a firm may find it useful proxy for internal business planning purposes, if it finds that this proportion is stable over a short time horizon.
A.1.3 Conclusion
Owing to the complex nature of the risk margin calculation, simplifications are almost always needed. However, simplifications provide room for interpretation and subjective judgement which may lead to a large variation in the methods chosen, and the size of the risk margin for firms across the industry. Simplifications to the risk margin calculation may tend to understate or overstate the true risk margin and consideration needs to be given to how material this deviation is. A firm should therefore be aware of the size of the risk margin under a more sophisticated approach in order to be confident in the use of a simplified calculation.
In view of the size of the risk margin and the complexity of risk profiles, we would not expect Methods 2, 3 or 4 to be sufficiently accurate for regulatory reporting for most life insurers.
A.2 Stressing the Risk Margin when Calculating the SCR
Recital 64 of the Solvency II Directive states that the SCR should be “determined as the economic capital to be held” in respect of a one-in-200-year event, and Article 101 of the Directive confirms that the SCR is a 99.5% 1-year VaR. Furthermore, for the standard formula, Article 105 refers to “the risk of … change in value of insurance liabilities”.
These definitions imply that the risk margin, which is included in insurance liabilities, should be stressed when calculating SCR.
However, Article 83 of the Solvency II Delegated Regulation, which relates to the standard formula, includes
Where the calculation of a module or sub-module of the Basis Solvency Capital Requirement is based on the impact of a scenario on the basic own funds of insurance and reinsurance undertakings, …:
(a) The scenario does not change the amount of risk margin included in technical provisions …
This regulation prohibits stressing the risk margin when calculating the SCR in the standard formula.
It is believed that this is included on practical grounds: as the risk margin depends on the SCR, to allow the SCR to depend on the risk margin would introduce a circularity in the calculation methodology. This would be difficult to resolve, particularly in the context where the standard formula is used by insurers with less complex modelling solutions.
Nevertheless, stressing the risk margin when calculating SCR would appear to be theoretically correct.
It should be noted that there is no such prohibition for internal models, although it is the working party’s understanding that all or most internal models in the UK do not stress the risk margin. The questions in our survey relating to this feature were not generally answered.
In certain circumstances, stressing the risk margin could significantly reduce the SCR. This would apply, for example, where the mass lapse risk is a significant component of the SCR, which might well be the case for unit-linked business.
However, results from the working party’s model suggest that where longevity is the dominant risk, if the risk margin were stressed, the SCR would not change much and may indeed increase slightly. Therefore, there would be little or no benefit for annuity firms from stressing the risk margin in calculating SCR.
Although the circularity issue presents practical difficulties, it should by no means be insoluble, and the working party considers that internal model firms could adopt this practice within existing rules if it would be beneficial.
Furthermore, we believe that it would be appropriate to amend the Delegated Regulation to permit (but not require) firms who are capable of stressing the risk margin when determining SCR under the standard formula to do so if they wish.
A.3 Hedging the Risk Margin
A.3.1 Practicalities of Hedging
The exposure to the risk margin is complex. It is the sum of the present value of a series of costs of capital. Each cost of capital is itself calculated by discounting a series of cash flows, for example, a series of cash flows representing the difference between two sets of liability cash flows calculated under different assumptions.
This means that determining the appropriate hedge for the risk margin is more complicated than hedging a set of fixed liability cash flows, such as the BEL.
If the future SCRs in the risk margin are also projected on an approximate basis, the hedge may also need to be rebalanced over time.
A.3.2 Choice of Hedging Instruments
The first decision required is whether to hedge the risk margin using physical assets or derivatives.
The risk margin will typically have significantly longer duration than the corresponding BELs (as it essentially involves a double projection – projected future SCRs which are themselves the results of projected cash flows on two bases).
It may therefore be challenging to find physical assets of sufficiently long tenor to provide an effective hedge for the risk margin. In addition, tying up physical assets in a hedge may not be effective at generating investment returns.
Alternatively, the risk margin may be hedged using a portfolio of swaps. This leaves the physical assets backing the risk margin free to be invested to meet the firm’s other objectives. Hedging with swaps will also require the firm to post collateral if interest rates rise. This can put a strain on the firm’s liquidity position.
One way for the firm to capture the upside risk is to hedge the risk margin using swaptions.
The downside of using swaptions is that the firm must pay an option premium and the purchased option will suffer from time decay. In addition, the market value of the swaption once purchased will be affected by changes in the market-implied interest rate volatility.
A.3.3 Disadvantages to Hedging the Risk Margin
A.3.3.1 Potentially increased volatility of IFRS profit or other relevant metrics
A hedge that is optimal from the point of view of stabilising the regulatory balance sheet may not be optimal from the point of view of stabilising the accounting balance sheet or other metrics, for example, economic capital.
How similar the IFRS risk adjustment described in section 8.1.7 is to the risk margin, in terms of both its magnitude and its sensitivity to interest rates, will affect the impact that a decision to hedge the risk margin has on the accounting balance sheet. Furthermore, before IFRS 17 implementation, insurers typically do not hold an equivalent liability on their accounting balance sheet.
A.3.3.2 Potentially increased SCR
Hedging the risk margin would be expected to improve the stability of basic own funds.
However, because the risk margin is normally not stressed in calculating SCR, as described in section A2 of Appendix A, the Solvency II balance sheet after allowing for SCR would be over-hedged.
A.3.3.3 Reluctance to hedge something that is not a “real” liability
The risk margin does not represent the value of money that will be paid out to policyholder or other creditors on a going concern basis.
As such, some firms may be reluctant to hedge the interest rate sensitivity of the risk margin
Hedging the risk margin reduces the short-term volatility of the insurer’s balance sheet but actually adds to the long-term volatility and increases risks around the ability to pay policyholder benefits as they fall due.
A.3.3.4 Loss of upside potential (swap/bond hedges)
Not hedging the risk margin can expose a firm’s regulatory balance sheet to the risk that interest rates fall. However, the balance sheet will strengthen in the event that interest rates rise.
Hedging the risk margin with swaps or bonds has the effect of eliminating the upside, so that the firm no longer sees a benefit if interest rates rise. We understand that some firms have been reluctant to put on additional hedges for the risk margin because of regret risk at locking in near historic low interest rates.
A.3.3.5 Cost of hedging (swaptions)
Swaption hedging strategies involve a cost to the firm, even if interest rates remain unchanged over the term of the hedge, due to the time decay of the purchased options
A.3.4 Use of the TMTP as a Natural Hedge for the Risk Margin
As stated in section 1.2.1 of the paper, the impact of the risk margin is mitigated by the TMTP. For most UK insurers, the TMTP enables the introduction of the risk margin in respect of existing business to be scaled in over 16 years.
The impact of this is that the TMTP acts as a natural hedge for the risk margin to a certain extent.
There are, however, a number of limitations in using TMTP to hedge the risk margin:
it is only applicable to business written before 1 January 2016;
it may not completely offset the risk margin, owing to the “Financial Resources Requirement” test, which may cap the amount of TMTP. However, this test, as it applies on a whole balance sheet basis, can also implicitly act as a hedge for post-2015 business;
it runs off over 16 years, so the hedge becomes less effective over time;
it includes other differences besides the risk margin; and
it does not automatically respond to changes in market movements, but requires PRA permission for recalculation, which is subject to conditions, and so does not hedge small changes (typically < 50 bps) in interest rates.
This means that some additional form of hedging of the risk margin may be required for movements in markets that do not meet these criteria.
Further analysis of the use of TMTP in hedging is given in:
Appendix B: The development of the risk margin under Solvency II
B.1 European Commission Request for Advice from CEIOPS
B.1.1 Request for Advice
The European Commission issued its “Amended Framework for Consultation on Solvency II” (European Commission, 2006), seeking advice from CEIOPS on a number of issues. This paper stated the technical provisions were the sum of the best estimate and a risk margin, and included the following description of the risk margin (ibid., page 8):
The risk margin covers the risks linked to the future liability cash flows over their whole time horizon. It should be determined in a way that enables the (re)insurance obligations to be transferred or put into run-off. Such an approach protects policyholder rights and takes account of the uncertainty of valuation of the best estimate. Two possible ways to calculate this risk margin should be considered as working hypotheses. It can be calculated as the difference between the 75th percentile of the underlying probability distribution until run-off and the best estimate. However, the risk margin should as a minimum be equal to half a standard deviation in order to take account of strongly skewed distributions. Alternatively, the risk margin can be calculated based on the cost of providing SCR capital to support the business-in-force until run-off. Further quantitative impact information should be collected to assess the merits of the two methods. It would be preferable, if the same method would apply to all undertakings, irrespective of size, sophistication or type of business. However, the specificities of life and non-life insurance may require different treatments. Small undertakings could be allowed to use a simplified version of that method. If in certain circumstances it would prove to be appropriate to use different methods for determining the risk margin, this will be based on objective criteria and not subject to Member States’ discretion.
B.1.2 Response from CEIOPS – Background
The response from CEIOPS was published in Advice to the European Commission (CEIOPS, 2007, page13). This stated that the risk margin should have regard to the following issues:
Any risk premium necessary to ensure the transferability of the liabilities to a third party;
Addressing uncertainty in the valuation of the best estimate;
Achieving an appropriate level of policyholder protection over the run-off period of the liabilities; and
Supporting harmonisation by setting a quantitative standard in an explicit manner.
The response referred to the following criteria set out in a letter from Groupe Consulatif to CEIOPS (Groupe Consultatif, 2006, page 1):
The key criteria for a good risk margin are in our view:
Ease of calculation
Stability of calculation between classes and years
Consistency between different companies
Consistency with overall solvency system
Consistency with future IFRS Phase 2
As close as possible to market consistency
In addition, the risk margins should
sit on top of best estimate (defined as mean value of discounted reserves);
capture uncertainty in parameters, models and trends to ultimate;
be harmonised across Europe;
provide a sufficient level of policyholder protection together with the MCR/SCR.
The CEIOPS response also referred to the following comments from the IAIS in its 2nd liabilities paper (IAIS, 2006, page 11):
Irrespective of the particular methodology chosen, acceptable methods should reflect the inherent uncertainty in the expected future cash flows and would be expected to exhibit the following characteristics:
The less that is known about the current estimate and its trend, the higher the risk margins should be.
Risks with low frequency and high severity will have higher risk margins than risks with high frequency and low severity.
For similar risks, contracts that persist over a longer time frame will have higher risk margins than those of shorter duration
Risks with a wide probability distribution will have higher risk margins than those risks with a narrower distribution
To the extent that emerging experience reduces uncertainty, risk margins will decrease, and vice versa.
B.1.3 CEIOPS Analysis
In its response, CEIOPS considered the two methods proposed by the European Commission (percentile approach and cost-of-capital approach), together with a further method using pre-specified stress scenarios.
B.1.3.1 Percentile approach
The risk margin is defined as the difference between the 75th percentile cost of liabilities and the best estimate, subject to a minimum of half a standard deviation.
CEIOPS concluded that this provides adequate protection in the case of run-off of the portfolio, but not necessarily in the case of transfer, since there is no evidence of a link to transfer prices in the market.
It was noted that this method requires full knowledge of the probability distribution of liabilities, which may be difficult to ascertain in practice.
B.1.3.2 Cost-of-Capital Approach
The risk margin is defined as the discounted value of the cost of providing capital equal to the non-hedgeable part of the SCR, over the full lifetime of the portfolio.
This is based on the concept of what a rational investor would demand in excess of the best estimate in order to take over the liabilities. CEIOPS concluded that this approach satisfies the Commission’s requirements both in the case of transfer to another insurer or run-off.
CEIOPS noted that the key parameters and assumptions underlying this approach would need to be prescribed, including that the definition of future capital is the SCR, the setting of the cost-of-capital rate and assumptions regarding diversification and future financial risks.
It was noted that this methodology is used in the Swiss Solvency Test (SST), and that a detailed paper from the Swiss regulator FOPI describes the methodology and indicates that experience is very positive (FOPI, 2006).
The SST uses a fixed cost-of-capital rate of 6% p.a. in excess of risk-free, considered by the Swiss regulator as a reasonable estimate of the cost of capital for a strong BBB-rated company, though the evidence for this in the FOPI paper seems superficial.
B.1.3.3 Stress-Testing Approach
The risk margin is the result of pre-specified stress tests directly on the valuation of technical provisions.
This was considered as a simpler alternative to the practical problems associated with the percentile approach, and it was noted that it was well accepted by participants in QIS 2.
However, it was noted that there would be difficulties in calibrating the stress tests and ensuring consistency between lines of business.
B.1.4 CEIOPS Advice
Having considered the various issues, CEIOPS advice to the European Commission was that a risk margin should be included in technical provisions in relation to non-hedgeable risks.
The cost-of-capital approach should be used to determine the risk margin, under conditions to be defined in the Directive.
The Directive should set out that key parameters and assumptions must be prescribed by supervisors and should relate to a BBB credit rating.
B.1.5 Solvency II Directive
The Solvency II Directive was enacted in 2009.
Extracts from the Directive that are relevant to the risk margin are set out in Appendix A.
These extracts clearly reflect the advice given by CEIOPS and described above.
However, a couple of points are worth noting:
The original request for advice stated that the risk margin was to enable obligations to be secured by either transfer or run-off, and the CEIOPS response was produced on this basis. The wording of the Directive refers only to transfer to another undertaking. This change may be of significance to the definition of the risk margin, although it should be noted that if obligations are to be secured by run-off within the original insurer, there is still a requirement for adequate capital to be held, which may require recapitalisation.
The recitals refer to the reference undertaking, which is an important practical element of the definition of the risk margin. This was not referred to directly in either the original request for advice from the European Commission or the CEIOPS response.
B.2 CEIOPS Consultation on Level 2 Measures
B.2.1 Consultation
Following the drafting of the Solvency II Directive, CEIOPS carried out a consultation on the Level 2 Implementing Measures relating to the risk margin (CEIOPS, 2009a).
The proposals made by CEIOPS in the consultation related mainly to the definition of the reference undertaking and the cost-of-capital rate. In summary:
B.2.1.1 Reference undertaking
This should not be the undertaking itself, but another undertaking which is empty before the assumed transfer.
The SCR after transfer consists of underwriting risk, counterparty default risk for reinsurance, operational risk and unavoidable market risk.
Loss-absorbing capacity of technical provisions corresponds to that in the original undertaking, but there is no loss-absorbing capacity of deferred taxes.
The risk margin is calculated separately for each line of business, with no diversification.
Internal models of the original undertaking can be used where relevant.
B.2.1.2 Cost-of-capital rate
This should be consistent with the overall solvency standard of 99.5% VaR over a 1-year period and should be independent of the solvency position of the original undertaking.
It should be a long-term average rate reflecting both periods of stability and stress.
On the basis of CEIOPS analysis, which have regard to a number of modelling approaches and the methodology used in research carried out by the CRO Forum (Reference Forum2008), CEIOPS concluded that, at the time, a cost-of capital rate of at least 6% p.a. is needed.
A final calibration is required, and objective criteria for upward and downward adjustments should be established.
In addition, a formula for calculation of the risk margin was proposed, which included the requirement to discount at the risk-free rate.
B.2.2 Response to Consultation
CEIOPS published the full set of comments on the consultation on Level 2 Measures, together with a response to each comment (CEIOPS, 2009b).
A wide variety of comments were received, with considerable agreement on certain topics.
The following is a brief summary of the key objections:
the cost-of-capital rate of 6% p.a. is too high;
a process for amending the cost-of-capital rate is needed;
the reference undertaking should not be assumed to be empty; and
diversification between lines of business should be allowed for.
As indicated in section 6.6, Hans Waszink commented to the effect that the discount rate used to determine the risk margin should not be the risk-free rate, but should be set to equal the cost-of-capital rate, in order to ensure that the cost of capital cannot exceed the amount of capital provided. This was not accepted by CEIOPS.
B.2.3 CEIOPS Final Advice
Having considered comments made, final advice was published (CEIOPS, 2009c). There were no significant changes from the original proposals.
The recommendations were generally accepted and they were incorporated into the Implementing Measures (since renamed the Delegated Regulation). One significant difference from the CEIOPS advice is that diversification between lines of business (but not between life and non-life business) was subsequently permitted.
Appendix C: Survey of Insurers – Questionnaire
IFoA Risk Margin Working Party – Survey Questionnaire
1 Methods used to Calculate the Risk Margin
Q1 Material business lines separately for in-force and new business (Yes/No)
Annuity/Health/Protection/Unit-linked/With-profits/Other
Q2 Size of the firm’s technical provisions (Q4 2017)
Q3 Model used for SCR
Standard Formula/Internal Model/Partial Internal Model
Q4 If Standard Formula, does firm apply Undertaking Specific Parameters?
Q5 If Partial Internal Model is used for Q4 2017, which risks are internally modelled?
2 SCR Stresses
Q6 Is there any material difference in the methodology (other than for MA or VA) to calculate the value of SCR stresses between SCR for Pillar 3 disclosure and the risk margin calculation, for risks included in the risk margin?
Q7 Is any underwriting risk treated as hedgeable for the risk margin?
Q8 Is any market risk treated as non-hedgeable/residual for the risk margin?
Q9–12 Provide the risk margin as % of SCR and BEL for the Q1–Q4 2017 and sensitivity to changes in risk-free interest rates, where available. Where relevant, provide separate results for annuity business.
Q13 Do you hold some form of risk allowance for non-hedgeable risks on your Pillar 2 balance sheet?
Q14 If Yes to Q13, is this calculated on the same basis as Pillar 1?
Q15 If No to Q14, in which areas do they diverge, for example, cost-of-capital, risks, run-off method, discount rate, etc.?
-
3 Survey Questions on Approach/design of Risk Margin
Q16 Is the risk margin a material discussion point in governance committees?
If Yes, what actions are being considered to manage/mitigate it such as hedging, a review of approach/methodology, or risk transfer. Provide brief comments.
Q17 directs Standard Formula firms to Q22
Q18 (For Internal Model and Partial Internal Model Firms) When calculating the SCR, does the firm allow for the risk margin to change in scenario-based calculations?
Q19 If Yes to Q18, what are the main issues faced in this approach, and has the firm quantified the impact?
Q20 If the firm has quantified the impact, provide the range of estimated impact on SCR.
Q21 If No to Q18, why not?
Q22 Has the firm incorporated or considered incorporating any management action within the risk margin calculation?
If yes, provide briefly the nature of the management action.
4 Potential Improvements: Risk Margin Methodology
Q23−29 Answer Support/Don’t support. Please provide brief comments.
Q23 Making cost-of-capital dynamic, that is, linked with the interest rate environment and/or the firm’s actual cost of capital
Q24 Discounting the cost-of-capital amounts using risk-free + VA
Q25 Allowing for VA in the calculation of RM SCR.
Q26 Allowing the VA to change dynamically in the SCR/RM SCR calculation.
Q27 Discounting the cost-of-capital amounts using risk-free + MA for MA Portfolios.
Q28 Allowing for MA in the calculation of RM SCR.
Q29 Other ideas not discussed above
-
5 Approach to Calculating IFRS 17 Risk Adjustment
Q30 Has the firm considered the approach to be used for calculating the IFRS 17 risk adjustment?
Q31 If Yes to Q30, is this along the lines of Solvency II risk margin?
Q32 If Yes to Q30, please provide brief comments on main areas in which the calculation differs
Q33 If No to Q30, briefly provide the current view of the approach
Appendix D: The working party’s model
The model projects results for a monoline annuity firm, writing immediate annuity business with no reinsurance. It projects benefit and expense cash flows for a model age of 65 years and an assumed gender mix. The relevant stresses in the model for longevity, expenses and operational risks to assess the risk capital are as per the standard formula.
The model projects risk capital by projecting the cash flows on best estimate assumptions until the point of projection and then applies the stresses to the relevant assumptions. It calculates the projected BEL and stressed BEL for each of the above risks at each projection period. The risk capital is then calculated as the difference between the stressed BEL and the BEL. The model does not use risk drivers to project risk capital.
These projected capital amounts for each risk at each projection point are then aggregated using the variance–covariance approach using correlations as per the standard formula. The aggregated capital is used to calculate the cost for that period and discounted using the EIOPA sterling risk-free rates across all projection periods to give the risk margin. No allowance has been made for the MA or the VA in either calculating risk capital for calculating cost of capital or for discounting the cost of capital to current period.
Table 8 shows model results (RM % of BEL, SCR and duration) with sensitivities to significant assumption and comparison with the base position. The WP members believe that using a different set of assumptions would not lead to materially different conclusion.
Table 8. Model results

D.1 Assumptions used in the Model
The base position is level annuities starting at age of 65 years, with appropriate allowance for expenses.
A realistic mortality table has been used, with blended rates across male and female population.
Actual 31 December 2018 EIOPA risk-free rates have been used for base position. Where results have been shown over time, actual monthly EIOPA rates have been used.
The base position includes an allowance for MA of 100 bps in the calculation of BEL. Neither the RM SCR nor the discount factors used for the cost of capital allow for the MA. The results do not allow for transitional measures or reinsurance.
The indexation sensitivity assumes an annuity increase rate of 1.5% p.a. being the average of annuity portfolio at different indexation.
Diversification between longevity and expense risk is allowed for, in accordance with the standard formula.
Appendix E: International practices
In this Appendix, we give an overview of measures similar to the risk margin, which are added to best estimates (or “current estimates” as they are often called internationally) when calculating insurance liabilities for regulatory purposes outside the EEA.
A full study of international practices was outside of the working party’s scope, and the discussion in this Appendix is neither comprehensive nor definitive, but reflects our understanding of different regimes.
This is also an evolving area, with regimes changing in line with developments in ICS (see section 7.7). However, these different approaches and proposals illustrate a number of the alternative approaches discussed in section 7.
E.1 Switzerland and Bermuda
As noted in section B1.3 of Appendix B, the SST introduced a cost-of-capital method, with a cost-of-capital of 6% above risk-free, before this was introduced into Solvency II, and which informed the Solvency II calibration by CEIOPS (2007).
The Bermudan Solvency II equivalent economic capital regime follows the Solvency II approach of a cost-of-capital method with the 6% cost-of-capital parameter.
E.2 Australia (non-life)
For non-life companies, the Australian Prudential Regulation Authority (APRA, 2019) requires a risk margin to be added to the central estimate such that the total insurance liabilities are at least:
set at a 75% level of confidence, or, if higher
the mean of the distribution plus one half of a standard deviation
This is the run-off percentile approach originally considered as an alternative in Solvency II, as discussed in section 7.1 and Appendix B, and indeed CEIOPS (2007) referred to this Australian precedent.
E.3 China
China introduced a new risk-based capital method, China Risk-Orientated Solvency System (C-ROSS), in 2016. Under C-ROSS, liabilities consist of a base best estimate plus a risk margin.
The risk margin is determined by applying a prescribed scenario to the base assumptions, where each key assumption has a simultaneous margin added for prudence, as per Table 9, taken from Milliman (2015):
Table 9. China – risk margin scenarios

In the terms used in this paper, this is an example of the PAD approach described in section 7.2.
The working party is not clear how these defined stress levels have been set, and in particular whether or not these have been calibrated, in aggregate, to some specific confidence level across the industry
E.4 Hong Kong
Hong Kong is currently testing a new Risk-Based Capital (RBC) framework. Our understanding of the regime is based on the technical specifications for the QIS 2.
According to Milliman (2018), the technical provisions comprise a current estimate and an additional MOCE.
The MOCE is determined by applying shocks to individual assumptions for expenses and insurance risk which are set at a 75th percentile, although excluding mass lapse and catastrophe risk. These shocks are calibrated based on the 99.5th percentile shocks specified for the Prescribed Capital Requirement (PCR), the SCR equivalent. Examples are given in Table 10. It can be observed that most of the PCR shocks are identical to the Solvency II standard formula.
Table 10. Hong Kong – Assumptions for MOCE and PCR

The 75th percentile MOCE assumptions are, as can be seen, approximately 26% of the 99.5th percentile assumptions in the PCR, which is consistent with a normal distribution – see section 7.7.
The additional provisions arising from these shocks are aggregated using the same correlation matrix as specified for the PCR to give an overall 75th percentile.
This is an example of the VaR approach in section 7.3 and is very close in concept to the P-MOCE under ICS (see section 7.7), although the latter converts from a 99.5th percentile to 75th percentile, using a normal distribution, at aggregate level.
Insurers may also provide additional sensitivities on a cost-of-capital approach on a voluntary basis, using a 6% cost-of-capital parameter, but the default in the impact study is the P-MOCE style approach. The cost-of-capital approach tested includes a wider range of risks such as all insurance risks (including mass lapse and mass catastrophe), expenses but also counterparty default and operational risks.
The Insurance Authority notes that the P-MOCE “is the same as the calculation in PCR except with lower stress parameters”.
The resulting P-MOCE cannot be offset against the PCR, nor can it be treated as part of available capital.
E.5 Singapore
Under the current RBC framework in Singapore a PAD, also commonly referred to as a risk margin, is required over the BEL. This is to be determined by judgement of the appointed actuary, under a Guidance Note issued by the Singapore Actuarial Society (2018).
In practice, the risk margin is typically taken as 50% of the risk capital held against insurance risk, that is, in practice similar to the method used in Hong Kong and the P-MOCE under ICS. The 50% factor is higher than that used in those other regimes, but the risk capital under the current Singapore regime is not calibrated to a 99.5% 1-year VaR.
Singapore is currently testing a new RBC2 framework, which would move risk capital to a 99.5th percentile 1-year VaR. As currently planned the guidance for calculation of the PAD will remain unchanged, although actuaries may wish to recalibrate the relative levels of the PAD and risk capital. A cost-of-capital method was considered but did not receive positive feedback from insurers.
Singapore permits the risk margin to be offset against the capital requirement (see discussion in section 7.7.1).
E.6 United States
Statutory liabilities for United States insurers are set based on prescribed formulae, which broadly target the 85th percentile liabilities for the industry as a whole. This prudence is achieved via a combination of prudent mortality and discount rate assumptions (for life insurers), and the general approach has remained unchanged in recent times. The original rationale for this level of protection is not well documented, but is believed to have targeted broadly one standard deviation of the normal distribution. The working party has not found evidence to suggest that a “market value of insurance liabilities” has in any sense been targeted.
The RBC requirement is then calibrated by regulators such that, when added to the statutory liabilities, an overall 95th percentile confidence level over the lifetime of the liabilities is obtained. The (broadly) 85th percentile prudence and the 95th percentile capital are therefore non-additive, hence the prudence within the statutory liabilities can be seen as being loss-absorbing within the RBC calculation.
E.7 Lloyds of London
In the Lloyds of London market, insurers are assessed on two bases:
-
1. 1-year SCR plus a risk margin, under Solvency II; and
-
2. “SCR to ultimate”, that is, full run-off to expiry, with no intermediate tests of solvency, and including a gain from the risk margin running off to zero.
The second test is essentially the run-off capitalisation approach discussed in section 7.4.
Appendix F: Extracts from Solvency II Directive, Regulations and Guidelines
This Appendix sets out extracts from the Solvency II Directive, Delegated Regulation and EIOPA Guidelines, covering the main legal and regulatory provisions relating to the risk margin.
F.1 Solvency II Directive (Level 1)
Recitals
-
(55) The value of technical provisions should therefore correspond to the amount an insurance or reinsurance undertaking would have to pay if it transferred its contractual rights and obligations immediately to another undertaking. Consequently, the value of technical provisions should correspond to the amount which another insurance or reinsurance undertaking (the reference undertaking) would be expected to require to take over and fulfil the underlying insurance and reinsurance obligations. …
-
(56) The assumptions made about the reference undertaking assumed to take over and meet the underlying insurance and reinsurance obligations should be harmonised throughout the Community. In particular, the assumptions made about the reference undertaking that determine whether or not, and if so to what extent, diversification effects should be taken into account in the calculation of the risk margin should be analysed as part of the impact assessment of implementing measures and should then be harmonised at Community level
Article 77 Calculation of technical provisions
-
1. The value of technical provisions shall be equal to the sum of a best estimate and a risk margin as set out in paragraphs 2 and 3. …
-
2. The risk margin shall be such as to ensure that the value of the technical provisions is equivalent to the amount that insurance and reinsurance undertakings would be expected to require in order to take over and meet the insurance and reinsurance obligations.
-
3. Insurance and reinsurance undertakings shall value the best estimate and the risk margin separately.
However, where future cash flows associated with insurance or reinsurance obligations can be replicated reliably using financial instruments for which a reliable market value is observable, the value of technical provisions associated with those future cash flows shall be determined on the basis of the market value of those financial instruments. In this case, separate calculations of the best estimate and the risk margin shall not be required.
-
4. Where insurance and reinsurance undertakings value the best estimate and the risk margin separately, the risk margin shall be calculated by determining the cost of providing an amount of eligible own funds equal to the Solvency Capital Requirement necessary to support the insurance and reinsurance obligations over the lifetime thereof.
The rate used in the determination of the cost of providing that amount of eligible own funds (cost-of-capital rate) shall be the same for all insurance and reinsurance undertakings and shall be reviewed periodically.
The cost-of-capital rate used shall be equal to the additional rate, above the relevant risk-free interest rate, that an insurance or reinsurance undertaking would incur holding an amount of eligible own funds, as set out in section 4, equal to the Solvency Capital Requirement necessary to support insurance and reinsurance obligations over the lifetime of those obligations.
Article 86 Delegated Acts and Regulatory and Implementing Technical Standards
-
1. The Commission shall adopt delegated acts in accordance with Article 301a laying down the following: …
-
(a) the circumstances in which technical provisions shall be calculated as a whole, or as a sum of a best estimate and a risk margin, and the methods to be used in the case where technical provisions are calculated as a whole, as referred to in Article 77(4);
-
(b) the methods and assumptions to be used in the calculation of the risk margin including the determination of the amount of eligible own funds necessary to support the insurance and reinsurance obligations and the calibration of the cost-of-capital rate, as referred to in Article 77(5); …
-
F.2 Delegated Regulation (Level 2)
Recitals
-
(18) The calculation of the risk margin should be based on the assumption that the whole portfolio of insurance and reinsurance obligations is transferred to another insurance or reinsurance undertaking. In particular, the calculation should take the diversification of the whole portfolio into account.
-
(19) The calculation of the risk margin should be based on a projection of the Solvency Capital Requirement that takes the risk mitigation of reinsurance contracts and special purpose vehicles into account. Separate calculations of the risk margin gross and net of reinsurance contracts and special purpose vehicles should not be stipulated.
-
(130) The calculation of the risk margin of technical provisions at the level of the group in accordance with method 1 (accounting consolidation-based method) should be based on the assumption that the transfer of the group’s insurance and reinsurance obligations is carried out separately for each insurance and reinsurance undertaking of the group and that the risk margin does not allow for the diversification between the risks of those undertakings. In relation to undertakings referred to in Article 73(2) and (5) of Directive 2009/138/EC, the calculation should be based on the assumption that the transfer of the portfolio insurance obligations for life and non-life activities is carried out separately.
Article 37 Calculation of the Risk Margin
-
1. The risk margin for the whole portfolio of insurance and reinsurance obligations shall be calculated using the following formula:
where $$RM = CoC.{\mkern 1mu} {\rm{ }}\sum\nolimits_{t \ge 0} {{{SCR\left( t \right)} \over {{{\left( {1 + r\left( {t + 1} \right)} \right)}^{t + 1}}}}} $$
CoC denotes the cost-of-capital rate; the sum covers all integers including zero; SCR(t) denotes the Solvency Capital Requirement referred to in Article 38(2) after t years; r(t + 1) denotes the basic risk-free interest rate for the maturity of t + 1 years.

The basic risk-free interest rate r(t + 1) shall be chosen in accordance with the currency used for the financial statements of the insurance and reinsurance undertaking.
-
2. Where insurance and reinsurance undertakings calculate their Solvency Capital Requirement using an approved internal model and determine that the model is appropriate to calculate the Solvency Capital Requirement referred to in Article 38(2) for each point in time over the lifetime of the insurance and reinsurance obligations, the insurance and reinsurance undertakings shall use the internal model to calculate the amounts SCR(t) referred to in paragraph 1.
-
3. Insurance and reinsurance undertakings shall allocate the risk margin for the whole portfolio of insurance and reinsurance obligations to the lines of business referred to in Article 80 of Directive 2009/138/EC. The allocation shall adequately reflect the contributions of the lines of business to the Solvency Capital Requirement referred to in Article 38(2) over the lifetime of the whole portfolio of insurance and reinsurance obligations.
Article 38 Reference Undertaking
-
1. The calculation of the risk margin shall be based on all of the following assumptions:
-
(a) the whole portfolio of insurance and reinsurance obligations of the insurance or reinsurance undertaking that calculates the risk margin (the original undertaking) is taken over by another insurance or reinsurance undertaking (the reference undertaking);
-
(b) notwithstanding point (a), where the original undertaking simultaneously pursues both life and non-life insurance activities according to Article 73(5) of Directive 2009/138/EC, the portfolio of insurance obligations relating to life insurance activities and life reinsurance obligations and the portfolio of insurance obligations relating to non-life insurance activities and non-life reinsurance obligations are taken over separately by two different reference undertakings;
-
(c) the transfer of insurance and reinsurance obligations includes any reinsurance contracts and arrangements with special purpose vehicles relating to these obligations;
-
(d) the reference undertaking does not have any insurance or reinsurance obligations or own funds before the transfer takes place;
-
(e) after the transfer, the reference undertaking does not assume any new insurance or reinsurance obligations;
-
(f) after the transfer, the reference undertaking raises eligible own funds equal to the Solvency Capital Requirement necessary to support the insurance and reinsurance obligations over the lifetime thereof;
-
(g) after the transfer, the reference undertaking has assets which amount to the sum of its Solvency Capital Requirement and of the technical provisions net of the amounts recoverable from reinsurance contracts and special purpose vehicles;
-
(h) the assets are selected in such a way that they minimise the Solvency Capital Requirement for market risk that the reference undertaking is exposed to;
-
(i) the Solvency Capital Requirement of the reference undertaking captures all of the following risks:
-
(i) underwriting risk with respect to the transferred business,
-
(ii) where it is material, the market risk referred to in point (h), other than interest rate risk,
-
(iii) credit risk with respect to reinsurance contracts, arrangements with special purpose vehicles, intermediaries, policyholders and any other material exposures which are closely related to the insurance and reinsurance obligations,
-
(iv) operational risk;
-
-
(j) the loss-absorbing capacity of technical provisions, referred to in Article 108 of Directive 2009/138/EC, in the reference undertaking corresponds for each risk to the loss-absorbing capacity of technical provisions in the original undertaking;
-
(k) there is no loss-absorbing capacity of deferred taxes as referred to in Article 108 of Directive 2009/138/EC for the reference undertaking;
-
(l) the reference undertaking will, subject to points (e) and (f), adopt future management actions that are consistent with the assumed future management actions, as referred to in Article 23, of the original undertaking.
-
-
2. Over the lifetime of the insurance and reinsurance obligations, the Solvency Capital Requirement necessary to support the insurance and reinsurance obligations referred to in the first subparagraph of Article 77(5) of Directive 2009/138/EC shall be assumed to be equal to the Solvency Capital Requirement of the reference undertaking under the assumptions set out in paragraph 1.
-
3. For the purposes of point (i) of paragraph 1, a risk shall be considered to be material where its impact on the calculation of the risk margin could influence the decision-making or the judgement of the users of that information, including supervisory authorities.
Article 58 Simplified Calculation of the Risk Margin
Without prejudice to Article 56, insurance and reinsurance undertakings may use simplified methods when they calculate the risk margin, including one or more of the following:
-
(a) methods which use approximations of the amounts denoted by the terms SCR(t) referred to in Article 37(1);
-
(b) methods which approximate the discounted sum of the amounts denoted by the terms SCR(t) as referred to in Article 37(1) without calculating each of those amounts separately.
Article 59 Calculations of the Risk Margin During the Financial Year
Without prejudice to Article 56, insurance and reinsurance undertakings may derive the risk margin for calculations that need to be performed quarterly from the result of an earlier calculation of the risk margin without an explicit calculation of the formula referred to in Article 37(1).
Article 83 Solvency Capital Requirement Standard Formula – Scenario Based Calculations
-
1. Where the calculation of a module or sub-module of the Basic Solvency Capital Requirement is based on the impact of a scenario on the basic own funds of insurance and reinsurance undertakings, all of the following assumptions shall be made in that calculation:
-
(a) the scenario does not change the amount of the risk margin included in technical provisions; …
-
Article 340 Group Solvency: Calculation Methods – Method 1: Risk Margin
The consolidated risk margin of technical provisions on the basis of the consolidated data shall be equal to the sum of the following:
(a) the risk margin of the participating insurance or reinsurance undertaking;
(b) the proportional share, as referred to in Article 221(1)(a) of Directive 2009/138/EC, of the risk margin of the related insurance or reinsurance undertakings and third-country insurance or reinsurance undertakings referred to in Article 335(1)(a) and (c) of this Regulation.
F.3 EIOPA Guidelines (Level 3)
F.3.1 Guidelines on the Valuation of Technical Provisions (EIOPA, 2014)
Guideline 61 – Methods to calculate the risk margin
1.109. Insurance and reinsurance undertakings should assess whether a full projection of all future Solvency Capital Requirements is necessary in order to reflect the nature, scale and complexity of the risks underlying the reference undertaking’s insurance and reinsurance obligations in a proportionate manner. In such case, undertakings should carry out these calculations. Otherwise, alternative methods may be used to calculate the risk margin, ensuring that the method chosen is adequate to capture the risk profile of the undertaking.
1.110. Where simplified methodologies are used to calculate the best estimate, the undertakings should assess the consequent impact that the use of such methodologies may have on the methods available to calculate the risk margin, including the use of any simplified methods for projecting the future SCRs.
1.111 Guideline 62 – Hierarchy of methods for the calculation of the risk margin
1.112. When deciding which level of the hierarchy set out below is most appropriate, insurance and reinsurance undertakings should ensure that the complexity of the calculations does not go beyond what is necessary in order to reflect the nature, scale and complexity of the risks underlying the reference undertaking’s insurance and reinsurance obligations in a proportionate manner.
1.113. Undertakings should apply the hierarchy of methods consistently with the framework set out when defining the proportionality principle and the necessity of assessing risks properly.
1.114. Insurance and reinsurance undertakings should use the following hierarchy as a decision-making basis regarding the methods to be used for projecting future Solvency Capital Requirements:
(Method 1) To approximate the individual risks or subrisks within some or all modules and sub-modules to be used for the calculation of future Solvency Capital Requirements as referred to in Article 58(a) of Commission Delegated Regulation 2015/35.
(Method 2) To approximate the whole Solvency Capital Requirement for each future year as referred in Article 58 (a)of Commission Delegated Regulation 2015/35, inter alia using the ratio of the best estimate at that future year to the best estimate at the valuation date.
This method is not appropriate when negative best estimate values exist at valuation date or subsequent dates.
This method takes into account the maturity and the run-off pattern of the obligations net of reinsurance. Consequently, some considerations should be given regarding the manner in which the best estimate of technical provisions net of reinsurance has been calculated. Further consideration should be given as well as to whether the assumptions regarding the risk profile of the undertaking can be considered unchanged over time. This includes
-
(a) for all underwriting risks, to consider if the composition of the subrisks in underwriting risk is the same;
-
(b) for counterparty default risk, to consider if the average credit standing of reinsurers and special purpose vehicles is the same;
-
(c) for market risk, to consider if the material market risk in relation to the net best estimate is the same;
-
(d) for operational risk, to consider if the proportion of reinsurers’ and special purpose vehicles share of the obligations is the same;
-
(e) for adjustment, to consider if the loss-absorbing capacity of the technical provisions in relation to the net best estimate is the same.
If some or all of these assumptions do not hold, the undertaking should carry out at least a qualitative assessment of how material the deviation from the assumptions is. If the impact of the deviation is not material compared to the risk margin as a whole, then this method can be used. Otherwise, the undertaking should either adjust the formula appropriately or be encouraged to use a more sophisticated method.
-
(Method 3) To approximate the discounted sum of all future Solvency Capital Requirements in a single step without approximating the Solvency Capital Requirements for each future year separately as referred in Article 58 (b) of Commission Delegated Regulation 2015/35, inter alia using the modified duration of the insurance liabilities as a proportionality factor.
When deciding on the application of a method based on the modified duration of the insurance liabilities, attention should be paid to the value of modified duration to avoid meaningless results for the risk margin.
This method takes into account the maturity and the run-off pattern of the obligations net of reinsurance. Consequently, some considerations should be given regarding the manner in which the best estimate of technical provisions net of reinsurance has been calculated. Further consideration should be given as to whether the assumptions regarding the risk profile of the undertaking can be considered unchanged over time. This includes
-
(a) for basic SCR, to consider if the composition and the proportions of the risks and subrisks do not change over the years;
-
(b) for counterparty default risk, to consider if the average credit standing of reinsurers and SPVs remains the same over the years;
-
(c) for operational risk and counterparty default risk, to consider if the modified duration is the same for obligations net and gross of reinsurance;
-
(d) to consider if the material market risk in relation to the net best estimate remains the same over the years;
-
(e) for adjustment, to consider if the loss-absorbing capacity of the technical provisions in relation to the net best estimate remains the same over the years.
An undertaking that intends to use this method should consider to what extend these assumptions are fulfilled. If some or all of these assumptions do not hold, the undertaking should carry out at least a qualitative assessment of how material the deviation from the assumptions is. If the impact of the deviation is not material compared to the risk margin as a whole, then the simplification can be used.
Otherwise, the undertaking should either adjust the formula appropriately or be encouraged to use a more sophisticated method.
-
(Method 4) To approximate the risk margin by calculating it as a percentage of the best estimate.
According to this method, the risk margin should be calculated as a percentage of the best estimate technical provisions net of reinsurance at valuation date. When deciding on the percentage to be used for a given line of business, the undertaking should take into account that this percentage is likely to increase if the modified duration of the insurance liabilities – or some other measure of the run-off pattern of these liabilities – increases.
Undertakings should give due consideration to the very simplistic nature of this approach; it should be used only where it has been demonstrated that none of the more sophisticated risk margin approaches in the above hierarchy can be applied.
When undertakings rely on this method for the calculation of the risk margin, they will need to justify and document the rationale for the percentages used by line of business. This justification and rationale should consider any specific characteristics of the portfolios being assessed. Undertakings should not use this method when negative best estimate values exist.
Without prejudice to the proportionality assessment and the provisions in Article 58 of Commission Delegated Regulation 2015/35, insurance and reinsurance undertakings may use the simplifications defined in Technical Annex IV when applying the hierarchy of methods.
Guideline 63 – Allocation of the overall risk margin
Where it is overly complex to calculate the contribution of the individual lines of business to the overall Solvency Capital Requirement during the lifetime of the whole portfolio in an accurate manner, insurance and reinsurance undertakings should be allowed to apply simplified methods to allocate the overall risk margin to the individual lines of business which are proportionate to the nature, scale and complexity of the risks involved. The methods applied should be consistent over time.
F.3.2 Guidelines on the Implementation of the Long-Term Guarantee Measures (EIOPA, 2015)
Guideline 2 – Interaction of the long-term guarantee measures with the risk margin calculation
1.10. For the purposes of calculating the risk margin in accordance with Article 38 of the Delegated Regulation, insurance and reinsurance undertakings that apply the matching adjustment, the volatility adjustment, the transitional measure on the risk-free interest rates or the transitional measure on technical provisions should assume that the reference undertaking does not apply any of these measures.
Appendix G: Brief literature review
Below, we provide a short selection of professional and academic research papers which may be of interest. This is not intended to be an exhaustive review of the literature.
G.1 Professional Research
The aim of the IFoA sessional paper A review of Solvency II: has it met its objectives? (Rae et al., Reference Rae, Barrett, Brooks, Chotai, Pelkiewicz and Wang2017) was to provide a broad review of several aspects of the Solvency II balance sheet, particularly those affecting life insurers, in order to enable the actuarial profession to influence the 2017 EIOPA Solvency II review and the Treasury Committee proceedings. While the focus of the paper is on the long-term guarantee measures, a significant section is devoted to the risk margin, and this can be seen as a forerunner to the current paper. The authors observe the excessive sensitivity of the risk margin to interest rates and propose an urgent review focusing on the fundamental purpose of the risk margin, addressing questions such as whether coverage of the future cost of capital is an end in itself or a means to an end, and whether this requirement leads to excessive policyholder protection. Several possible solutions are listed, most of which have been addressed in more in detail in this paper.
A useful exploration of the technical debates surrounding the risk margin, at a time when the Solvency II regulations were still under development, is given in the SIAS paper Demystifying the Risk Margin: theory, practice and regulation. (Brown, Reference Brown2012) The author takes the clear view that the purpose of the Risk Margin is to strike a market-consistent value of liabilities, and that “the presence of a risk margin cannot be used as an argument for lower capital requirements… because the capital requirements and the risk margin are doing different jobs” (ibid., p.4). Regarding the scope of risks for inclusion in the calculation, it is argued that hedgeability is not binary and lists a number of examples of risks whose hedgeability is unclear, including annuitant longevity on grounds of “possible basis risk, and lack of deep and liquid market” (ibid., p.20). On the cost-of-capital rate, the author outlines a wide variety of estimation approaches, and the correspondingly wide range of results obtained, stating a range of between 2.5% and 10%. There is also a comprehensive discussion around diversification, and the various views regarding the appropriate level of diversification to allow for in the calculation; in particular, the emerging Solvency II approach of assuming the reference undertaking to be an empty shell is seen to be unrealistic and containing “a possible excess of prudence” (ibid., p.19. There is also a useful comparison to the then emerging IFRS Insurance Phase II standard and other regulatory regimes.
G.2 Academic Research
In Maximum market price of longevity risk under solvency regimes: The case of Solvency II (Levantessi and Menzietti, Reference Levantessi and Menzietti2017), a framework is proposed for deriving a maximum value for the market price of longevity risk in the absence of a deep and liquid longevity market. In this framework, it is assumed that the maximum price an insurer would pay to transfer longevity risk is equal to the risk margin, with little reference being made to actual historical transaction data. The maximum market price of longevity risk, based on the selected stochastic mortality model (three-factor Cairns–Blake–Dowd model with cohort effects), is then imputed from the risk margin and can then be used to price a range of longevity-linked securities using risk-neutral pricing. While the approach and results are interesting, the reliance on the existing Solvency II definition of risk margin for calibration make this research less relevant for our purposes, that is, to assess the appropriateness of the existing rules.
Risk-neutral pricing and the market price of longevity risk also features in Longevity risk, cost of capital and hedging for life insurers under Solvency II (Meyricke and Sherris, Reference Meyricke and Sherris2014). Here, the market price of longevity risk is derived from an actual historical transaction (although the authors acknowledge the sparsity of available calibration data and provide results for a range of values) based on an assumed stochastic mortality model (single-factor diffusion). Comparison of the risk margin and a theoretical cost of hedging longevity risk is then possible and is shown for a range of policyholder ages and swap terms. The theoretical hedging cost is shown to increase more rapidly (as a proportion of liabilities) with age than the corresponding risk margin, giving scope for optimisation in insurers’ longevity hedging/reinsurance strategies.
Fair valuation of insurance liabilities: merging actuarial judgement and market-consistency (Dhaene et al., Reference Dhaene, Stassen, Barigou, Linders and Chen2017) introduces the concept of a “hybrid” insurance liability which consists of components that are hedgeable as well as components whose values are independent of the prices of tradeable assets. Methods are proposed for fair-valuing these liabilities, where “fair value” is defined as the combination of market-consistent value for hedgeable components and “actuarial value”, that is, real-world expectation plus risk margin, for other components. The method involves determining an optimal hedging strategy for the hybrid claim, for example, the “mean-variance hedge” which corresponds to quadratic utility maximisation. One example given, of potential relevance to the risk margin debate, is that of a longevity-based claim that is partially hedged by population-based longevity index swaps; in this case the actuarial value, including risk margin, relates only to residual basis risk. (Although index swaps bring a degree of standardisation and transparency to the longevity transfer market, relative to longevity reinsurance which currently dominates, the longevity insurance-linked securities market is not sufficiently developed at present to be considered deep and liquid and therefore to provide a reliable hedging cost.)


 Open access