


Phosphorus is an essential element in agriculture, and its deficiency can limit terrestrial plant growth (Vitousek & Howarth, Reference Vitousek and Howarth1991; Smith et al., Reference Smith, Tilman and Nekola1999). As a result, phosphate is applied globally in fertilizers. In recent years, the use of phosphate fertilizers has increased significantly in Asia (Lu & Tian, Reference Lu and Tian2017), but decreased in Europe, the latter due, in part, to concern over watercourse pollution. Leaching of excess phosphorus from soil into groundwater either as orthophosphate, organic and inorganic phosphorus or soluble mineral species can result in significant environmental problems such as eutrophication (Weng et al., Reference Weng, Van Riemsdijk and Hiemstra2012). Further detrimental consequences including loss of aquatic life, increased algal blooms and oxygen depletion of the water, amongst others (Carpenter et al., Reference Carpenter, Caraco, Correll, Howarth, Sharpley and Smith1998), often result. Excessive phosphorus use can therefore threaten environmental systems whilst increasing the risk of shortages of this finite resource – with recent estimates warning of a rapid depletion of economic sources of phosphorus over the next century (Oelkers & Valsami-Jones, Reference Oelkers and Valsami-Jones2008).
Sorption of phosphate by clay minerals plays a key role in determining phosphorus availability in the soil system (Gustafsson et al., Reference Gustafsson, Mwamila and Kergoat2012; Gérard, Reference Gérard2016). As halloysite is found in soils worldwide, especially in tropical soils (White & Dixon, Reference White and Dixon2002), an understanding of the conditions of adsorption of phosphate onto the halloysite surface is needed. Additionally, the increasing use of halloysite in many emerging technologies requires an improved understanding of the surface chemistry of halloysite beyond the currently simplistic models that are usually assumed. In this context, the adsorption behaviour of the phosphate anion is a useful reference molecular probe of the surface chemistry characteristics of halloysite nanotubes.
The mineral halloysite was first reported by Berthier (Reference Berthier1826). Halloysite is a member of the kaolin group or subgroup of minerals and, in its fully hydrated state, it has the ideal unit formula Al2Si2O5(OH)4.2H2O. It is found in rocks and soils worldwide and can occur naturally in a variety of morphologies, the most common being tubular (Joussein et al., Reference Joussein, Petit, Churchman, Theng, Righi and Delvaux2005). In recent years, the tubular form of halloysite nanotubes (HNTs), with their nanoscale central lumen (Fig. 1c), along with other useful physical and chemical properties such as high length to diameter ratio and lack of toxicity (Vergaro et al., Reference Vergaro, Abdullayev, Lvov, Zeitoun, Cingolani, Rinaldi and Leporatti2010; Fakhrullina et al., Reference Fakhrullina, Akhatova, Lvov and Fakhrullin2015; dos Santos et al., Reference dos Santos, Rozynek, Hansen, Hartmann-Petersen, Klitgaard and Løbner-Olesen2017), have been central to halloysite's increasing application in existing and emerging technologies such as drug-delivery systems, polymer nanocomposites (Massaro et al., Reference Massaro, Lazzara, Milioto, Noto and Riela2017), flame-retardant materials and batteries (Lin et al., Reference Lin, Wang, Liu and Miller2017), amongst many others (Yuan et al., Reference Yuan, Tan and Annabi-Bergaya2015). Often, especially in studies of the application of halloysite in new technologies, a rather simplistic view of the halloysite structure is adopted that depicts a uniform and continuous outer siloxane surface and an inner aluminol surface, as shown in Fig. 1 (Yuan et al., Reference Yuan, Tan and Annabi-Bergaya2015; Kim et al., Reference Kim, Kim, Lee, Seo and Lim2017; Rostamzadeh et al., Reference Rostamzadeh, Islam Khan, Riche’, Lvov, Stavitskaya and Wiley2017). Furthermore, these two surfaces are often labelled as distinctly charged, with the outer siloxane surface exclusively negatively charged and the inner aluminol surface positively charged (Bretti et al., Reference Bretti, Cataldo, Gianguzza, Lando, Lazzara, Pettignano and Sammartano2016; Massaro et al., Reference Massaro, Lazzara, Milioto, Noto and Riela2017). Studies on the surface charge of kaolinites have highlighted two distinct sources of charge: the in-plane basal sites in the tetrahedral sheet and the edge sites of both the octahedral and tetrahedral sheets, where charge is pH dependent (Zhou & Gunter William, Reference Zhou and Gunter William1992; Brady et al., Reference Brady, Cygan and Nagy1996; Gu & Evans, Reference Gu and Evans2008). The permanent charge on the siloxane sheet arises due to isomorphic substitution of Al3+/Fe3+ for Si4+. However, Sposito (Reference Sposito1984) suggests that the charge of the siloxane basal sheets is negligible because the degree of ionic substation is very small; indeed, he estimated the layer charge at <0.01 per [(Si4)(Al4)O10(OH)8] formula unit. The hydroxyl edge sites of both the alumina and siloxane sheets are proton donor groups that can form complexes with metal cations. In comparison, for anion adsorption, silanol groups have a pKa(int) of 8.23 compared to that of the aluminol edge sites (pKa = 5.28) (Brady et al., Reference Brady, Cygan and Nagy1996); hence, only the aluminol moieties (Al-OH) can act as proton acceptor groups. These protonated aluminol sites have been shown to be the sites of anion adsorption in kaolin group minerals (Theng et al., Reference Theng, Russell, Churchman and Parfitt1982; Van Emmerik et al., Reference Van Emmerik, Sandström, Antzutkin, Angove and Johnson2007; Han et al., Reference Han, Liu, Zhou and Chen2016).
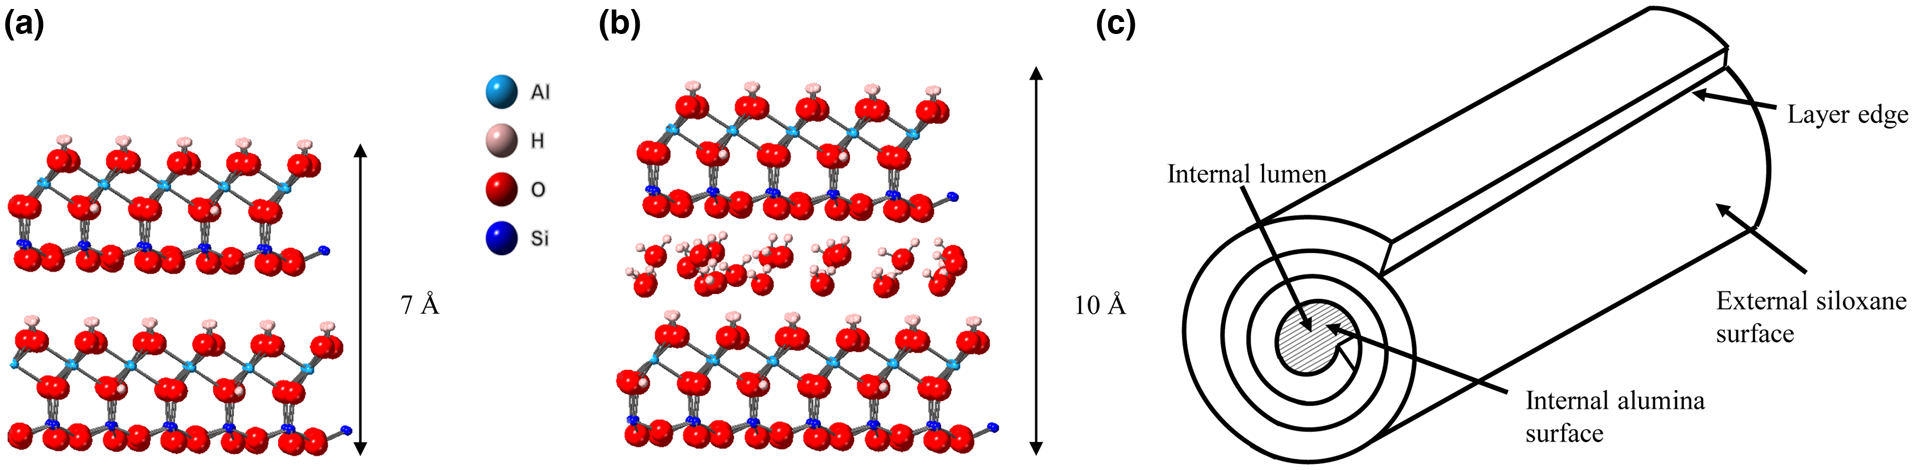
Fig. 1. (a) Halloysite 7 Å structure, (b) halloysite 10 Å structure and (c) schematic diagram of a HNT.
Whilst kaolinite has been studied regularly for its phosphate adsorption properties (Edzwald et al., Reference Edzwald, Toensing and Leung1976; He et al., Reference He, Zelazny, Martens, Baligar and Ritchey1997; Gimsing & Borggaard, Reference Gimsing and Borggaard2002; Kamiyango et al., Reference Kamiyango, Masamba, Sajidu and Fabiano2009; Gérard, Reference Gérard2016), there is surprisingly little published work on halloysite (7 Å). Very recent work that has investigated halloysite has found adsorption capacities of 1.5 mg g–1 for phosphate after 3 h equilibrium time (Almasri et al., Reference Almasri, Saleh, Atieh, McKay and Ahzi2019), whilst Saki et al. (Reference Saki, Alemayehu, Schomburg and Lennartz2019) reported that granular halloysite adsorbs more phosphate than powdered halloysite due to the availability of pore space, with a maximum adsorption of ~1.2 mg g–1 phosphate.
A study by Theng et al. (Reference Theng, Russell, Churchman and Parfitt1982) highlighted the importance of morphology on adsorption capacity for halloysite when they reported the maximum phosphate adsorption as 10 μmol g–1 for tubular halloysites and ≤50% of this for spheroidal morphologies, which were interpreted as being due to a paucity of edge sites on the spheroidal forms. Similarly, Singh & Gilkes (Reference Singh and Gilkes1992) found that soil kaolinite had greater phosphate adsorption capacity than Georgia kaolinite, which was ascribed to the greater surface area of the soil kaolinite and hence a greater number of edge sites. Although as a starting point, the surface properties of halloysite may be considered as similar to those of kaolinite, halloysite is initially formed with an interlayer containing H2O molecules, the structural ‘memory’ of which is likely probably retained long after removal. Hallyosite also possesses curved 1:1 layers and so is inherently more disordered and occurs primarily in nanotubular form compared to the exclusively planar form of kaolinite.
Previous studies have highlighted significant differences in the sorption behaviour of halloysite and kaolinite; for example, the greater cation-exchange capacity (CEC) of halloysite, which Gray et al. (Reference Gray, Lumsdon and Hillier2016) ascribed to a greater surface area and more available edge sites, whilst in an early study using electrodialysis Schell & Jordan (Reference Schell and Jordan1959) found that halloysite had a greater anion-exchange capacity than kaolinite. A study by Tarì et al. (Reference Tari, Bobos, Gomes and Ferreira1999) found a greater ζ-potential for halloysites compared to kaolinites, suggesting that the surface chemistry for the two polytypes is different. There has been a number of studies on the removal of phosphates from wastewater systems by materials such as natural and modified zeolites (Uzunova & Mikosch, Reference Uzunova and Mikosch2016; He et al., Reference He, Lin, Dong and Wang2017; Andrés et al., Reference Andrés, Araya, Vera, Pozo and Vidal2018), kaolinite (Kamiyango et al., Reference Kamiyango, Masamba, Sajidu and Fabiano2009), goethite (Ioannou et al., Reference Ioannou, Dimirkou and Ioannou2013; Wei et al., Reference Wei, Tan, Liu, Zhao and Weng2014), hematite (Borgaard, Reference Borggaard1983) and bentonite systems (Ioannou et al., Reference Ioannou, Dimirkou and Ioannou2013). The potential use of halloysite for such methods has only recently been considered (Almasri et al., Reference Almasri, Saleh, Atieh, McKay and Ahzi2019), and as such is identified as an area that requires further work. The current paper aims to document the characteristics of phosphate adsorption on halloysite (7 Å) nanotubes and to highlight the effects of the varying morphology and surface area of HNTs on the resulting phosphate-adsorption capacity. The study was partly conceived as a complementary study to the work of Gray et al. (Reference Gray, Lumsdon and Hillier2016), which detailed the CEC of some well-characterized halloysites. Finally, the results from this study will be compared with previous studies on a variety of minerals as an estimation of their potential use in wastewater remediation.
Materials
Two well-characterized halloysites (Hillier et al., Reference Hillier, Brydson, Delbos, Fraser, Gray and Pendlowski2016) were used for this study, one from China (4Ch) and the other from Utah, USA (17US), while the disordered kaolinite KGa-2, available from The Clay Minerals Society Source Clays Repository, was used as a well-studied (He & Balinger, Reference He, Zelazny, Martens, Baligar and Ritchey1997; Gimsing & Borggard, Reference Gimsing and Borggaard2002; Van Emmerik et al., Reference Van Emmerik, Sandström, Antzutkin, Angove and Johnson2007) reference kaolinite to validate the experimental methods. All three clay samples were sieved to <53 μm, Na-saturated with excess NaCl, washed with deionized water until they were salt free, as determined by silver nitrate, and freeze dried. The two halloysite samples were chosen for their differing morphologies, where sample 17US can be described as a predominantly polygonal prismatic (Fig. 2a) halloysite and 4Ch as a cylindrical form (Fig. 2b). Typically, polygonal prismatic nanotubes are longer and wider than cylindrical nanotubes (Hillier et al., Reference Hillier, Brydson, Delbos, Fraser, Gray and Pendlowski2016), as is shown in Table 1 for the samples used in the present study and as can be seen from the various scale bars in Fig. 2a,b. Additionally, polygonal prismatic forms of halloysite have flat external faces, whilst the external faces of the cylindrical forms are curved. The internal lumen surface of both forms is assumed to be curved and of similar diameter.

Fig. 2. (a) Polygonal and (b) cylindrical HNTs (Hillier et al., Reference Hillier, Brydson, Delbos, Fraser, Gray and Pendlowski2016) and (c) KGa-2.
Table 1. Physical properties of the two halloysites and the reference kaolinite.
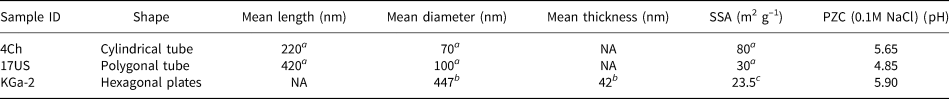
a Hillier et al. (Reference Hillier, Brydson, Delbos, Fraser, Gray and Pendlowski2016).
b Sutheimer et al. (Reference Sutheimer, Maurice and Zhou1999).
c Van Olphen & Fripiat (Reference van Olphen and Fripiat1979).
NA: not applicable; SSA: specific surface area; PZC: point of zero charge.
Experimental methods
Adsorption reactions were conducted to study the effects of pH, varying background electrolyte ionic strength and phosphate concentration on the anion adsorption behaviour of the kaolin group minerals, where the KGa-2 kaolinite sample was used as a reference material only.
Batch equilibrium experiments
Batch equilibrium systems were set up to measure phosphate adsorption onto the clay minerals. To ensure that the halloysites were dehydrated and in a homogenized state for comparison, 0.1 g of clay was oven-dried at 105°C overnight and mixed with 28 mL of varying concentrations of background electrolyte, NaCl, ranging from 0.001 to 0.1 M. The resulting suspensions were pH adjusted using 1 mL of differing concentrations of HCl (standardized against Na2CO3) or NaOH (standardized and carbonate free) and shaken for 24 h in a box shaker. A total of 1 mL of a known concentration of sodium dihydrogen (ortho)phosphate 1-hydrate was added to the samples, and they were shaken for 16 h overnight. The initial P-PO4 concentration ranged from 2.5 to 8.0 mg L–1. The pH for each sample was measured using a HACH HQ440d pH meter and recorded after 5 min with constant stirring. The samples were centrifuged before filtering through 0.45 μm Nylon® filters and stored in a cold room for analysis. Supernatant phosphate concentrations were determined using the molybdenum blue method on a Konelab Discrete Analyser. Dissolved aluminium and silicon in the filtrate were measured by inductively coupled plasma-optical emission spectroscopy (ICP-OES). Each experiment was run in triplicate along with a control blank.
Kinetic experiments
Halloysite clay (0.1 g) was mixed with 28 mL of 0.01 M NaCl, the pH was adjusted using dilute sodium hydroxide resulting in a pH of ~6 and the samples were shaken for 24 h. To this, 1 mL of ~8 mg L–1 phosphate was added, and the samples were shaken for a range of times between 1 h and 10 days. The pH was measured before centrifugation and filtration as described in the batch equilibration method. All experiments were conducted in triplicate with control blanks.
Determination of the point of zero charge
Point of zero charge (PZC) measurements were conducted on the clay materials using the salt addition method (Holliman et al., Reference Holliman, Vaca Velasco, Butler, Wijdekop and Worsley2008), wherein 10 aliquots of 0.1 M NaCl were added to 0.1 g clay and the initial pH adjusted to vary from 2 to 11 using HCl and NaOH. Samples were again prepared in triplicate and mixed thoroughly for 24 h in a box shaker, with the final pH measured after 24 h. The difference between the initial and final pH (ΔpH) was plotted against the initial pH. The PZC is described as the point at which the pH does not change from the initial pH. This method was chosen from the various options available because it operates by saturating the surface with Na+ and Cl– ions at various initial pH values and measuring the change in pH as the surface ions rearrange themselves. Thus, it relies upon a dynamic surface rearrangement of ions in aqueous solution, which is directly analogous to the phosphate-sorption processes subsequently measured.
Fourier-transform infrared spectroscopy
Hand-ground samples were oven dried at 105°C over 2 days and infrared spectra were measured on a Bruker Vertex 70 Fourier-transform infrared (FTIR) spectrometer in the mid-infrared region from 4000 to 400 cm–1 with 200 scans taken per spectrum. A germanium disc was used to reduce the penetration depth into the sample in order to see more clearly the changes on the HNT surface. The FTIR spectrometer was dry-air purged to prevent interference in the spectra from water vapour and carbon dioxide.
Results
Kinetic studies
The results of the kinetic experiments show that adsorption occurs very rapidly, within hours (Fig. 3; the data are fitted with a trend line for clarity). The batch adsorption experiments for this study were therefore conducted after overnight shaking. From Fig. 3, it is apparent that the cylindrical halloysite (4Ch) displays the greatest phosphate adsorption (~42 μmol g–1: 1.3 mg g–1) compared to the polygonal prismatic 17US halloysite, which showed less than half this level of adsorption (~15 μmol g–1: 0.5 mg g–1).

Fig. 3. Kinetics of P-PO4 adsorption for 17US and 4Ch halloysite.
Batch experiments
Figure 4 shows the effect of changing background electrolyte (NaCl) concentration on the anion adsorption where, for each set, the amount of phosphate added was kept constant at 4 mg L–1. From Fig. 4, it is apparent that the materials all display similar adsorption curves with changes in pH, with a maximum adsorption at pH ~6. For the two halloysite samples, the amount of phosphate adsorbed is also dependent on the initial concentration of phosphate, with increasing initial P-PO4 loading promoting increased phosphate adsorption (Fig. 5). In addition, Langmuir adsorption curves were fitted for both samples with varying P-PO4 concentration at a fixed pH of 6. The 17US fits to a linear Langmuir equation, resulting in a potential maximum adsorption of 0.69 mg g–1. The 4Ch sample did not fit to a Langmuir isotherm (see Figs S2 & S3).

Fig. 4. The effect of background electrolyte ionic strength on P-PO4 adsorption. Error bars represent the standard deviation of three repeated experiments.

Fig. 5. Effect of P-PO4 loading. Where shown, error bars represent the standard deviation of three repeated experiments.
Point of zero charge
The PZC is the pH at which the charge density on the surface of the clay is zero. The PZC graphs for 4Ch, 17US and KGa-2 are provided in Fig. 6. With 0.1 M NaCl, the PZCs determined for 4Ch, 17US and KGa-2 were 5.65, 4.85 and 5.90, respectively (Table 1).

Fig. 6. PZC values for the two halloysites and kaolinite in 0.1 M NaCl. Three replicated sets of measurements were made for each sample.
ICP-OES
The ICP-OES analysis of the remnant solutions across the pH range from 3 to 10 indicates that below pH 4 the amount of aluminium in the solution increases rapidly (Fig. 7), whilst the silicon in the solution fluctuates across the pH range.

Fig. 7. Dissolved Al and Si in 17US and 4Ch adsorption reactions over a pH range of 2–12.
Effect of morphology on anion adsorption
In order to determine whether the morphology of the kaolin group minerals affected phosphate adsorption, the measured concentrations of adsorbed phosphate were normalized according to the specific surface area (SSA) of each mineral (Fig. 8). Normalization of the adsorption curves to the SSA indicates similar adsorption across the minerals, although the polygonal prismatic halloysite 17US had a slightly greater adsorption of phosphate per m2, particularly between pH 5 and 7.

Fig. 8. Phosphate adsorption curves normalized to BET SSA.
FTIR analysis
The FTIR analysis was conducted to determine the mechanism and sites of adsorption on the HNTs through the comparison of halloysites with and without phosphate adsorption, as presented in Fig. 9. Due to the subtle nature of the changes in the FTIR spectra, the amount of phosphate added to the samples was increased to 215 mg L–1 to saturate the sample in order to obtain clearer results. The magnified inset in Fig. 9 shows the discrete O–H stretching bands of the prismatic halloysite with and without phosphate adsorbed, where the intensity of the inner Al–OH stretching band at ~3600 cm–1 showed a slight reduction in intensity after phosphate adsorption.

Fig. 9. FTIR spectra of 17US halloysite with and without phosphate adsorption.
Discussion
Adsorption is a partitioning process that results in an equilibrium being established between solvated and adsorbed species. This equilibrium can involve positively and negatively charged or potentially neutral species, both in solution and adsorbed to the halloysite surface. However, the nature of the adsorption will be influenced by surface charge because neutral species will most likely physisorb to a surface, which is a lower-energy interaction and can result in desorption. By comparison, charged species are more likely to chemisorb, which will produce a more stable product that is less likely to desorb. In practice, adsorption is dynamic, so adsorbates are likely to adsorb and desorb from a surface until the lowest energy state is reached. Thus, in the context here of charged phosphate ions, charged surface sites are believed to be the most important once equilibrium is reached. If either of these charged surface sites is effectively blocked with the oppositely charged ions, this could reduce uptake of the phosphate anions.
The phosphate adsorption curves with varying pH for both halloysites and the reference kaolinite all show the same shape, with a maximum at pH ~6 and a steady decrease in adsorption with increasing pH (Figs 4 & 5). The parabolic shape of the adsorption curves is similar to those seen by other authors studying phosphate adsorption onto kaolinites (e.g. Edzwald et al., Reference Edzwald, Toensing and Leung1976; Manning & Goldberg, Reference Manning and Goldberg1996). The reduction in adsorption with an increasingly basic solution is in line with the hypothesis that, at greater pH, the edge sites are deprotonated and so display a net negative charge, which could electrostatically repel phosphate anions. The slight decrease in phosphate adsorption below pH 4 may be ascribed to surface protonation, which would produce a net positive surface charge. At lower pH values, phosphate has a lower charge in solution, which would reduce the attraction between the positive surface charge and negatively charged phosphate ions, resulting in lower adsorption. From the batch adsorption curves (Figs 4 & 5) and under the experimental conditions outlined, the maximum adsorption for the 17US sample is 0.5 mg g–1, and this value is 1.3 mg g–1 for 4Ch. The amount adsorbed by the cylindrical sample is in line with the values reported recently by Almasri et al. (Reference Almasri, Saleh, Atieh, McKay and Ahzi2019) and Saki et al. (Reference Saki, Alemayehu, Schomburg and Lennartz2019). The variable phosphate loading data at pH 6 were fitted to Langmuir adsorption isotherms (Supplementary Figs S2 & S3), where it was observed that the 17US prismatic sample obtained a good fit to the Langmuir isotherm (R 2 = 0.9677), whilst the data for the cylindrical 4Ch did not fit to the Langmuir isotherm (R 2 = 0.3922). A key feature of the Langmuir isotherm is that it assumes that all sorption sites are identical. The good fit obtained for the prismatic sample may indicate that the sorption is dominated by edge sites alone, whilst the lack of fit for the cylindrical sample suggests the additional importance of another site, the obvious candidate for which is the aluminol surface of the inner lumen, which we would expect to be proportionally more abundant in the smaller nanotubes that characterize the 4Ch sample.
One of the main assumptions of this adsorption method is that the phosphate remaining in solution is free and available to react with the surface of the mineral. However, at low pH, dissolved aluminium may form soluble complexes with phosphate. The ICP-OES analysis of the remnant solutions across the pH range of the PZC experiments shows that at pH <4 the amount of aluminium in solution increases rapidly (Fig. 7). Van Emmerik et al. (Reference Van Emmerik, Sandström, Antzutkin, Angove and Johnson2007) studied phosphate adsorption on kaolinite and gibbsite by 31P nuclear magnetic resonance spectroscopy and found evidence of a partially crystalline AlPO4 phase at low pH values. Those authors inferred that the Al–OH edge sites where anion adsorption occurs play a role in the formation of a surface precipitate, which at low pH values would reduce the number of available sites for anion adsorption. It can be seen from the ICP-OES analysis in this current study that labile Al is present in solution at these lower pH values (Fig. 7). The presence of such phases could provide one explanation for the observed reduction in phosphate adsorption at lower pH values. In addition, Huang et al. (Reference Huang, Foster, Honeychuck and Schreifels2009) proposed a model for Al-oxides that suggested the decrease in phosphate sorption at pH < 4 was due to the absence of proton-reactive but phosphate-non-reactive triply coordinated surface hydroxyls in the alumina sheet, and they used these groups to distinguish between Al- and Fe-oxides and their adsorption curves.
The PZC data show notably similar trends across the three minerals investigated (Fig. 6). Both halloysites and kaolinite show a maximum adsorption at pH ~6 (Figs 4 & 5), which is just above the range of the PZC for these samples (Table 1), with adsorption decreasing at pH < 4 or pH > 8. One explanation for the change of trend in the PZC curve at higher and lower pH values is due to metal ion dissolution at extreme pH, as is expected for amphoteric aluminium oxides and confirmed by the ICP-OES analysis. While there are no reference PZC values for halloysite as far as the authors are aware, the value of 5.9 for kaolinite KGa-2 in 0.1 M NaCl is slightly higher than previously reported values for kaolinite: KGa-2 = 5.4 (Schroth & Sposito, Reference Schroth and Sposito1997), China kaolinite = 4.1 (Wei et al., Reference Wei, Tan, Liu, Zhao and Weng2014) and Linthipe kaolinite = 5.1 (Kamiyango et al., Reference Kamiyango, Masamba, Sajidu and Fabiano2009). While the PZC value obtained in this study is slightly higher, it is still considered within the range of literature values, where the variations between reported results may arise due to differences in background ionic strength, kaolinite crystallinity and experimental methods. In the case of the halloysites, the greater pH for the PZC of the cylindrical 4Ch suggests that it has more positively charged surface sites than the polygonal prismatic 17US sample, which may be explained by the greater surface area of cylindrical halloysites and perhaps a proportionally more important contribution of the lumen aluminol surface. In contrast to the halloysites, where the PZC is approximately the pH of the maximum observed phosphate adsorption, the PZC for goethite is pH ~9 (Van Emmerik et al., Reference Van Emmerik, Sandström, Antzutkin, Angove and Johnson2007), which is the point at which the adsorption of phosphate on goethite is at its lowest. Consequently, while PZC is an effective measurement for understanding some of the surface chemistry of the mineral, anion adsorption on minerals is not considered to be related to the PZC, but rather is surface-area dependent (Gérard, Reference Gérard2016). This was a key reason why the particular PZC method used in the present investigation was chosen, because it relies on initial chloride anion sorption and effectively measures the change in proton concentration (pH) following the dynamic rearrangement of surface ions over time. Therefore, it was considered the most relevant method for comparison with phosphate sorption.
Kinetic adsorption experiments conducted over a time period of 30 min to 10 days showed that, for both halloysites, the adsorption of phosphate was rapid and maximum adsorption was obtained between 24 h for 17US and 48 h for 4Ch (Fig. 3). The slower rate of uptake in 4Ch presumably reflects a combination of its greater phosphate uptake (42 μmol g–1) and cylindrical morphology compared to the polygonal prismatic 17US (15 μmol g–1 uptake). At first sight, the 4Ch sample might appear to exhibit slower phosphate diffusion. However, given that it absorbs >2.5 times more phosphate than 17US, the specific rate in terms of phosphate uptake per unit time is greater. Interestingly, a slight dip was noted consistently for both halloysites at ~20 h equilibration time, followed by a recovery that follows the kinetic adsorption curve. While this feature cannot be fully explained without further investigation, we suggest that it may be due some form of rearrangement of phosphate on the surface. As such, here we purposely chose to use ~16 h for the sorption experiments, in line with previous adsorption experiments on halloysite (Theng et al., Reference Theng, Russell, Churchman and Parfitt1982). In practice, this was a compromise with the aim of minimizing multilayer sorption in 4Ch whilst the 17US sample had reached 90% of total uptake. Typically, adsorption experiments have been considered to be at equilibrium within 24 h (Theng et al., Reference Theng, Russell, Churchman and Parfitt1982; Ioannou & Dimirkou, Reference Ioannou and Dimirkou1997), and continued reaction times could result in further sorption processes such as multilayer adsorption or, after periods of several days to a few weeks, surface precipitation (Gérard, Reference Gérard2016). This is in contrast with other non-clay materials such as industrial by-products, where Habibiandehkordi et al. (Reference Habibiandehkordi, Quinton and Surridge2014) showed that a minimum equilibration period of 5 days is required for maximum phosphate adsorption.
The difference in adsorption capacity at fixed initial phosphate concentrations between the cylindrical and prismatic halloysite is shown in the kinetic adsorption experiments (Fig. 3), where the cylindrical halloysite has an adsorption >2.5 times greater than that of the prismatic halloysite. Previous work has shown that anion adsorption occurs primarily on the pH-dependent edge sites of the HNTs (Theng et al., Reference Theng, Russell, Churchman and Parfitt1982) and the number of edge sites is related to surface area. Results reported in a study of the CEC of seven different halloysites (Gray et al., Reference Gray, Lumsdon and Hillier2016) showed that, in general, cylindrical halloysites had a slightly greater CEC than the polygonal prismatic halloysites, although this difference was reduced after normalization to surface area, and the majority of the cation adsorption occurs on the pH-dependent edge sites. Thus, we propose that the difference in adsorption between the two morphologies may be rationalized by considering that the cylindrical HNTs are much smaller with a greater SSA and, hence, more edge sites are available for adsorption reactions and, as discussed above, there is some evidence for a proportionally greater influence of aluminol sites in the lumen. Normalization of the adsorption curves to Brunauer–Emmett–Teller (BET) SSA is shown in Fig. 8. The normalized adsorption curves for kaolinite and cylindrical halloysite 4Ch are closely matched, whilst the prismatic 17US displays a small increase in adsorption levels between pH 5 and 7. The general convergence of the data points after normalization to the SSA effectively demonstrates the importance of this feature on the phosphate adsorption capacity. The slightly elevated levels of phosphate adsorption per m2 for 17US compared to 4Ch and KGa-2 could be rationalized by considering that there may be a greater number of steps and edges, and hence reaction sites, on the larger prismatic tubes of 17US halloysite. Further work, such as atomic force microscopy studies, are in progress to investigate this possibility.
Hayes & Leckie (Reference Hayes and Leckie1987) advised that studying the effects of electrolyte ionic strength on adsorption reactions can result in identifying the adsorption mechanism as either inner-sphere (chemisorbed) or outer-sphere (physisorbed), where outer-sphere reactions are shown to be affected by competition with a high ionic strength background electrolyte. He et al. (Reference He, Zelazny, Martens, Baligar and Ritchey1997) studied phosphate adsorption onto kaolinite (KGa-2) with varying ionic strengths and noted that the ionic strength had little effect on phosphate adsorption; rather, it was pH that had the most significant effect. From Fig. 4, there appear to be few to no competing effects from the sodium chloride with regards to the phosphate adsorption, except in the case of the cylindrical 4Ch, where the greatest molarity (0.1 M NaCl) displays a tendency towards generally lower phosphate adsorption for the samples. From this it can be suggested that predominantly inner-sphere chemisorption may be taking place on the positively charged surface sites, although the presence of some outer-sphere physisorption reactions occurring between the mineral and phosphate in solution should not be ruled out.
From the adsorption curves, which show a maximum adsorption at pH ~6, and the speciation curve of phosphoric acid (see Supplementary Fig. S1), it is evident that the most likely species of phosphate involved in the adsorption reactions are H2PO4– and HPO42–, which are the common forms of labile phosphate in soil systems (Haygarth et al., Reference Haygarth, Bardgett and Condron2013). At pH values at or below the PZC value, we expect the halloysite surface to be protonated and positively charged, resulting in monodenate and some bidentate phosphate uptake. At pH values greater than the PZC value for each halloysite, the surface is likely to be negatively charged, leading to a gradual decrease in phosphate adsorption as the increasingly negatively charged anions are repelled. FTIR analysis was used as a method to try to establish the surface adsorption mechanism. FTIR analysis can be used to differentiate between the two morphologies of halloysite according to their degree of ordering (Hillier et al., Reference Hillier, Brydson, Delbos, Fraser, Gray and Pendlowski2016). As with kaolinite, the more ordered polygonal prismatic morphologies often have a band at ~3659 cm–1, which, in the case of halloysite, is assigned to out-of-phase Al–OH stretching due to imperfect threefold symmetry (Farmer, Reference Farmer and Farmer1974).
The FTIR spectra presented in Fig. 9 of both the original 17US sample and 17US with adsorbed phosphate show few visible differences. While the FTIR results are subtle for the polygonal prismatic 17US halloysite, with increased phosphate adsorption the intensity of the inner (Al)O–H stretching band at ~3660 cm–1 was seen to reduce slightly. This agrees with previous studies which suggested that the aluminol edge groups are the sites with anion-exchange potential (Theng et al., Reference Theng, Russell, Churchman and Parfitt1982; Han et al., Reference Han, Liu, Zhou and Chen2016). As no change was seen in the FTIR spectra for 4Ch in the Al–OH region before and after phosphate adsorption, the spectra are not presented here. In addition, overlap between the P–O stretching bands in the region of 1200–900 cm–1 with the Si–O stretching bands in the same region made it difficult to identify the presence of phosphate in this region. Therefore, whilst the FTIR analysis of the prismatic 17US halloysite suggests that the adsorption occurs on the Al–OH edge groups, due to their subtle nature, these slight changes in the FTIR spectra (Fig. 9) before and after phosphate adsorption cannot be regarded as fully conclusive.
Use of natural materials as phosphate adsorbents
Phosphate pollution is of great environmental significance and the use of natural materials as scavengers is widely researched. Multiple studies have been conducted on the removal of phosphates from wastewater systems using materials such as natural and modified zeolites (Uzunova & Mikosch, Reference Uzunova and Mikosch2016; He et al., Reference He, Lin, Dong and Wang2017; Andrés et al., Reference Andrés, Araya, Vera, Pozo and Vidal2018), ochre (Heal et al., Reference Heal, Younger, Smith, Glendinning, Quinn and Dobbie2003), kaolinite (Kamiyango et al., Reference Kamiyango, Masamba, Sajidu and Fabiano2009), goethite (Ioannou et al., Reference Ioannou, Dimirkou and Ioannou2013; Wei et al. Reference Wei, Tan, Liu, Zhao and Weng2014) and bentonite systems (Ioannou et al., Reference Ioannou, Dimirkou and Ioannou2013). The phosphorus/phosphate adsorption capacities of these materials are presented in Table 2. In addition, we conducted phosphate adsorption reactions on hydrated halloysites (Supplementary Figs S4 & S5), and summary data allow us to conclude that the state of hydration (i.e. 10 vs 7 Å) does not affect the phosphate-adsorption capacity of halloysites, as is shown in Table 2.
Table 2. Phosphate/phosphorus adsorbents.
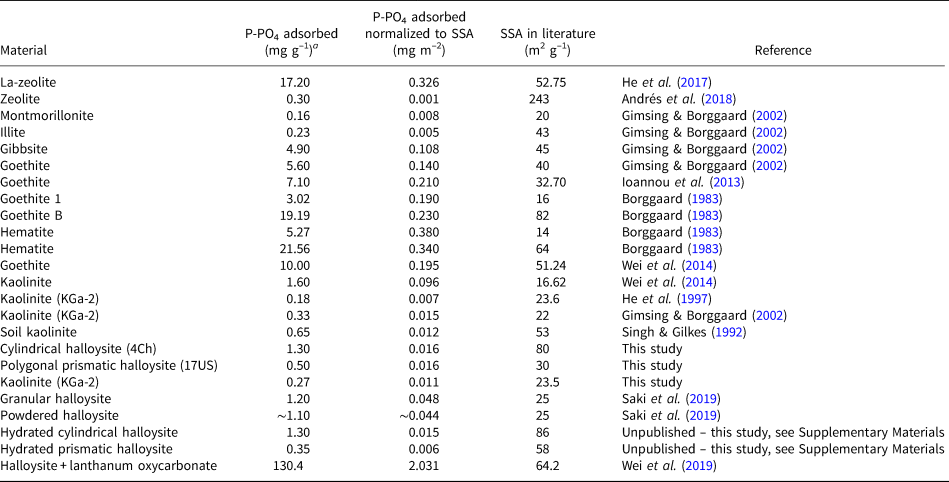
a Unit conversions assuming ideal chemical formula.
While a direct comparison between the studies is not possible due to their different experimental methods and different phosphate loadings, we have normalized the results of each material to their SSA in an attempt to compare the datasets. From this, we can see that the halloysite data generated in this study compared with the data given in Table 2 indicate that HNTs have the potential to adsorb more phosphate than certain montmorillonites, illite and unmodified zeolite. The halloysites are observed to adsorb significantly less phosphate than the Fe-oxide minerals. Despite this, the study conducted here and further studies using modified and unmodified HNTs, as is shown in Table 2, provide evidence that these minerals may contribute to P removal in soil systems and have the potential for use in industrial P removal when modified.
Conclusion
This study has investigated the phosphate adsorption capacities of two tubular halloysites and shown that surface area greatly influences the adsorption capacity. Because surface area is correlated with halloysite morphology (cylindrical vs polygonal), cylindrical varieties will generally show greater adsorption than polygonal prismatic halloysites, presumably due to a greater number of edge sites for reaction. However, there is some tentative evidence for an additional, more direct effect of morphology in that the polygonal forms may have more edge sites per unit surface. Additionally, a further difference between the two morphologies in terms of adsorption behaviour was observed in the fitting of the data to Langmuir isotherms, where the prismatic sample obtained a good fit whilst the cylindrical sample did not. This raises the possibility that the two do not adsorb phosphate at the same adsorption sites and that the lumen may have a great influence on adsorption in the cylindrical forms.
The adsorption of phosphate onto kaolin-group clay minerals shows a significant dependency on pH. The maximum adsorption for both halloysites and kaolinite occurs at pH ~6, which is slightly greater than their PZC values and similar to the pH that would exist in many aquatic and soil systems. This suggests that the halloysites may be able to act as effective phosphate traps or sinks in natural systems. Comparison of the normalized adsorption capacities of halloysites with other clay minerals such as montmorillonite, illite and kaolinite suggests that halloysites have a greater adsorption capacity with respect to phosphate. This contrasts with the adsorption of phosphate by Fe-oxides, which can be seen to be greater than that of clay minerals by a factor of at least 10.
The relationships between adsorption, morphology and surface area imply that pH-dependent sites must exist on the external surfaces of the HNTs and that the model of the halloysite tubular structure, as is often assumed in technological applications with a uniform external siloxane surface, is too simplistic. Future work will be aimed at more direct ways of examining the surface of HNTs and documenting the true structure of the external surface, which is fundamental to understanding the attempts at and results of HNT functionalization in emerging technological applications and the role of halloysite in adsorption processes in soils.
Supplementary material
To view supplementary material for this article, please visit https://doi.org/10.1180/clm.2020.24.
Acknowledgements
Tony Fraser is acknowledged for his guidance on the FTIR spectra.
Financial support
The Macaulay Development Trust and Swansea University College of Engineering are acknowledged for their PhD funding of NG-W. SH and NG-W acknowledge the support of the Scottish Government's Rural and Environment Science and Analytical Services (RESAS).


 Open access