


Following the hot summer of 2003 in Europe, Alaska, USA, experienced its own heatwave in the summer of 2004. Hot and dry conditions were caused by an unusually persistent high-pressure ridge over most of the state. Fairbanks experienced the warmest summer on record, with temperatures 2.8°C above normal, and many other communities experienced record highs (http://climate.gi.alaska.edu/News/summer04.html). The hot and dry conditions created the worst fire season on record, with over 27 000 km2 of burned area (http://fire.ak.blm.gov/default.htm).
The United States Geological Survey (USGS) has measured summer, winter and net mass balances of Gulkana Glacier, Alaska, since 1966 (http://ak.water.usgs.gov/glaciology). In eight of these years the mass balance was positive;the last of these was 1985 (Fig. 1). The year 2004 set a record negative net balance, –2.29 m, or about 3 standard deviations below normal. Winter balance for 2004 was about 1 standard deviation below normal and so contributed to the negative year, but the hot summer was the main contributor. The balance gradient was also a record high, about 1.3 m(100 m–1. Temperatures are measured at a site on the eastern lateral moraine of the glacier at 1480m a.s.l. Summer temperatures (16 May to 30 August) for 2004 set a record high and were about 3°C above normal. A stream gauge in the outlet river showed annual run-off almost twice normal and again a new record, about 3.5 standard deviations above normal. About 40% of the annual run-off was due to shrinkage of the glacier.
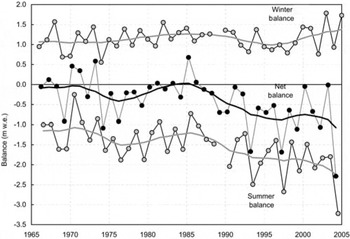
Fig. 1 Gulkana Glacier mass balance. The 2004 winter balance was relatively lower than the mean, but not by much. However, the summer and net balances were the most negative in the record.
On nearby Black Rapids Glacier specific mass balances have been measured since 1973 (Reference Heinrichs, Mayo, Echelmeyer and HarrisonHeinrichs and others, 1996). During the first two decades both winter and summer balances were measured, but more recently the glacier was visited only once a year, yielding net specific mass balances. Two sites have complete records, one in the accumulation area (8 km site) and one in the upper ablation area (14 km site). Glacier-wide mass balances have never been calculated, because the extrapolation of the specific balances to the complicated geometry is difficult. The glacier-wide balance has been further complicated by a massive rockfall that covered more than 10 km2 of the glacier’s ablation area in November 2002 (Reference Truffer, Craw, Trabant and MarchTruffer and others, 2002). Nevertheless, the two datasets of specific mass balances show the most negative balances since measurements began (Fig. 2). The 8 km site had a negative balance of 1.20 m w.e., only the third negative measurement in 32 years. An inspection of a moderate-resolution imaging spectroradiometer (MODIS) satellite image of 22 August (http://www.gina.alaska.edu) for the Alaska Range confirms the picture of widespread melt. Only the very highest areas of most glaciers retained a snow cover.
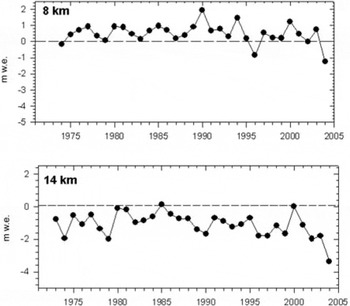
Fig. 2 Specific net balances in the lower accumulation and upper ablation area of Black Rapids Glacier. Both sites witnessed the most negative balance in the 32 year record. Dashed lines show zero specific balance.
Mean annual velocities have also been measured at these index sites and have been observed to vary by more than 50% (Fig. 3). It is interesting to note that the velocities between May 2004 and May 2005 were among the lowest in the 32 year record, despite record run-off at the nearby Gulkana Glacier, and record ice loss at Black Rapids Glacier (where run-off is not measured). Reference Heinrichs, Mayo, Echelmeyer and HarrisonHeinrichs and others (1996) showed that the variation in glacier motion cannot be explained by the effect of thickness changes on ice deformation. The thickness change during the last three years of decreasing velocities was only –2.0 m at 14 km and –1.2 m at 8 km. The total ice thickness at both locations is ~600 m. The average surface slope between 8 km and 20 km has remained constant during that time. Consequently, the velocity variation has to be caused by variations in basal motion. Black Rapids Glacier has surged in the past, but our velocity data do not point to an imminent surge. Instead they are dominated by a roughly decadal variation (Fig. 3). On the basis of a field study, Reference Raymond, Benedict, Harrison, Echelmeyer and SturmRaymond and others (1995) pointed out that there is no difference in subglacial hydraulics between Black Rapids Glacier and the nearby non-surge Fels Glacier that could not be explained by the difference in glacier size. It can thus be assumed that the velocity variations shown here are not primarily a result of surge dynamics. The low 2004 velocities can tentatively be explained by the establishment of effective water drainage networks in times of high runoff, which tends to concentrate subglacial discharge into a few big channels (e.g. Reference Fountain and WalderFountain and Walder, 1998). This can lead to reduced basal motion, an observation often made late in summer, when water discharge is high and speed relatively low.
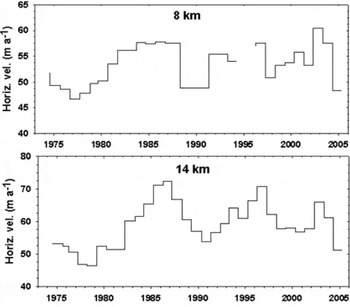
Fig. 3 Mean annual velocities of two sites on Black Rapids Glacier. Note the relatively low velocities in 2004/05.
Observations such as these caution against the use of simple run-off/basal motion relationships, as suggested by Reference Zwally, Abdalati, Herring, Larson, Saba and SteffenZwally and others (2002) and recently used in ice sheet modeling (e.g. Reference Parizek and AlleyParizek and Alley, 2004). Those measurements were made on a temperate-based ice sheet near an outlet glacier. While the glaciological setting is different, there should be no fundamental reason why basal motion would react differently to water input than it does in a valley glacier setting. To clarify, we do not doubt the accuracy of the measurements made by Zwally and others. Most temperate glaciers are known to undergo a transient speed-up when water input increases in spring and encounters an underdeveloped drainage system. We do caution, however, against extrapolating an overly simple run-off/motion relationship.
Acknowledgements
We acknowledge the work of those who were instrumental in establishing and maintaining the monitoring networks, in particular L. Mayo, D. Trabant and K. Echelmeyer. Much of the Black Rapids work has been done in conjunction with US National Science Foundation-funded work, most recently NSF OPP-0115819.


