


1. Introduction
The Arctic Oscillation (AO) is the dominant mode of atmospheric variability in the Northern Hemisphere (Reference KerrKerr, 1999). This has become increasingly evident since 1990 (Reference Baldwin, Cheng and DunkertonBaldwin and others, 1994; Reference Kitoh, Koide, Kodera, Yukimoto and NodaKitoh and others, 1996; Reference Kodera, Chiba, Koide, Kitoh and NikaidouKodera and others, 1996). Since 1989, a decrease in sea-level pressure (SLP) has been observed in the central Arctic (Reference Walsh, Chapman and ShyWalsh and others, 1996). Based on Reference Kitoh, Koide, Kodera, Yukimoto and NodaKitoh and others (1996) andReference Thompson and WallaceThompson and Wallace (1998; TW98 hereafter), the AO, which is associated with the polar vortex aloft, might include the North Atlantic Oscillation (NAO) (Reference Van Loon and RogersVan Loon and Rogers, 1978; Reference Hurrell and van LoonHurrel and Van Loon, 1997) as a subset, depending on the domain being considered.
The Arctic climate system is hypothesized to be a feedback loop of the atmosphere-ice-ocean decadal oscillation (Reference Mysak, Manak and MarsdenMysak and others, 1990; Reference Mysak and VenegasMysak and Venegas, 1998 (MV98 hereafter)), based on the singular value decomposition (SVD) complex empirical orthogonal function (EOF) analysis of SLP and sea-ice concentration (SIC) data from 1953−92. Arctic sea-ice variability is investigated in the context of recent atmospheric circulation trends (Reference Slonosky, Mysak and DeromeSlonosky and others, 1997; Reference Deser, Walsh and TimlinDeser and others, 2000). The winter sea-ice variability has a dipolar structure between the Baffin Bay-Davis Strait-Labrador Sea region and the Greenland-Norwegian seas (Reference Wang, Mysak and IngramWang and others, 1994; Reference Mysak, Ingram, Wang and van der BaarenMysak and others, 1996), while the summer sea-ice anomaly has a relatively uniform structure in space (Reference Deser, Walsh and TimlinDeser and others, 2000), indicating an in-phase variability (Reference Wang and IkedaWang and Ikeda, 2000; WI00 hereafter).
The Arctic sea-ice oscillation (ASIO) is defined as an in-phase fluctuation of the Arctic sea-ice area (SIA) anomalies (WI00) in response to the AO, i.e. the AO-related surface air temperature (SAT) and SLP anomalies. The in-phase (or spatially uniform) decline of Arctic sea-ice cover in the last three decades is the major feature of the ASIO. The ASIO can be discretely described as hypersensitive decadal oscillations in the Arctic/subarctic climate (atmosphereice-ocean) system, triggered by the enhanced atmosphere-ocean interaction (or positive feedback) due to reduced ice thickness in the Arctic (Reference Ikeda, Wang and ZhaoIkeda and others, 2001). The remarkable decadal oscillations of the Arctic sea-ice cover in the last 30 years are attributable to a persistent reduction of sea-ice thickness (and/or sea-ice cover) in the Arctic (Reference Ikeda, Wang and ZhaoIkeda and others, 2001). Therefore, the Arctic sea-ice cover anomaly should not be regarded as a passive player in the Arctic climate system (Reference Wu, Huang and GaoWu and others, 1999).
This study aims to identify the regional signatures of the ASIO by providing a regional perspective on the SIA anomalies, and will also investigate the following questions:
-
(1) What are the regional character and seasonality of sea-ice extent in different regions?
-
(2) Which seasons better reflect interannual variability and decadal oscillations in different regions?
-
(3) What are the decline rates in sea-ice cover in the last three decades in different seasons and different regions which may trigger the ASIO?
-
(4) What are the major cycles of SIA anomalies?
The data analyzed are briefly described in section 2. Four types of seasonality, their variability (standard deviation) and the interannual variability of the Arctic sea-ice cover are investigated in section 3. We present the results of spatial and temporal patterns of the leading EOF modes of SIA anomalies and SAT using data from 1953−95 in section 4. Section 5 presents some statistics of 95 year data and trends of the last three decades in both seasonal and annual views. Section 6 summarizes our findings and refers to possible future research.
2. The Data
The monthly SIC data that were analyzed, as described by Reference Walsh and JohnsonWalsh and Johnson (1979), are similar to those used in Reference Wang, Mysak and IngramWang and others (1994,Reference Wang, van der Baaren and Mysak1995). The data sources and processing techniques are further summarized by Reference Chapman and WalshChapman and Walsh (1993). This study uses sea-ice data updated by the U.S. National Snow and Ice Data Center (NSIDC, 1998) using NASA-derived Scanning Multichannel Microwave Radiometer (SMMR)/Special Sensor Microwave/Imager (SSM/ I) sources from October 1978 (Reference Cavalieri, Gloersen, Parkinson, Comiso and ZwallyCavalieri and others, 1997; Reference Parkinson, Cavalieri, Gloersen, Zwally and ComisoParkinson and others, 1999). This dataset has been updated to March 1995 and covers the Arctic Ocean and the adjacent seas with a 1° by 1° latitude-latitude grid. The monthly SLP data were obtained directly from the U.S. National Center for Atmospheric Research (NCAR) for the period 1899−1997, archived on 5° by 5° global grids. The SAT data were from the period 1850−1997 Reference JonesJones, 1994). The SIC data from the periods 1953−95 and 1901−95 were used in this study. The EOF analysis results show that both periods produce similar spatial and temporal patterns, although data before 1953 may contain some uncertainty. Thus, the EOF analysis results for the period 1953−95 are presented in this study in comparison to the EOF analysis using data for the period 1901−95 (WI00).
The Arctic SIC grids (Reference Walsh and JohnsonWalsh and Johnson, 1979; Reference Mysak and ManakMysak and Manak, 1989) are divided into eight regions (see Fig. 1; Table 1) following Reference Wang, van der Baaren and MysakWang and others (1995). The reason for using SIA time series as well as SIC time series is that many statistical methods require that a variable be random and independent, and SIA is a random variable, while the SIC (1−10) is not.

Fig. 1. The arctic and subpolar region divided into the eight regions used in this study.
Table 1. Names of eight regions shown in figure 1
3. Results: Regional Characteristics, Seasonality, Interannual and Interdecadal Variability
Monthly time series of SIAs in the eight regions are shown in Figure 2, with the interannual variability (using a 25 month moving average) superimposed in each region for the period 1901−95. The seasonal (or annual) cycle is a major phenomenon, but its effect differs according to region. For example, the boundary constraint (Reference Wang, Mysak and IngramWang and others, 1994) during winter is found in regions 2, 3 and 7, while summer ice-free conditions are found in regions 1 and 8.

Fig. 2. Monthly time series of SIAs of the eight regions for the period 1901−95. the solid lines are the 25 month running means.
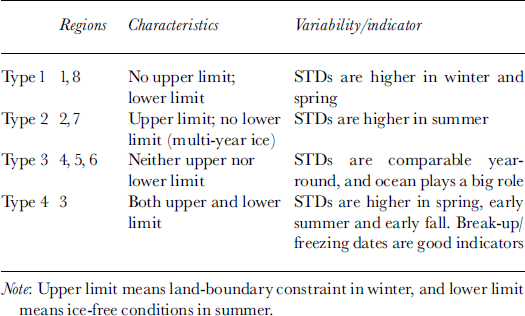
The climatology of the seasonal cycle (Fig. 3) is computed based on the 1901−95 data (Fig. 2) for the eight regions. We observe four types of seasonality and interannual variability (Fig. 2, thick curves) in the SIA in the eight regions (Table 2). Type 1 (Bering Sea, Sea of Okhotsk) is characterized by no upper limit (of ice extent), but by a lower limit (i.e. ice-free conditions). By contrast, type 2 (Beaufort and Chukchi Seas, East Siberian and Laptev Seas) has an upper limit (due to boundary constraint) and no lower limit (because of summer ice or multi-year ice). Type 3 (Baffin Bay, Davis Strait and Labrador Sea, Greenland and Norwegian Seas, Barents and Kara Seas) has neither upper nor lower limit (no boundary constraint with multi-year ice) because of the open ocean. Type 4 (Hudson Bay) has both upper limit (boundary constraint) and lower limit (ice-free conditions) (Reference Wang, Mysak and IngramWang and others, 1994).
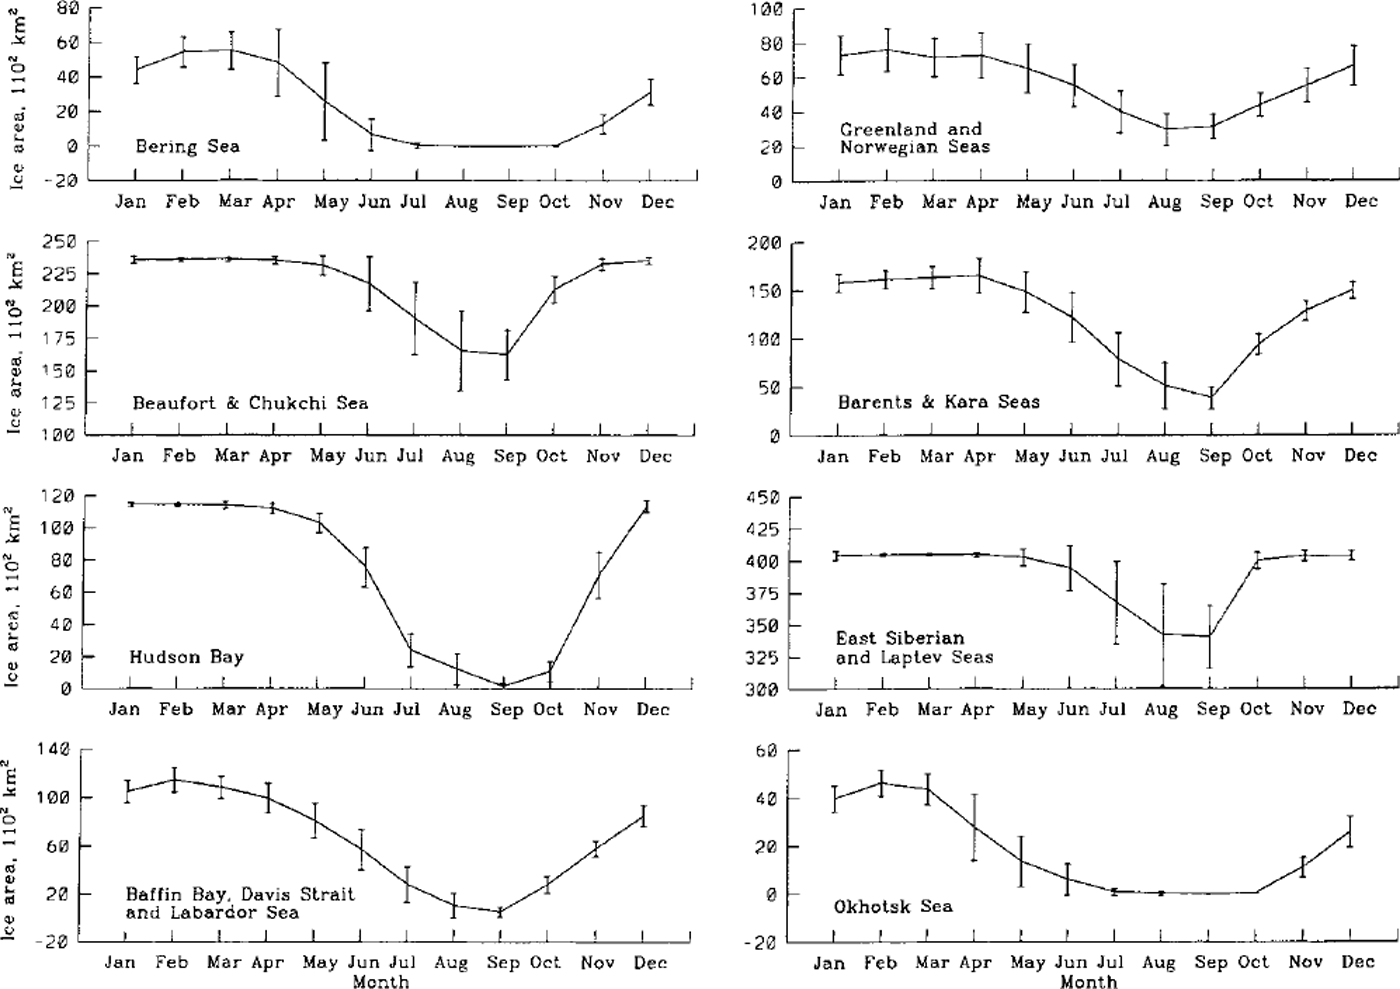
Fig. 3. The sia monthly climatology with standard deviations (STDS) in the eight regions for the period 1901−95.
Table 2. Four types of seasonality and their characteristics and implication/indicator (by stds) of long-term climate variability
The corresponding monthly variations (standard deviations (STDs)) are also shown in Figure 3. The months with the largest STDs are those sensitive to atmospheric forcing and whose records are best for detecting interannual and decadal variability. For example, the largest STDs (Table 7, column titled 95 year STDs) occur in spring in regions 1 (16.14), 4 (13.23), 5 (12.22), 6 (19.49) and 8 (9.21), and in summer in regions 2 (23.88) and 7 (29.89). In region 4 (Hudson Bay), the STDs in spring, summer and autumn are comparable. In regions 4−6, the STDs for all four seasons are comparable (see Table 7, column titled 95 year STDs).
To clearly observe the interannual variability, the time series of SIA anomalies are calculated by removing the monthly climatology (Fig. 3) for each region (Fig. 4). SIA anomalies in all eight regions show a significant negative trend since the 1970s. This indicates that the sea-ice extent in most Arctic regions has been decreasing since then, although with a slightly different timing and magnitude for each region. The negative trend is associated with the intensifying positive phase of the AO (Reference Thompson, Wallace and HegerlThompson and others, 2000). Decadal oscillation is most pronounced in regions 3−5 of the Atlantic sector (Reference HäkkinenHäkkinen, 2000), and a century time-scale is most evident in region 8 (Sea of Okhotsk).
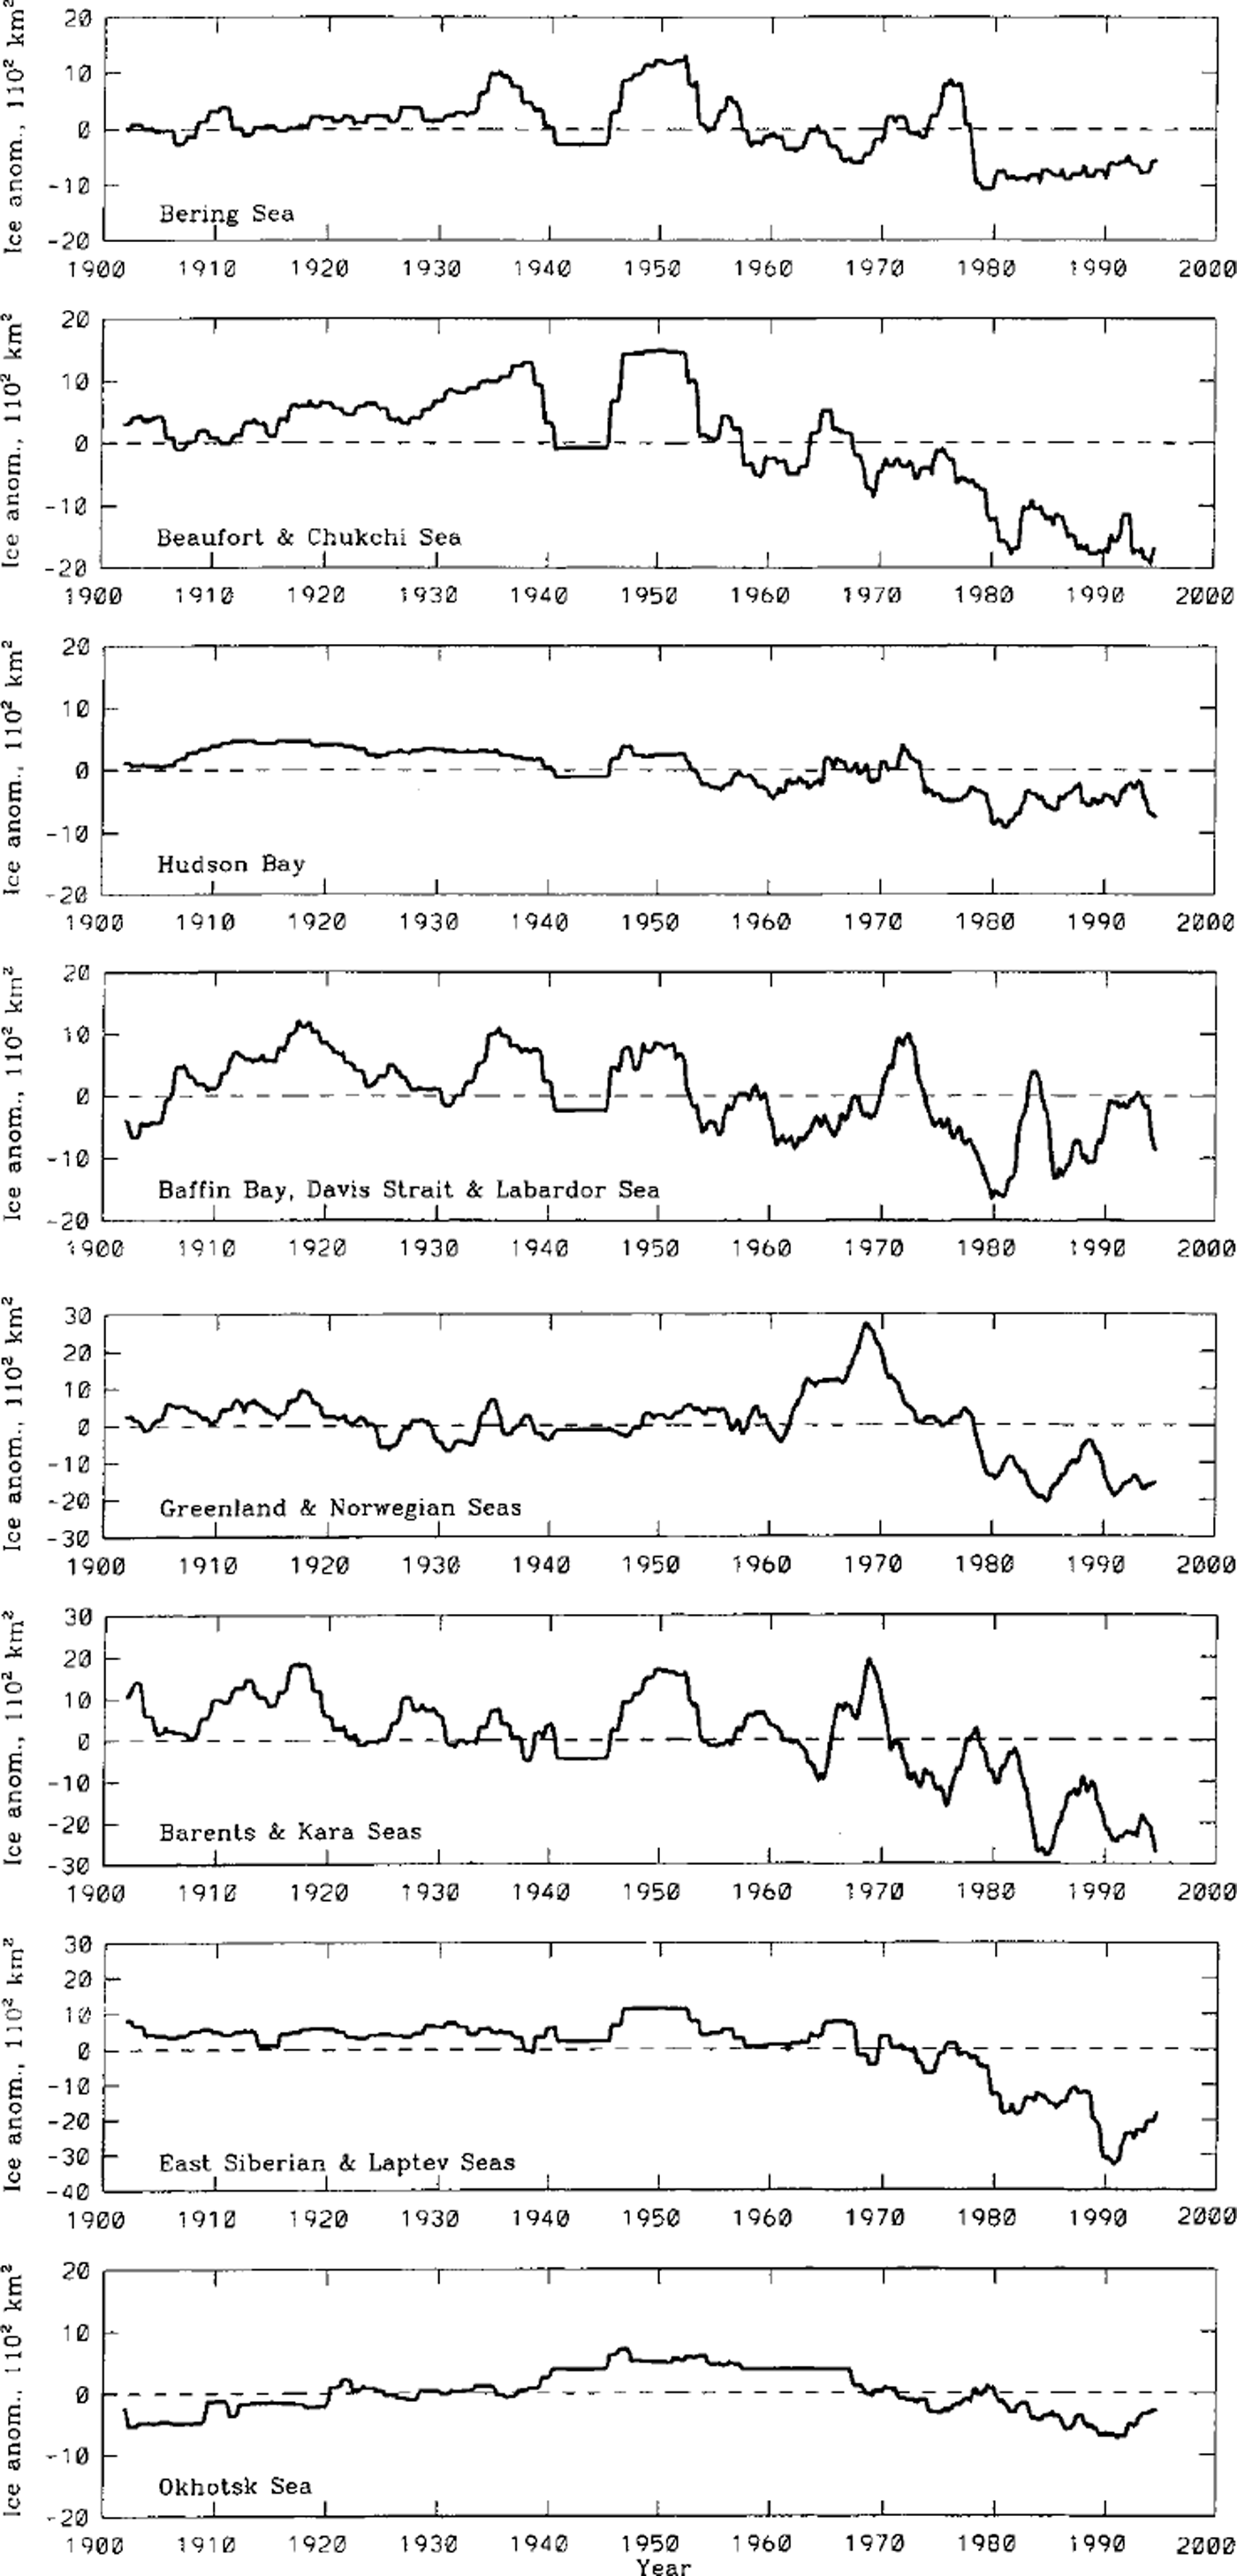
Fig. 4. Monthly sia anomalies with the seasonal cycle (fig 3) removed. the 25 month running mean is applied.
Considering the Arctic as a whole, the seasonal cycle and SIA and its anomaly (Fig. 5) show a similar trend of decreasing SIA since the 1970s. SIA reaches its maximum value of 1195 × 1102 km2 in winter and its minimum value of 642 × 1102 km2 in summer (with an annual mean of 964 × 1102 km2). The largest variation occurs in summer (Fig. 5a; bottom row of Table 7), indicating that summer ice cover (or anomaly) can capture major interannual and decadal variability. These updated results indicate significant climate variability occurring in the Arctic region in the context of atmospheric circulation anomalies (Reference RogersRogers, 1990; Reference Chapman and WalshChapman and Walsh, 1993; Reference Slonosky, Mysak and DeromeSlonosky and others, 1997; MV98; TW98; Reference Deser, Walsh and TimlinDeser and others, 2000; Reference Thompson, Wallace and HegerlThompson and others, 2000; WI00).

Fig. 5. The total arctic sea ice: (a) seasonal cycle with standard deviations; (b) monthly time series of SIA with the 25 month running mean; ( c) the si a anomaly (25 month running mean) for the period 1901−95.
4. Spatial and Temporal Patterns of ASIO
The same unrotated EOF analysis package of Reference Wang, van der Baaren and MysakWang and others (1995) was applied to the demeaned, normalized SLP, SATand SIA for the period 1901−97 (sea ice only up to August 1995; see WI00) and for the period 1953−97. The principal modes of SIA and SAT anomalies are only discussed based on data from 1953−97.
The leading sea-ice mode (Fig. 6) accounts for 34% of the total variance. Sea-ice anomalies in the eight regions fluctuate in phase in response to the AO, which has the same pattern as the SIA mode 1 derived from the data from 1901 95 (WI00). This ASIO pattern is consistent with the first SAT mode (Fig. 7), which shows a slight warming in most Arctic regions, particularly in northern Europe. From 1953 to 1977, the Arctic sea ice had positive anomalies, while it experienced a decreasing phase during 1978−95. The time series obviously indicates a decrease in SIA since the 1970s, which is consistent with the total Arctic ice anomaly (Fig. 5c). It is noted that superimposed on the long-term trend since the 1970s are the decadal oscillations. The total Arctic ice-anomaly time series and the mode 1 temporal pattern are closely correlated (see the quantitative discussion below). Thus, this ASIO pattern that can be derived from the data of 1953−95 is similar to the results using data from 1901−95 (WI00).
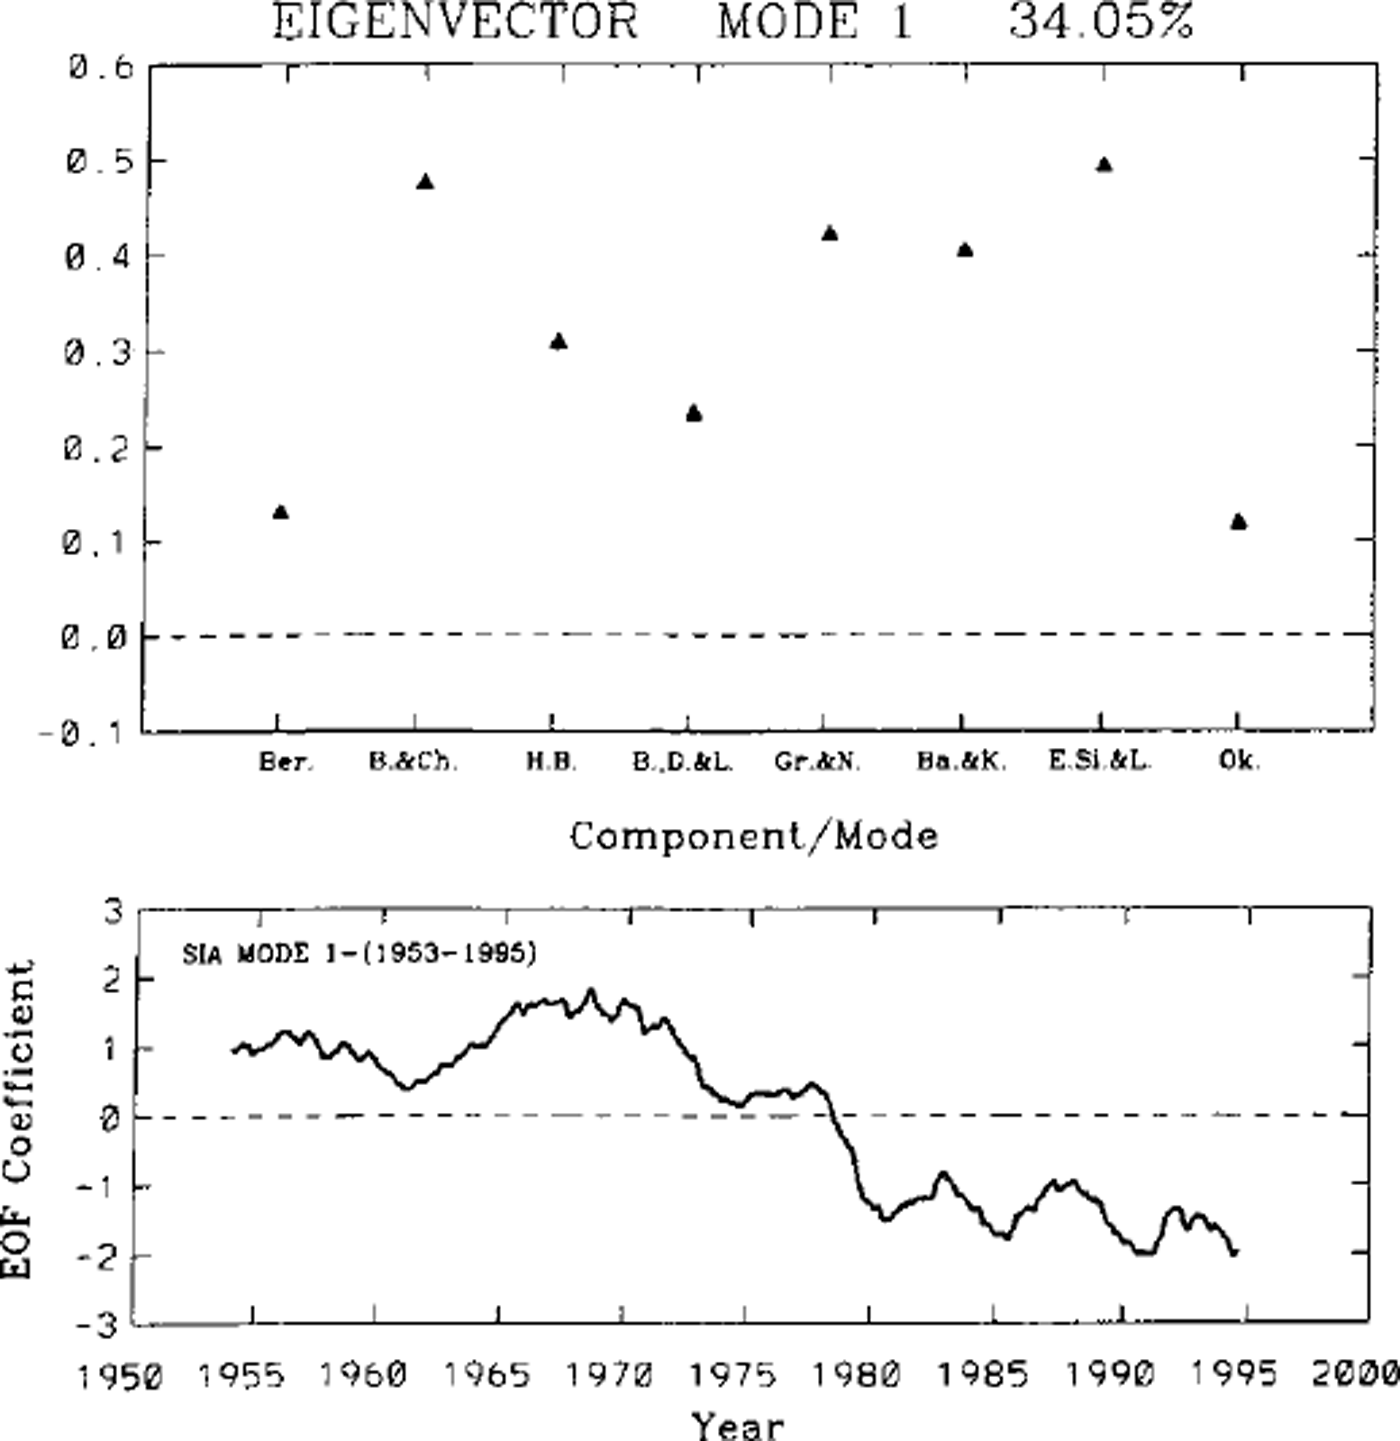
Fig. 6. The first leading eof mode of the eigenvectors (spatial pattern, upper panel) and the time series of the eigenvalues or the coefficients (temporal pattern, lower panel) of SIA anomalies for the period 1953−95. the original (actual) spatial and temporal patterns of the anomalies of the mode can be reconstructed by multiplying the eigenvalues with the eigenvectors.

Fig. 7. Same as figure 6, except for the sat anomalies.
The SIA anomaly mode 2 (Fig. 8) captures a dipolar or see- saw pattern shown by the opposite sign (out of phase) between regions 3 and 4 (Hudson Bay and Baffin Bay-Labrador Sea) and regions 5 and 6 (Greenland and Norwegian Seas, and Barents and Kara Seas). This see-saw pattern is a reflection of the AO/NAO-related SATanomaly pattern (Reference Wang, Mysak and IngramWang and others, 1994; Reference Mysak, Ingram, Wang and van der BaarenMysak and others, 1996; Reference Deser, Walsh and TimlinDeser and others, 2000).
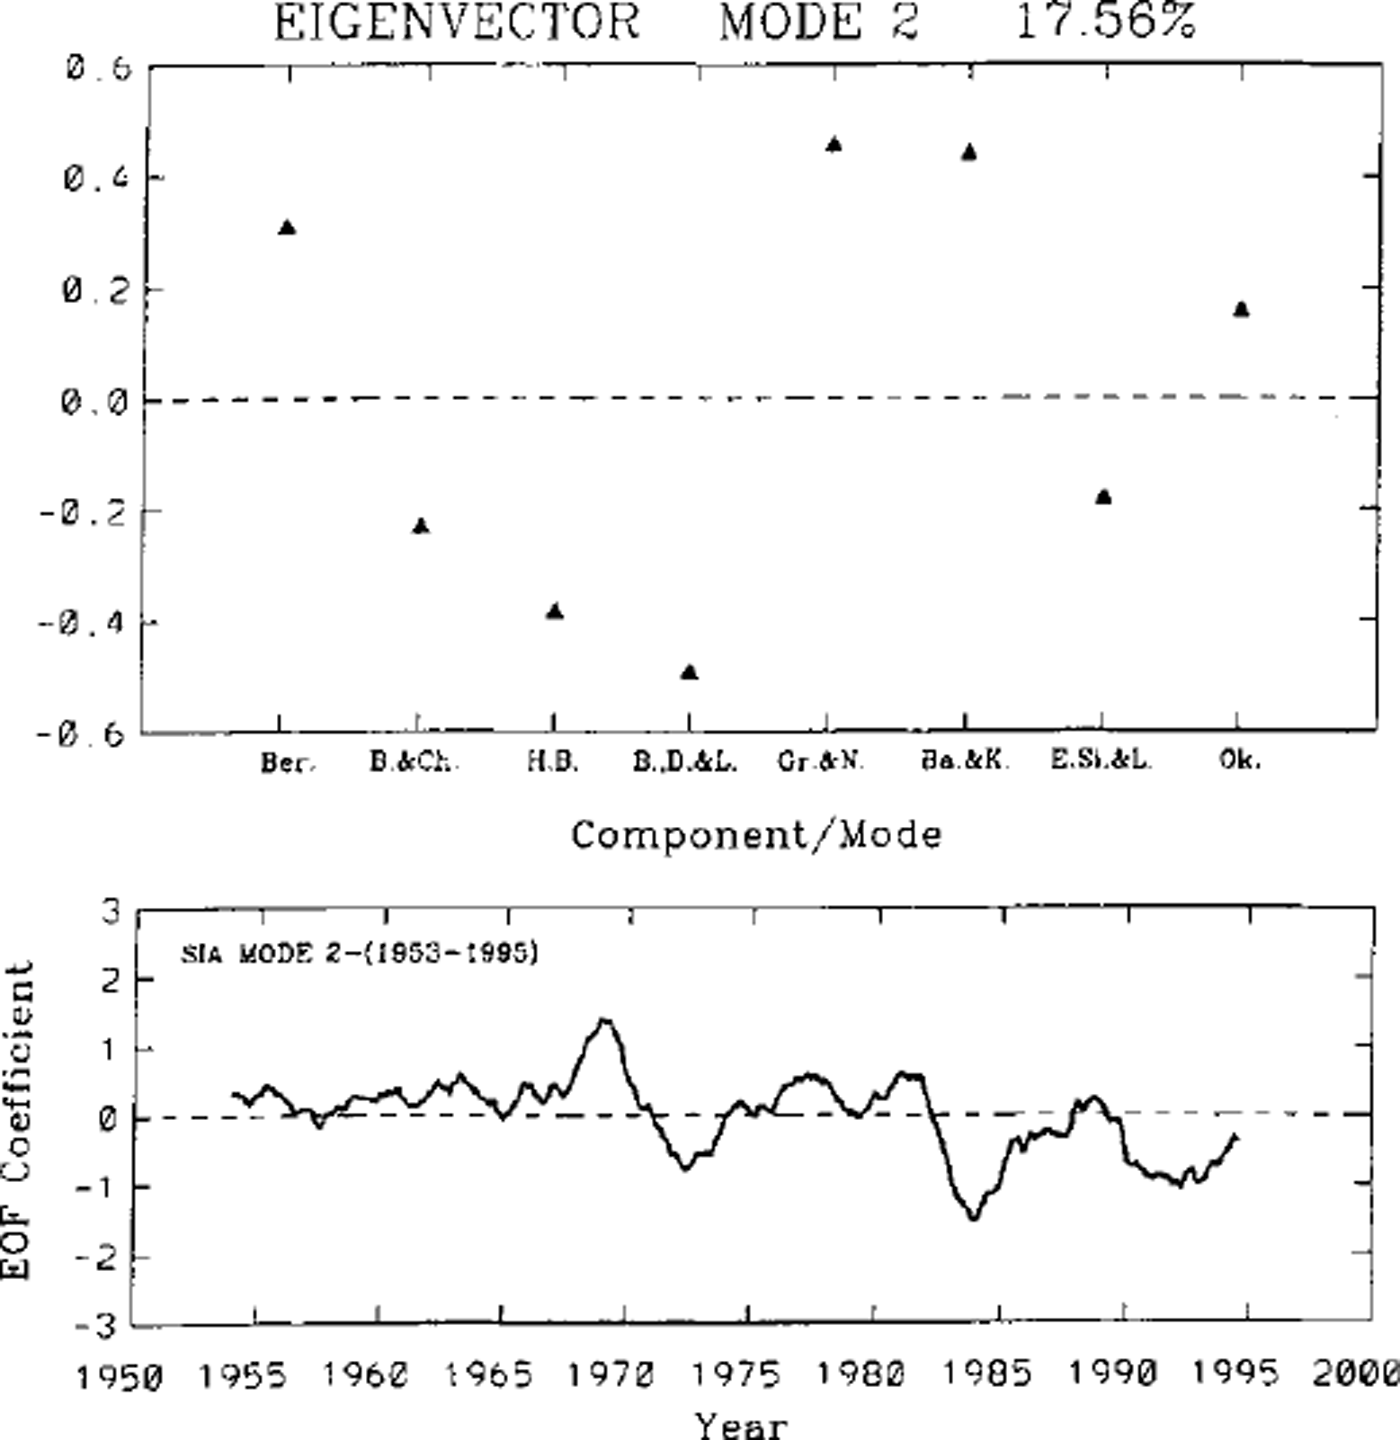
Fig. 8. Same as figure 6, except for the second eof mode for sia anomalies.
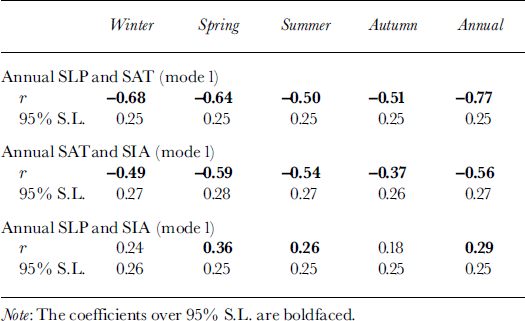
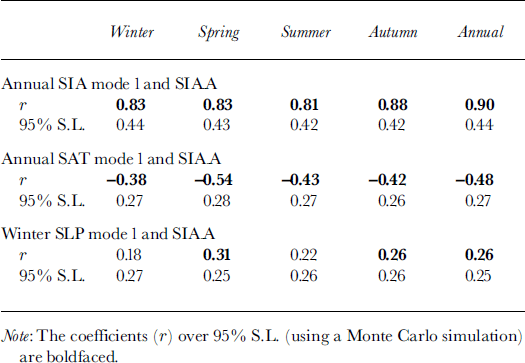
To quantitatively understand the two SIA patterns in the context of atmospheric circulation anomalies, we performed Monte Carlo simulations (Reference Wang, Mysak and IngramWang and others, 1994) of the SLP, SAT and SIA anomalies for the period 1953−97. Discussions are limited to those with a correlation of >95% significance level (S.L.). The leading SLP mode (AO) correlates to SAT over all four seasons (Table 3, upper pair), indicating that the AO operates differently from the NAO, whose index correlates to the SATanomaly only in winter, spring and autumn (Reference Mysak, Ingram, Wang and van der BaarenMysak and others, 1996). Furthermore, the leading SAT mode (associated with the AO) correlates to the leading SIA mode (i.e. ASIO) over all four seasons (Table 3, middle pair). The significant correlation between the summer SLP and SIA (Table 3, lower pair) occurs only in spring (r = 0.36) and summer (r = 0.26), implying that wind (an AO-related SLP anomaly) driving of the SIA (through advection, convergence and divergence) is most effective in spring and summer, when there are open waters, resulting in sea-ice thickness redistribution and sea-ice flux out of the Arctic Ocean (Reference Kwok and RothrockKwok and Rothrock, 1999; Reference Rothrock, Yu and MaykutRothrock and others, 1999). The correlation coefficients (Table 3) are generally larger than those using the longer dataset (WI00).
Table 3. Simultaneous and lagged correlation coefficients (r, with 95% s.l. derived from a monte carlo simulation) between the annual slp (the leading/AO) mode and the sat mode (upper pair; for the period 1953−97); between the annual satandsia (ASIO) (leading) modes ( middlepair; 1953−95); and between the annual slp and sia (leading) modes ( lowerpair; 1953−95)
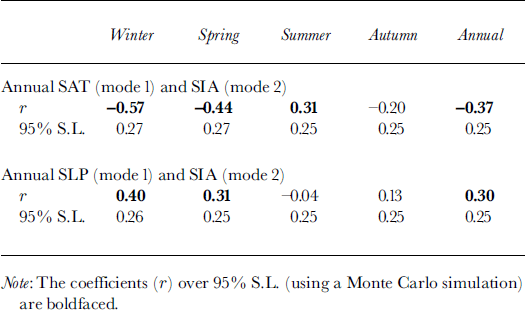
To reveal the features of SIA mode 2, the leading SAT- and SLP-mode time series were linearly regressed to the SIA mode 2 time series (Table 4). It is clear that SAT mode 1 negatively correlates SIA anomalies in both winter (r = −0.57) and spring (r = −0.44), although the positive correlation in summer may not be physically meaningful. Similarly, the leading SLP mode positively correlates to the SIA anomaly in both winter (r = 0.40) and spring (r = 0.31), while the other seasons are not significant (Reference Mysak, Ingram, Wang and van der BaarenMysak and others, 1996). This clearly indicates an AO/NAO-related SAT see-saw pattern (Reference Wang, Mysak and IngramWang and others, 1994; Reference Mysak, Ingram, Wang and van der BaarenMysak and others, 1996; Reference Deser, Walsh and TimlinDeser and others, 2000).
Table 4. Same as table 3, except the leading sat mode (upper pair) and leading slp mode ( lowerpair) linearly regress to sia mode 2
Further linearly regressing the leading SIA, SATand SLP modes to the total Arctic SIA anomaly (Table 5) results in correlation coefficients between the leading SIA mode and SIA anomaly all above 0.8 (Table 5, upper pair). The correlations between the leading SAT mode and SIA anomaly are also high (middle pair). However, only the winter time series of the leading SLP mode significantly correlates to the spring-summer-autumn SIA anomalies (r = 0.3, 0.22, 0.26, respectively). The summer correlation (r = 0.22) is not significant but is close to the 95% significance level of 0.26.
Table 5. Same as table 3, except that the leading sia mode (upper pair), leading sat mode (middle pair) and leading slp mode (lower pair) linearly regress to the total arctic sia anomaly (SIAA)
Finally, the leading SIA-mode (ASIO) time series was linearly regressed to the SIA anomaly of each region (Table 6, upper pair). SIA anomalies in all regions are significantly correlated to the leading SIA mode, except region 4 (Baffin Bay, Davis Strait and the Labrador Sea). However, the SIA anomaly for region 4 does exhibit a close correlation (0.32 compared to its 95% significance level of 0.35) with the leading SIA mode. Similarly, the second SIA-mode time series was linearly regressed to the SIA anomaly of each region (Table 6, lower pair). A dipolar or see-saw pattern can be captured between regions 3 and 4 and regions 5 and 6, consistent with the composite analysis of the SAT see-saw pattern of the NAO (Reference Wang, Mysak and IngramWang and others, 1994).
Table 6. Annual leading sia mode (upper pair) and second sia mode ( lowerpair) linearly regress to the total arctic sia anomaly (SIAA) and all eight regions

In summary, two major modes for the Arctic SIA anomaly can be extracted using the EOF analysis. The leading SIA mode is the AO-intensifying-trend-related mode, which has an in-phase (or spatially uniform) structure (Reference Deser, Walsh and TimlinDeser and others, 2000; Reference HäkkinenHäkkinen, 2000; WI00; Reference Ikeda, Wang and ZhaoIkeda and others, 2001). The second SIA mode shows a dipolar or see-saw structure in the Atlantic sector, which is also AO/NAO-related (Reference Häkkinen and GeigerHakkinen and Geiger, 2000) like the winter sea-ice variation pattern of Reference Deser, Walsh and TimlinDeser and others (2000). Significant evidence for the AO mode can be found in the oceanographic data. Reference Steele and BoydSteele and Boyd (1998) found that the cold halocline layer in the Arctic Ocean retreated from the decade 1979−87 to the decade 1988−96, indicating the significant effect of the AO on the ocean thermodynamics. Also, during 1979−87, the sea-ice anticyclonic circulation (i.e. the Beaufort Gyre) was much stronger than its counterpart during 1988−96, because the decreasing SLP (cyclonic anomaly) during the 1990s weakened the Beaufort High, which in turn was caused by the intensifying positive phase of the AO.
Next, we examine the spectral characteristics of the 95 year SIA time series from the four types of regions (Fig. 9). There are three major time-scales in the Bering Sea (type 1): about 12.5 years, 20 years and >50/>70 years (Reference MinobeMinobe, 1997; Reference Zhang, Wallace and BattistiZhang and others, 1997). In the East Siberian and Laptev Seas (type 2), two major time-scales are 14−18 years and >70 years. In the Greenland and Norwegian Seas (type 3), there are 18 year (Reference IkedaIkeda, 1990; Reference Mysak, Manak and MarsdenMysak and others, 1990) and >50 year periods (Reference Delworth, Manabe and StoufferDelworth and others, 1997). In Hudson Bay (type 4), major time-scales include an 18 year period and another period of >50 years. Regions 3 and 4 are correspondingly correlated in the see-saw regions (Reference Wang, Mysak and IngramWang and others, 1994; Reference Mysak, Ingram, Wang and van der BaarenMysak and others, 1996).
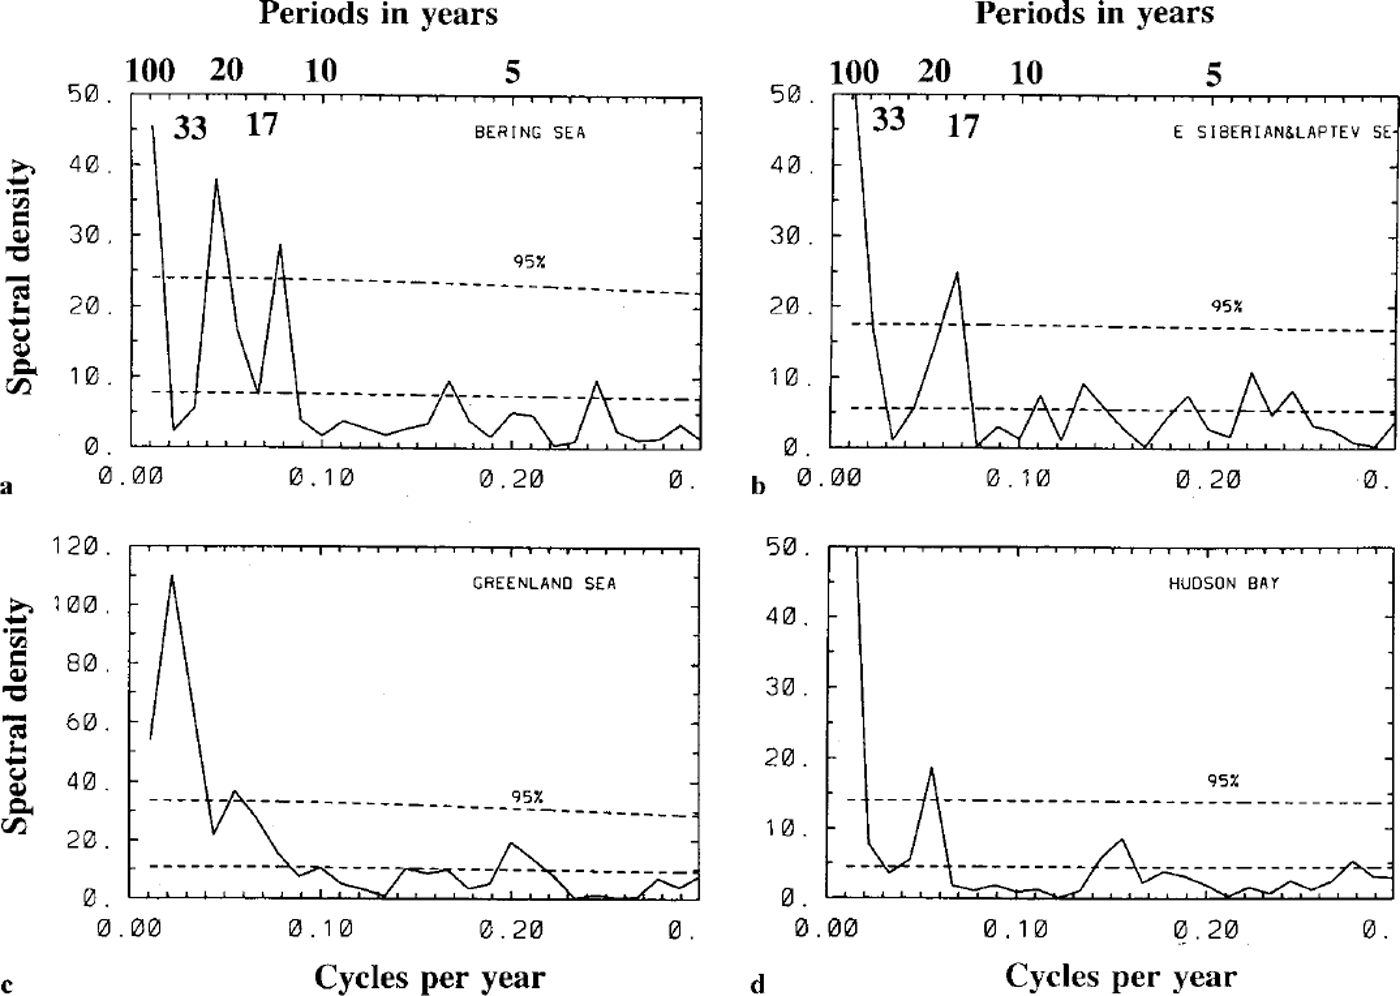
Fig. 9. The auto-spectrum (solid curve) of the tine series of the SIA anomalies for the period 1901−95 in the bering sea (a), the east siberian and laptev seas (b), the greenland and norwegian seas (c) and hudson bay (d). the upper (lower) dashed curve denotes the 95% confidence limit (red-noise spectrum). since the time series have been normalized by their own standard deviations, the units of the spectra are in period in years (a, b) or cycles per year (c, d).
Overall, there are three major time-scales: 12−14 years (Reference HäkkinenHäkkinen, 2000; Reference Hilmer and LemkeHilmer and Lemke, 2000), 17−20 years and >50/>70 years (which is probably the century time-scale). The >50year (probably 100 years and longer) time-scales are evident from the time series of the total Arctic SIA anomaly, as well as from the time series of SI As in the eight regions (see Figs 4 and 5). In particular, a century time-scale is evident in the Sea of Okhotsk (if the records are as good in the first half of the 20th century as in the second half). Longer time series or their proxies are needed to verify this >50/ >70 year time-scale of sea-ice anomalies in the Arctic.
5. Statistics and Annual and Seasonal SIA Trends in the Last Three Decades
ASIO may consist of two variations in response to AO. One responds to an AO-intensifying trend (Reference Thompson, Wallace and HegerlThompson and others, 2000), and the other to AO/NAO-related atmosphere-ice-ocean interactions (positive feedback triggered by reduced ice thickness in the Arctic) over the Atlantic sector (Reference IkedaIkeda, 1990; Reference Wang, Mysak and IngramWang and others, 1994; Reference Mysak, Ingram, Wang and van der BaarenMysak and others, 1996; Reference Ikeda, Wang and ZhaoIkeda and others, 2001). In this section, we examine the SIA trends (Reference VinnikovVinmkov and others, 1999; Reference VinjeVinje, 2001) over the last three decades in terms of annual and seasonal characteristics in both regional (all eight regions) and global (total Arctic sea-ice cover character) views.
Figure 10 shows annual time series of the most sensitive seasons (spring and summer) for all eight regions and the total Arctic seas. The trends since 1970 are remarkable, varying from region to region, with the interannual and decadal variability superimposed.
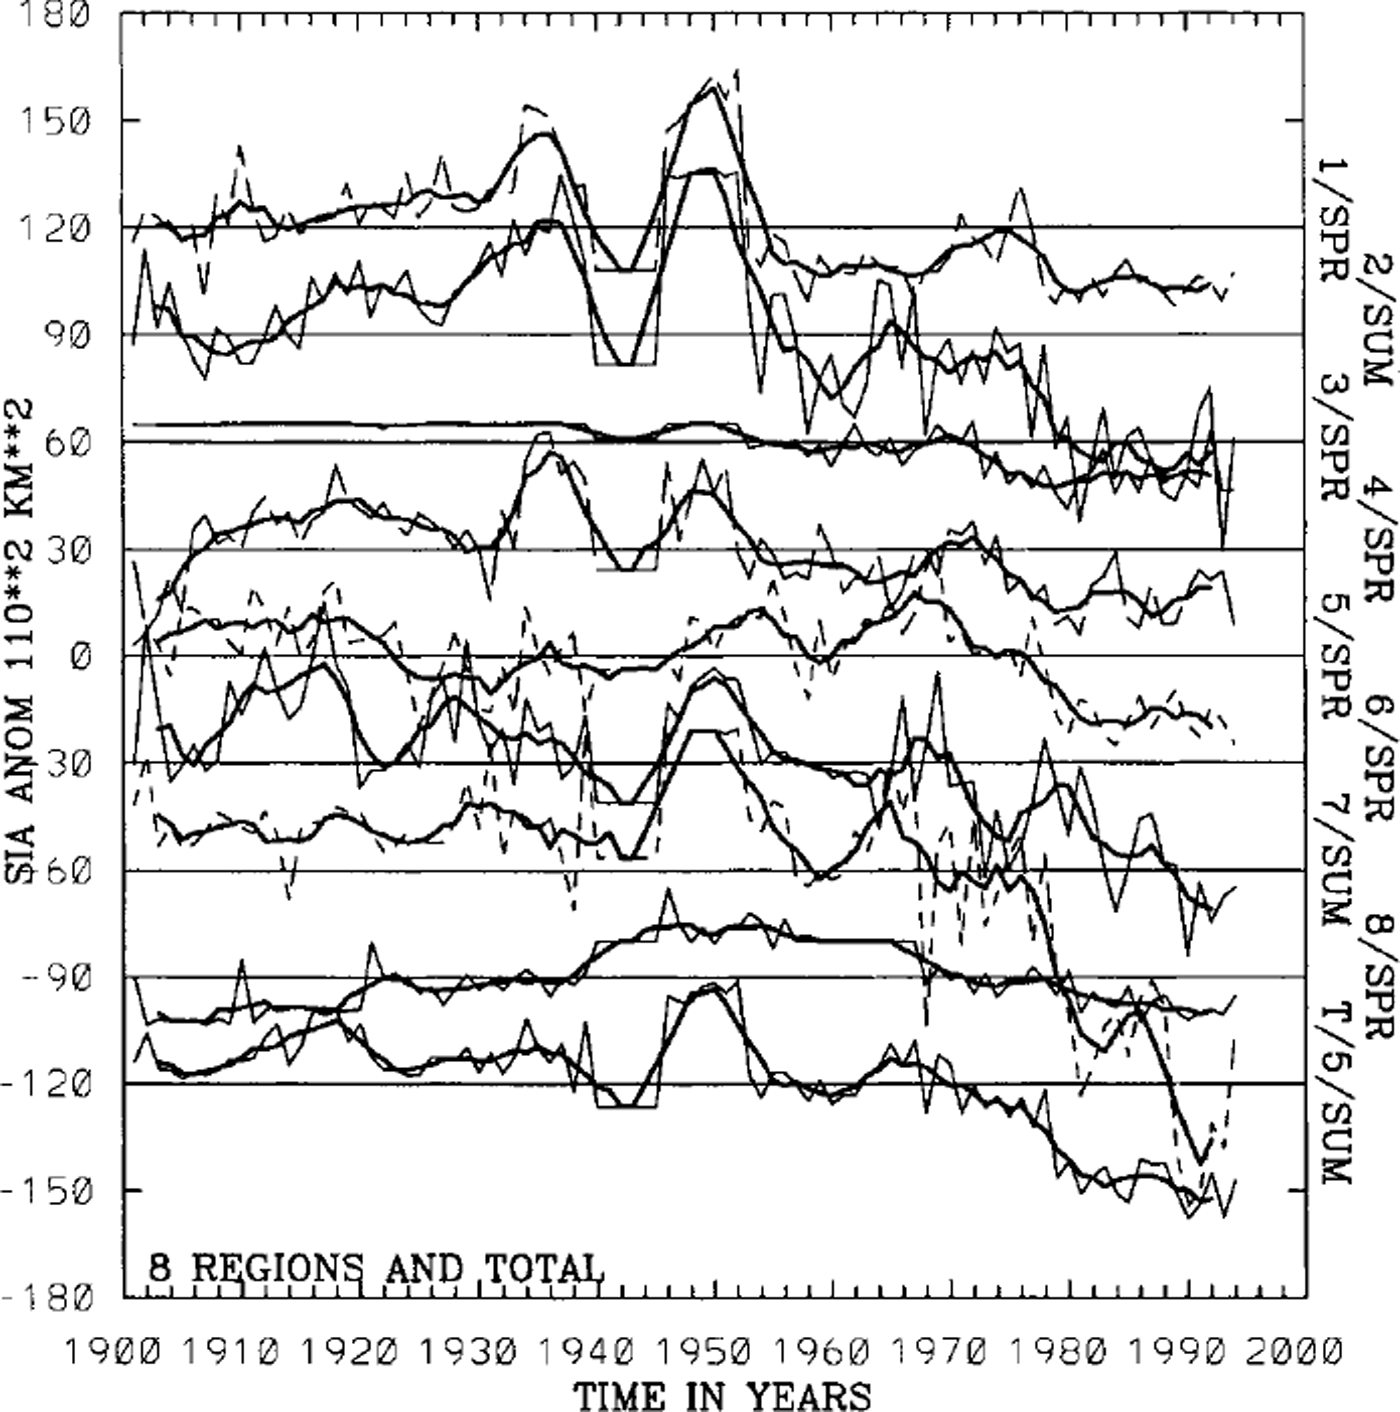
Fig. 10. Annual averaged tine series of the most sensitive seasons for the eight regions and the total arctic seas. the thick lines denote the 5 year running means. the vertical coordinate is relative with an interval of 30 × 1102 km2, and the total arctic SIA anomaly has been divided by a factor of 5.
Table 7 shows the seasonal statistics and trends from 1970 to 1994. High STDs usually occur in either spring or summer, as do the negative trends. Note that although summer negative trends in some regions (regions 3, 4, 6, 8) are large, their seasonal contributions to the annual trends may be relatively small, because their summer means are smaller than the means of other seasons. Their relative contribution to the annual SIA anomalies can be obtained (Table 7, rightmost column) by multiplying a factor, f = ai/ ∑i ai (where i = 1, 2, 3 and 4, representing four seasons, and a is the SIA).
Table 7. Seasonal statistics of 95 year sia data, trends from 1970 to 1994, and the relative seasonal contribution (rightmost column) to the annual trend of each region ( table 8, rightmost column). units are 1102 km2
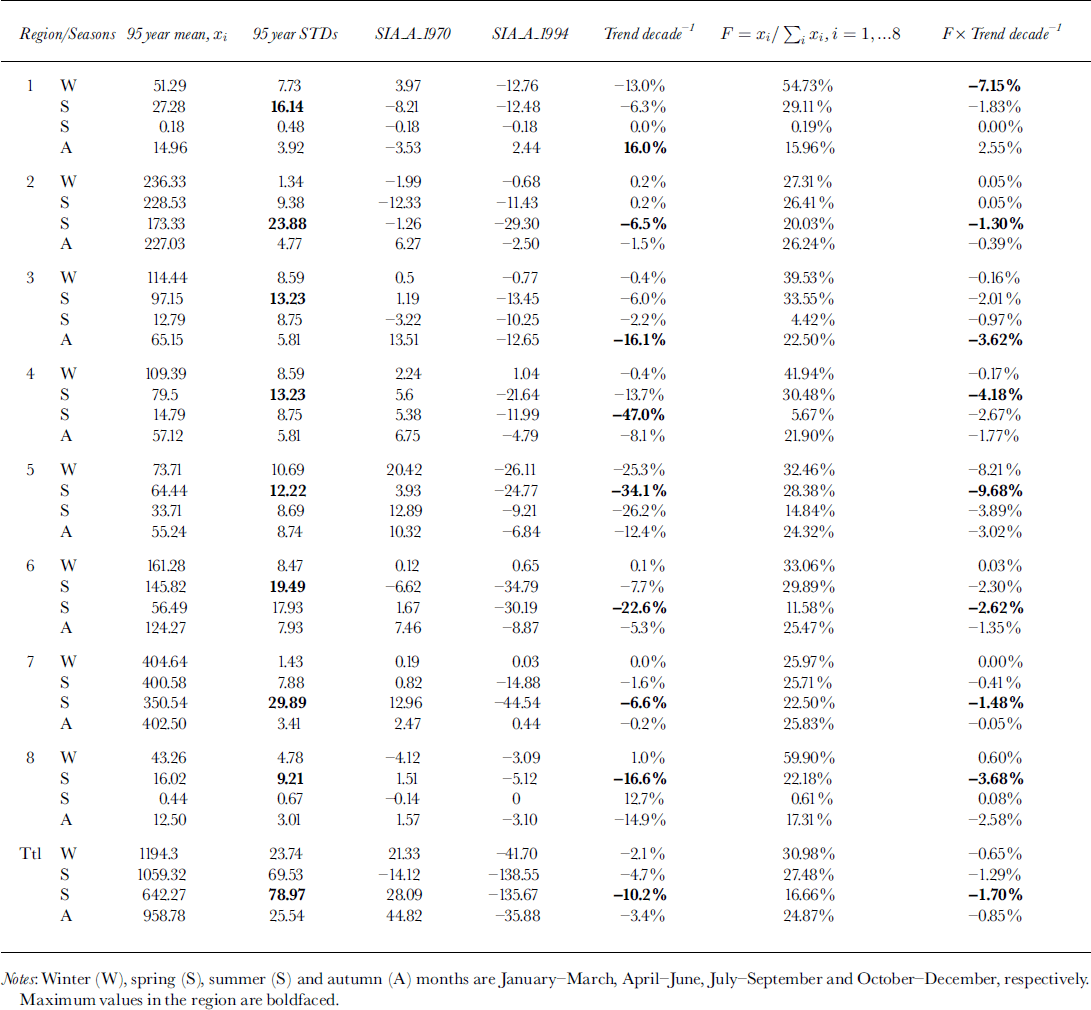
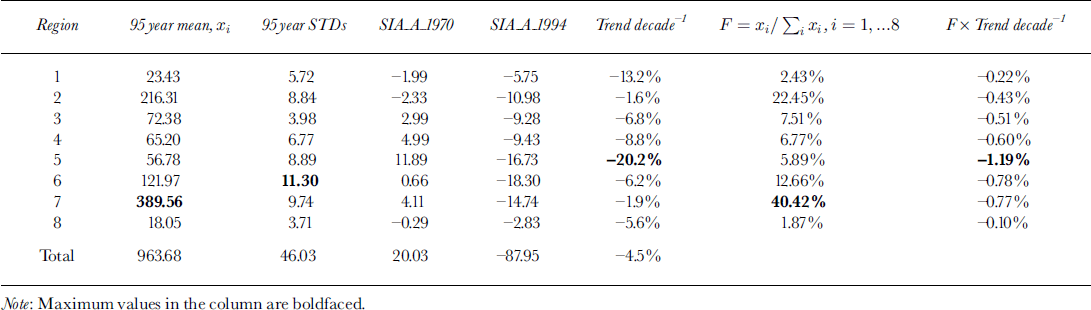
Table 8 depicts the annual statistics, trends and relative regional contributions to the total Arctic sea-ice change. In the last three decades (1970−94), the negative trend of the total Arctic sea-ice extent is − 4.5% per decade. This can be simulated by a coupled ice-ocean model (-4% per decade; Reference Hilmer and LemkeHilmer and Lemke, 2000). The negative trends vary from region to region. The relative regional contributions to the total Arctic trend can be listed as follows, in order of magnitude (Table 8, rightmost two columns): regions 5 (-1.19%/-20.2%), 6 (-0.78%/-6.2%), 7 (-0.77%/-1.9%), 3 (-0.51%/-6.8%), and 2 (-0.43%/-1.2%), in terms of relative/absolute reduction rate (percentage per decade), although the large absolute reduction rate occurs in regions 1 (-13.2%) and 8 (-5.6%) (see Table 8, sixth column). The regional reduction rate of-20.0% per decade is largest in the Greenland and Norwegian Seas (region 5).
Table 8. Annual statistics of 95 year sia data, trends from 1970 to 1994, and the relative regional contribution (sixth and last columns) to the total arctic sea-ice trend of-4.5% per decade. units are 1102 km2
6. Conclusion and Discussion
Four types of seasonality of sea-ice variations were categorized (Table 2). Type 1 (Bering Sea, Sea of Okhotsk) has nearly zero variability (standard deviation) in summer and large variability in winter, with no boundary limit of the SI A. Type 2 (Beaufort and Chukchi Seas, East Siberian and Laptev Seas) has the largest variability in summer without any limit and has the smallest variability in winter with SIA limited by the land-boundary constraint. Type 3 (Baffin Bay-Labrador Sea, Greenland and Norwegian Seas, Barents and Kara Seas) has comparable year-round variability, with summer ice STD being largest and without land-boundary constraint. The ocean circulation and its heat transport have the strongest impact on the sea-ice pattern in these regions. Type 4 (Hudson Bay) has nearly zero ice area in summer and the strongest land-boundary constraint in winter, so variability is stronger in spring and autumn. Therefore, investigation of spring break-up time and fall freezing dates will help predict the summer and winter ice conditions in Hudson Bay. Sea-ice thickness must be used to detect the wintertime ice conditions and ice volume in those regions with land constraint, such as regions 2, 3 (Reference Wang, Mysak and IngramWang and others, 1994) and 7.
Arctic sea-ice extent has experienced a negative trend since the 1970s (-4.5% per decade), with the largest trend occurring in summer (-10.2% per decade). This corresponds to the intensifying AO events that result in a warming of northern Europe and the central Arctic (Reference Thompson, Wallace and HegerlThompson and others, 2000; WI00). All eight regions experience deduction rates ranging from −1.6% to −20.2% per decade (Table 8, sixth column), with those in region 5 (the Greenland and Norwegian Seas) being the highest (-20.2% per decade).
In terms of SIA anomaly, two major EOF modes were extracted, which physically correspond to the AO/NAO. The ASIO shows the in-phase decrease in sea-ice thickness/ice cover, superimposed by the decadal oscillations in response to the intensifying AO-related SAT pattern (WI00; Reference Ikeda, Wang and ZhaoIkeda and others, 2001). The other pattern has a dipolar structure (the see-saw regions) between regions 3 and 4 and regions 5 and 6 in the Atlantic sector (Reference Wang, Mysak and IngramWang and others, 1994; see their figs 6 and 7).
In addition to the interannual time-scales, the major decadal and interdecadal time-scales were also found for the Arctic sea-ice areas: 12−14 and 17−20 years for the four types of regions (Reference Mysak, Manak and MarsdenMysak and others, 1990; Reference HäkkinenHäkkinen, 2000; Reference Häkkinen and GeigerHakkinen and Geiger, 2000; Reference Hilmer and LemkeHilmer and Lemke, 2000). Longer SIA time series or their proxies are needed to verify the >50/>70year (Reference Delworth, Manabe and StoufferDelworth and others, 1997; Reference MinobeMinobe, 1997) and century time-scales (Reference Tremblay, Mysak and DykeTremblay and others, 1997). In the North Pacific sector, Reference MinobeMinobe (1997) found the 50−70 year periods in the North Pacific Oscillation using SLP, SAT, sea-surface temperature and tree-ring data. In the Atlantic sector, Reference IkedaIkeda (1990) proposed that the air-ice-ocean system is essential for the decadal oscillation. Reference Mysak, Manak and MarsdenMysak and others (1990) also found interdecadal variability in sea-ice extent and linked it, by a hypothesized feedback loop, to the Great Salinity Anomaly (Reference Dickson, Meincke, Malmberg and LeeDickson and others, 1988). Reference Delworth, Manabe and StoufferDelworth and others, (1997) found the 40−80 year periods in the ocean temperature and salinity in the Greenland Sea in a 2000 year integration of a coupled ocean-atmosphere model.
From the time series of total Arctic ice anomaly (Fig. 5), there has been a significant decrease in sea-ice extent since 1970. If the sea-ice thickness of the reduced area is about 1 m in the last three decades (Reference Rothrock, Yu and MaykutRothrock and others, 1999), then the total reduction in ice volume is 964 km3 because SIA has decreased by about 80 × 1102km2 since the 1970s. In other words, less ice-equivalent fresh water (Reference McPhee, Stanton, Morison and MartinsonMcPhee and others, 1998) must reside in the Arctic surface layer, with a residence time of about 10 years (Reference Aagaard and CarmackAagaard and Carmack, 1989). If the anomalous surface fresh water is transported out of the Arctic through Fram Strait (Reference Kwok and RothrockKwok and Rothrock, 1999; Reference VinjeVinje, 2001) by the anomalous Transpolar Drift Stream (Reference Steele and BoydSteele and Boyd, 1998) into the Western and Eastern Greenland Currents, eventually joining the Labrador Current, this results in stronger than normal stratification of the surface layer in the regions covered by the large anomalous fresh water from the Arctic, i.e. deep-water formation is unlikely to occur. This would result in the shutdown of the deep convection of the dense water and global thermohaline circulation (Reference Mysak, Manak and MarsdenMysak and others, 1990; Reference Manabe and StoufferManabe and Stouffer, 1997). Thus, fresh water is considered an important factor in a feedback loop with decadal cycles (Reference Robitaille, Mysak and DarbyRobitaille and others, 1995; MV98; Reference Ikeda, Wang and ZhaoIkeda and others, 2001). Furthermore, we need to know what kind of active (rather than passive as a predictor only) role the ASIO plays in global climate change, as well as regional (Arctic) climate change (Reference Wu, Huang and GaoWu and others, 1999; Reference Ikeda, Wang and ZhaoIkeda and others, 2001).
Acknowledgements
We thank the Frontier Research System for Global Change, through JAMSTEC, Japan, for financial support. The authors appreciate fruitful discussions with M. Wallace, J. Walsh, L. Mysak, S. Manabe, K. Yamazaki and S. Minobe.


