


Introduction
Many Antarctic blue-ice areas (BIAs) are known to have very old ice at the surface (Reference Whillans and CassidyWhillans and Cassidy, 1983; Reference BintanjaBintanja, 1999). However, the dating of the surface ice is still problematic. The easily recoverable ancient surface ice could be of great value for palaeoclimatic purposes if the dynamics and the internal structure of the BIAs were better known (Reference BintanjaBintanja, 1999).
Scharffenbergbotnen is the best-studied Antarctic BIA from the glaciological point of view. However, the flow regime and the surface age distribution of the area are still partially unknown. Flow models and 14C analysis show that the age of most of the surface blue ice varies between 10 000 and 100 000 years (Reference Van RoijenVan Roijen, 1996; Reference Grinsted, Moore, Spikes and SinisaloGrinsted and others, 2003), but there are large differences in ages found by each method. No significant changes in surface mass balance have been observed over a 14 year measuring period in Scharffenbergbotnen (Reference Sinisalo, Grinsted, Moore, Kärkas and PetterssonSinisalo and others, 2003a). The temporal mass-balance record from the area therefore suggests that the BIA is relatively stable. However, there are large spatial variations in accumulation rates in the valley.
Ground-penetrating radar (GPR) has been successfully used to study the spatial accumulation distribution elsewhere in Antarctica (e.g. Reference Richardson, Aarholt, Hamran, Holmlund and IsakssonRichardson and others, 1997; Reference Sinisalo, Moore, van de Wal, Bintanja and JonssonSinisalo and others, 2003b). In this paper, we use GPR to study the spatial mass-balance distribution and the internal ice dynamics of Scharffenbergbotnen. We calculate the ages for continuous reflecting horizons taking them to be isochrones, which are then used to complement the accumulation data in the valley.
There have been several attempts to model the ice flow in Antarctic BIAs (Reference Naruse and HashimotoNaruse and Hashimoto, 1982; Reference Whillans and CassidyWhillans and Cassidy, 1983; Reference Azuma, Nakawo, Higashi, Nishio and KawaguchiAzuma and others, 1985). The ice flow has been modelled in Scharffenbergbotnen by Reference Whillans and CassidyVan Roijen (1996) and Reference Grinsted, Moore, Spikes and SinisaloGrinsted and others (2003). The latter model is tested here by comparing the modelled isochrones with those observed by GPR near the equilibrium line between the firn and BIAs.
Field Site
Scharffenbergbotnen, northwest Sivorgfjella, Heimefrontfjella, is a closed valley with an inflow from the surrounding ice sheet. There are two separate BIAs in the valley (Fig. 1). Although the BIAs are characterized by ablation, the surrounding glacier firn areas present positive accumulation, with equilibrium lines that approximately follow the perimeter of the BIAs. The large closed-type BIA dammed by the mountains covers the eastern part of the valley. A smaller, open-type BIA where the ice flow is not stopped by mountains forms a surface depression at the northwestern entrance. Ice apparently flows into the valley from the wide northwestern and the shallow, narrow western entrances, and from an icefall at the eastern end of the valley. The maximum ice thickness is about 1000m (Reference Herzfeld and HolmlundHerzfeld and Holmlund, 1990). The area is described in detail by Reference JonssonJonsson (1992) and Reference Sinisalo, Grinsted, Moore, Kärkas and PetterssonSinisalo and others (2003a). The age of the surface blue ice in Scharffenbergbotnen has been determined by 14C analysis of shallow ice cores. From this analysis the surface ice appeared to be 10±5 kyr old, though occasionally >24 kyr (Reference Whillans and CassidyVan Roijen, 1996). However, the oldest surface ice is >100 kyr old according to the latest flow model (Reference Grinsted, Moore, Spikes and SinisaloGrinsted and others, 2003).

Fig. 1. Scharffenbergbotnen valley in western Dronning Maud Land, Antarctica. Map coordinates are Universal Transverse Mercator (UTM) zone 29C determined by precise differential GPS positions; the base map is based on Reference Jacobs and WeberJacobs and Weber (1993) with map coordinates shifted by 75 m eastward and 190 m southward to match ground-control points. The GPR lines used to determine the mass-balance distribution in the valley are plotted; the data shown in Figures 3 and 5 are from the thicker-line section.
Measurements and Methods
The GPR survey (Fig. 1) with precise global positioning system (GPS) was made using a 50 MHz Malå ˚ Geoscience pulse radar and the same settings as described in Reference Sinisalo, Moore, van de Wal, Bintanja and JonssonSinisalo and others (2003b). The objective of the survey was to track and date radar isochrones to map the mass balance in the valley, to determine the surface age gradient of the blue ice and to study the dip angles of the isochrones at the firn/blue-ice transition zone.
It is essentially proven that the continuous reflecting horizons detected by GPR represent isochrones in the firn pack (Reference Eisen, Wilhelms, Nixdorf and MillerEisen and others, 2003a, Reference Eisen, Wilhelms, Nixdorf and Millerb; Reference Sinisalo, Moore, van de Wal, Bintanja and JonssonSinisalo and others, 2003b). The two-way travel times t tw of the radar wavelet
are converted to the real depths D by using Reference RobinRobin’s (1975) expression

where c = 3 × 10⁸ ms–1 is the speed of light in a vacuum, ![]() is the mean density of the firn calculated from the surface to the depth D and l
a = 2 m is the antenna separation.
is the mean density of the firn calculated from the surface to the depth D and l
a = 2 m is the antenna separation.
A correction for strain thinning of layers with depth must be made in order to calculate the age of the isochrones at each depth. In general, the layers followed are not very close to the bed, and a range of plausible layer-thinning models give very similar results. Hence, the layer thinning with depth is estimated using the simple model by Reference NyeNye (1963) which predicts the age T at a depth D we (in water equivalent (w.e.)) via
where a c is the mean accumulation rate in mw.e. a–1, and H is the total ice thickness in mw.e. The method used to calculate the age of a layer requires some knowledge of accumulation, which can be estimated from the relatively sparse and short-period stake measurements.
The mass-balance distribution was calculated from the stake measurements, firn-core, blue-ice-core and snow-pit studies and the GPR measurements made in the valley (Reference JonssonJonsson, 1992; Reference Grinsted, Moore, Spikes and SinisaloGrinsted and others, 2003; Reference Spencer, Alley and CreytsSinisalo and others, 2003a). The stakes were also used to measure the horizontal velocity field in the valley (Reference Whillans and CassidyVan Roijen, 1996; Reference Grinsted, Moore, Spikes and SinisaloGrinsted and others, 2003; Reference Spencer, Alley and CreytsSinisalo and others, 2003a). The locations of these are shown in Figure 1.
Results
Radar isochrone dating
To estimate the surface age gradient in the vicinity of the BIAs from the GPR data the isochrones must be dated first. The density–depth profile was calculated from Reference Herron and LangwayHerron and Langway (1980) assuming a constant average surface snow density of 400 kg m–3, which appears to be independent of actual accumulation rates at many sites in Antarctica (Reference Spencer, Alley and CreytsSpencer and others, 2001). Ice-thickness data come from Reference Herzfeld and HolmlundHerzfeld and Holmlund (1990). To test the dating method, the age of the same isochrone was calculated at its closest points to stakes 4 and 17 (Fig. 1) using the mean accumulation rates over a 6 year period measured from these two stakes (Reference Spencer, Alley and CreytsSinisalo and others, 2003a). The stakes are located on firn, between the two BIAs (Fig. 1). The parameters used and the calculated depths and ages are shown in Table 1. The layer depths obtained correspond to a mean permittivity of 2.8–3.0 over the thickness of the firn pack above the layer. The error in the calculated age for the same layer at stakes 4 and 17 is about 6%. The result is satisfactory when taking into account errors in stake measurements (Reference Sinisalo, Moore, van de Wal, Bintanja and JonssonSinisalo and others, 2003a).
Table 1 Age–depth calculation at the locations of stakes 4 and 17 and the Dutch automatic weather station (AWS) (see Fig. 1)

Mass balance
It is essential to know the surface mass-balance gradient along the flowline in order to calculate the surface age gradient. The accumulation rates along the GPR profiles are calculated by tracking continuous layers. A 3 year mean of the accumulation measured by a Dutch automatic weather station (Fig. 1; Reference ReijmerReijmer, 2001) was also used with the GPR data to study the accumulation distribution outside of the valley, where no direct stake measurements are available.
Equations (1), (2) and the density–depth profiles are solved iteratively using the mean of the calculated ages for the layers at each GPR sounding along the GPR ground track. The ablation rates on the BIAs were found from stake measurements supplemented by rates from the 14C analysis of ice cores (Reference Whillans and CassidyVan Roijen, 1996; Reference Van der KempVan der Kemp and others, 2002).
The surface mass-balance map based on the GPR, stake, snow-pit and ice-core measurements is presented in Figure 2a. This shows that the net surface mass balance in the valley is about –215×103m3 a–1 (Table 2).

Fig. 2. Same as Figure 1, but showing (a) mass-balance distribution (mmw.e.) in the valley interpolated from stake, GPR, snow-pit and ice-core data; and (b) velocity distribution in the valley interpolated from stake data and areas of different ice origin. The modelled flowline (Reference Grinsted, Moore, Spikes and SinisaloGrinsted and others, 2003) is shown as a dashed line in (b).
Table 2 Mass-balance distribution in the valley
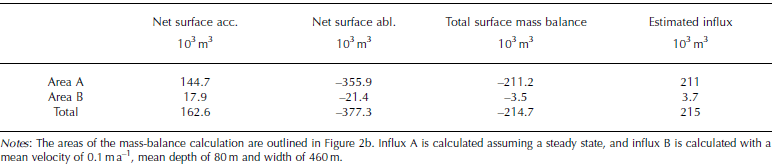
The ice surface velocity is measured from stakes in the valley (Reference Van RoijenVan Roijen, 1996; Reference Sinisalo, Moore, van de Wal, Bintanja and JonssonSinisalo and others, 2003a) and then interpolated to cover the whole area. Figure 2b shows that the valley can actually be split into different mass-balance zones based on the surface velocity data and on the moraine formations. The calculated inflow from the narrow western gate to area B is about 3.7 ×10³m3 a–1. Thus, the net surface mass balance, –3.5×10³m3 a–1, of area B is almost exactly balanced by the inflow, and it can be said that area B is in steady state. The influx from the northwestern entrance is much more difficult to define due to sparsity of surface velocity data measured from the stakes. However, the influx through the entrance to area A as outlined in Figure 2b would have to be about 211 ×103m3 a–1 to balance the net ablation in the valley. Area C is fed by local accumulation along the side-wall valley nunataks. The total ablation based on the stake measurements in area C is about 64 ×103m3 a–1 and it must be balanced by the local accumulation if the area is in steady state. No stake-balance or velocity data are available for area D at the eastern end of the valley. However, locations of the moraines and visible bands on aerial photographs (Reference Jacobs and WeberJacobs and Weber, 1993) allow us to define the boundary between areas A and D. Calculating ablation rates for area D from stakes at the boundary between the areas gives a total ablation of 21 ×103m3 a–1 which should be balanced by a flux from the accumulation area on the icefall itself and outside of the valley in steady state. If the area is in balance, a surface velocity of about 0.20 ma–1 is needed across the equilibrium line in area D, which is similar to the other measured velocities in the valley.
The visible features of the moraine formations in the valley seen in the aerial photographs provide evidence of flow behaviour in the past. The moraine ridge between areas A and C is well defined and thick. This moraine may indicate that the boundary between areas A and C has remained more or less stationary for a long time. In contrast, the boundary between areas A and B is less well defined and may remain fairly dynamic except for a short but thick moraine at the eastern end of the boundary. This is consistent with changing inflow through the narrow western gate as ice-sheet thickness changed over time. The ice-sheet elevation was about 20–40m higher than at present in the vicinity of Scharffenbergbotnen about 6–12 kyr BP (Reference Van RoijenVan Roijen, 1996; Reference Näslund and FastookNäslund and others, 2000). This would increase flow by 50% through the gate assuming that the ice velocities were unchanged for the period. It would take about 10–20 kyr for this pulse of increased influx to travel from the gate to the moraine between areas A and B.
The ice velocities and mass balance inside the Scharffenbergbotnen valley are much lower than those typical for the area (Reference Richardson, Aarholt, Hamran, Holmlund and IsakssonRichardson and others, 1997; Reference Näslund and FastookNäslund and others, 2000; Fig. 2a) and therefore are not simply related to the climate conditions outside of the valley. The ice that enters the valley diverges as the flowline turns south, and slows considerably (Fig. 2b). The flow of ice into the valley is regulated by the extent of the divergence, which is heavily influenced by the ice-sheet mass balance. Much of the ice from the higher-elevation accumulation area does not flow into the valley, but passes across the northwestern valley entrance to the west. During periods of ice-sheet thickening as modelled after the end of the glacial period (Reference Van RoijenVan Roijen, 1996; Reference Näslund and FastookNäslund and others, 2000), more ice flows into the valley, thereby raising the surface, and eventually inhibiting ice inflow. During periods of thinning, less ice flows into the valley until ablation of the BIA lowers the surface, thereby compensating for reduced influx.
Surface age distribution
The surface age distribution in the firn/blue-ice transition zone can be found in three ways: by the dated GPR isochrones, by considering the geometry of the isochrones and by a flowline model of Reference Grinsted, Moore, Spikes and SinisaloGrinsted and others (2003).
Three dated GPR layers that were used to determine the surface age gradient are plotted in Figure 3. The ages for the layers were calculated from GPR data at the top of the snow ridge in the vicinity of stake 17 where the layers are flattest and the accumulation rate is higher than elsewhere on the snow area along the flowline. The isochrones were followed to the firn/blue-ice transition zone where they come up to the surface and allow us to determine the surface age gradient.

Fig. 3. A GPR section over the snow ridge between the BIAs in the valley (see Fig. 1). The main BIA is on the left side of the snow ridge, and the smaller BIA on the right side. Ice flows from right to left in the figure. Note that the data are not migrated, i.e. the dip angles of the layers appear steeper than they actually are. The ages of the marked layers are 504, 853 and 1122 years.
The along-flow surface age gradient (dT/dx) in the vicinity of the equilibrium line can also be found geometrically. In steady state
where t is time and the horizontal velocity u is constant. We
assume that
where w(x) is the vertical velocity gradient along the flowline, x is the distance of the outcropping layer from the equilibrium line, and b' and a' are the ablation and accumulation gradients along the flowline. Layer thinning can be ignored in the firn/blue-ice transition zone for the near-surface layers. In steady state it can be written
If the ablation-rate and accumulation-rate gradients are similar, the righthand side of Equation 1 reduces to ~2/u. From Figure 2 it can be seen that a' is perhaps 1–2 times b' along the flowline, giving an age gradient from Equation 1 of 7–10 years m–1 using a mean surface velocity of 0.2 ma–1 in the firn/blue-ice transition zone (Fig. 2b).
The flowline model (Reference Grinsted, Moore, Spikes and SinisaloGrinsted and others, 2003) was used at very high resolution in the equilibrium zone and gave a surface age gradient of about 8 years m–1, whereas the horizontal age gradient derived from the GPR data is about 3–6 years m–1 (Fig. 3). Thus, the flowline model and Equation 1 are very consistent, while the observed radar isochrones give a lower gradient. There are several possible reasons for the discrepancy. Model input data of accumulation rates are averaged over a larger area than is used in the age calculation for the GPR horizons near stake 17. The surface density doubles in the firn/blue-ice transition zone in a relatively short distance, so there is also a horizontal gradient for the permittivity. However, without any detailed measurements this has been ignored in the migration of the GPR isochrones. The equilibrium line may also have migrated over time, i.e. non-steady-state condition, though its impact is hard to estimate and appears contrary to recent observation (Reference Sinisalo, Moore, van de Wal, Bintanja and JonssonSinisalo and others, 2003a).
Dip angles of isochrones
The dip angles of GPR layers can be compared with the dip angles from geometric arguments, and also with those from the flowline model isochrones (Reference Grinsted, Moore, Spikes and SinisaloGrinsted and others, 2003). The GPR data were migrated to obtain true angles for the dipping horizons assuming a constant permittivity of 2.9, which is consistent with Table 1, and mean density of 800 kg m–3 for the firn pack above the layers. The angles are calculated from depths in mw.e.
The processed GPR layers come up from the accumulation areas towards the BIAs at an angle of 1–7˚ relative to the surface (Fig. 4). The measured angles are corrected by a factor of 1/cos φ, where φ is the horizontal angle between the GPR ground track and the ice-flow vector, in order to obtain along-flow dip angles and to compare them with the modelled isochrones.

Fig. 4. Same as Figure 1, but showing the dip angles (˚) of isochrones relative to the surface from migrated GPR profiles across the equilibrium line to demonstrate the relative differences in them due to different horizontal velocities and mass-balance gradients. The angles are corrected for ice-flow direction to be true dip (see Fig. 2b).
Ideally, a single layer should be followed through each transition zone in the GPR data. However, this cannot be done due to the gaps in the data when they cross BIAs, so instead we consider layers from approximately the same depth. The angles in Figure 3 are calculated for two layers of 20 and 30m maximum depth to give a range. For the layers at the northern entrance of the valley, the dip angles are low, as may be expected from the high velocity in the area. The 2˚ angle seen at the western edge of the main BIA is due to the very low ablation-rate gradient there rather than high velocities.
The dip angle of an isochrone can also be calculated if the horizontal velocity u and the ablation and accumulation gradients b' and a' are known. From the layer geometry, we
obtain for the dip angle α

Equation 1 shows the linear dependence of the dip angle on the horizontal distance x from the equilibrium line. This is consistent with the GPR data which show near-surface layers less steep than the deeper ones (Fig. 3). However, our goal here is to demonstrate the relative changes in the dip angles on different sides of the BIAs with different flow velocities and mass-balance gradients, and this we can do using layers from a small depth range.
The GPR layers and the flowline-model isochrones in the snow ridge between BIAs are plotted in Figure 5. The dip angles of both the observed and modelled isochrones are 3–5˚ at the firn/blue-ice transition zone of the main BIA. There is a relative lack of agreement in the length of the isochrones, because the modelled flowline (Fig. 2b) and the GPR profile (Fig. 1) do not overlap all the way over the snow ridge. They separate at about 4 km in Figure 5 where the modelled flowline makes a curve whereas the GPR profile directly crosses it. As the ice flows from the small BIA to the firn area on the right side of the snow ridge in Figure 4, the layers dip more steeply, which is expected due to the lower surface velocity on that side of the ridge (Equation 1) and is also predicted by the flowline model of Reference Grinsted, Moore, Spikes and SinisaloGrinsted and others (2003).

Conclusions
The net surface mass balance in the Scharffenbergbotnen valley is about –215×103m3 a–1 which appears to be balanced by the inflow. The inflow through two gates and an icefall, together with accumulation along the valley side-walls, leads to four separate mass-balance areas in the valley that are delineated by moraine formations. The limited evidence indicates that the area is close to balance, in which case about 60 times more ice enters the valley from the northwestern entrance than via the narrow western gate.
The blue-ice surface age distribution was obtained by three methods: by dated GPR isochrones, by considering the geometry of the isochrones and by a flowline model. They give values of 3–10 years m–1 for the age gradient along a modelled flowline near the equilibrium line. The dated GPR isochrones give lower values (3–6 years m–1) than are found from the calculations based on the geometry and the flowline model which are consistent with each other. The discrepancy may be caused by different accumulation rates used in the flowline model and in the age calculation for the GPR horizons. Some of the assumptions made in the GPR data processing may also be responsible, although the extent of their combined impact is difficult to estimate. The equilibrium line may have migrated over time, though its impact is also hard to estimate and appears contrary to recent observation (Reference Spencer, Alley and CreytsSinisalo and others, 2003a).
The flowline model was originally designed for broader-scale dating of blue ice, but the comparison with observational data shows that it gives promising results even over small scales. Equation 1 can be used to make a first estimation of the surface age gradient of a BIA if the horizontal velocity and mass balance are known. Equations (3) and (4) can be used to estimate the ice velocity if GPR data over the outcropping isochrones are available and the mass-balance gradients are known.
Acknowledgements
We thank J. Vehviläinen for help in the field and for providing data, and R. Petterson for helping us to collect the old datasets. We also thank P. Jansson and an anonymous referee for useful comments. The Finnish Antarctic Research Programme (FINNARP) 1999–2001 provided field logistics. The work is funded by the Finnish Academy and the Thule Institute.


