


1 Introduction
An optically pumped atomic Rb vapor laser operating on the resonance at 795 nm, the diode-pumped alkali vapor laser (DPAL), was first realized by Krupke et al. in 2003[Reference Beach, Krupke, Kanz, Payne, Dubinskii and Merkle1]. It has many advantages, such as good beam quality with high laser power, higher energy conversion efficiency, and a reduced thermal effect. However, researchers noticed that an unavoidable drawback in DPAL hindered its development. The narrow linewidth of alkali atomic absorption ( ${\sim}0.02$
nm) means only few commercial semiconductor lasers can be chosen as effective pump sources for DPAL systems due to the spectrally resolved width of commercial laser diodes being on the order of magnitude of 1 nm[Reference Pitz, Fox and Perram2]. To address this issue, adding high-pressure helium, 19,000–38,000 Torr (1 Torr
${\sim}0.02$
nm) means only few commercial semiconductor lasers can be chosen as effective pump sources for DPAL systems due to the spectrally resolved width of commercial laser diodes being on the order of magnitude of 1 nm[Reference Pitz, Fox and Perram2]. To address this issue, adding high-pressure helium, 19,000–38,000 Torr (1 Torr $=133.32$
Pa), to broaden the linewidth was proposed by Krupke et al.
[Reference Krupke, Beach, Kanz and Payne3].
$=133.32$
Pa), to broaden the linewidth was proposed by Krupke et al.
[Reference Krupke, Beach, Kanz and Payne3].

Figure 1. Schematic diagram of the XPAL configuration.

Figure 2. Four-level system of XPAL.

Figure 3. Flow diagram of iterative operation.
In another approach, the exciplex pumped alkali laser (XPAL) system using heavier rare gases as collision partners to broaden the absorption spectrum[Reference Carroll, Palla and Verdeyen4] was proposed by Readle et al. in 2008[Reference Readle, Wagner, Verdeyen, Carroll and Eden5], which made use of optical pumping of Cs–Ar atomic collision pairs. In addition, two operating mechanisms for XPALs have also been demonstrated as four-level and five-level systems[Reference Readle, Wagner, Verdeyen, Carroll and Eden6–Reference Palla, Carroll, Verdeyen and Heaven10]. As a new type of laser, XPAL has attracted much attention and been under intensive development for the past decade. Palla and Carroll have conducted valuable theoretical studies on the dynamics of atomic binding and separation[Reference Palla, Carroll, Verdeyen, Readle, Spinka, Wagner, Eden and Heaven11], and proved a BLAZE-V model for describing mathematical calculations on the XPAL system. In their model, the theoretical performance of XPAL under CW operation has been predicted and analyzed[Reference Carroll and Verdeyen12]. Pan’s team carried out research on the significance of thermal effects on an operating XPAL system. The results showed that due to the high heat loading generated by multiple transitions, a sharp temperature gradient occurs in the cell, which may cause the experimental device to melt down and the stimulated emission to quench. Therefore, they introduced gas flow into the system to reduce the temperature gradient[Reference Xu, Shen, Xia and Pan13] and applied fluid methods to the CW XPAL system, with good simulation results being achieved[Reference Xu, Shen, Huang, Xia and Pan14]. In another approach, Yacoby et al. performed in-depth fluid dynamic studies of alkali vapor lasers with super-fast gas flows[Reference Yacoby, Waichman, Sadot, Barmashenko and Rosenwaks15, Reference Yacoby, Waichman, Sadot, Barmashenko and Rosenwaks16]. However, those systems all need nozzle devices to produce sonic-level gas flow.
In this paper, we establish a physical model to describe the time evolution of thermal dynamics and laser kinetics in a static pulsed XPAL system. The model is used to simulate and analyze the temporal behaviors of the temperature distribution and output power of a static XPAL system in the case of single long-time pulse pumping and multi-pulse pumping.
2 Description of model and kinetic processes
As shown in Figure 1, the alkali metal vapor cell has a length $L$
and a radius
$L$
and a radius $R$
, and the cavity is divided into small cuboids having a length, width and height of
$R$
, and the cavity is divided into small cuboids having a length, width and height of $\unicode[STIX]{x0394}x\times \unicode[STIX]{x0394}y\times \unicode[STIX]{x0394}z$
. The minimum scale for time evolution is
$\unicode[STIX]{x0394}x\times \unicode[STIX]{x0394}y\times \unicode[STIX]{x0394}z$
. The minimum scale for time evolution is $\unicode[STIX]{x0394}t$
.
$\unicode[STIX]{x0394}t$
.
The kinetic processes of XPALs are shown in Figure 2. To simplify the calculation, assumptions are made as follows.
(1) Only the four-level system is considered.
(2) In lasing emission, the equilibrium between Cs( $6^{2}\text{S}_{1/2}$
) and CsAr(
$\text{X}^{2}\unicode[STIX]{x03A3}_{1/2}^{+}$
), Cs(
$6^{2}\text{P}_{3/2}$
) and Cs-Ar(
$\text{B}^{2}\unicode[STIX]{x03A3}_{1/2}^{+}$
) remains stationary.
$6^{2}\text{S}_{1/2}$
) and CsAr(
$\text{X}^{2}\unicode[STIX]{x03A3}_{1/2}^{+}$
), Cs(
$6^{2}\text{P}_{3/2}$
) and Cs-Ar(
$\text{B}^{2}\unicode[STIX]{x03A3}_{1/2}^{+}$
) remains stationary.(3) The spontaneous radiation at the Cs*-Ar(
$\text{B}^{2}\unicode[STIX]{x03A3}_{1/2}^{+}$
) level is ignored.


Figure 4. Temperature and output laser power as functions of time in an XPAL under single long-time pulse pumping.
The rate equations at time $t$
in each volume element can be written as follows:
$t$
in each volume element can be written as follows:
 $$\begin{eqnarray}\displaystyle \displaystyle \frac{\text{d}n_{0}}{\text{d}t} & = & \displaystyle k_{10}n_{1}-k_{01}n_{0}[\text{Ar}]+\frac{n_{3}}{\unicode[STIX]{x1D70F}_{D1}}\nonumber\\ \displaystyle & & \displaystyle +\,(n_{3}-2n_{0})\unicode[STIX]{x1D70E}_{D1}\frac{f_{p}(P_{l}^{+}+P_{l}^{-})}{h\unicode[STIX]{x1D708}_{l}},\end{eqnarray}$$
 $$\begin{eqnarray}\displaystyle \displaystyle \frac{\text{d}n_{1}}{\text{d}t} & = & \displaystyle -k_{10}n_{1}+k_{01}n_{0}[\text{Ar}]\nonumber\\ \displaystyle & & \displaystyle -\,(n_{1}-n_{2})\int _{0}^{\infty }\frac{\unicode[STIX]{x1D70E}_{D2}(\unicode[STIX]{x1D708})P_{p}(\unicode[STIX]{x1D708})}{h\unicode[STIX]{x1D708}_{p}}\,\text{d}\unicode[STIX]{x1D708},\end{eqnarray}$$
 $$\begin{eqnarray}\displaystyle \displaystyle \frac{\text{d}n_{2}}{\text{d}t} & = & \displaystyle -k_{23}n_{2}+k_{32}n_{3}[\text{Ar}]\nonumber\\ \displaystyle & & \displaystyle +\,(n_{1}-n_{2})\int _{0}^{\infty }\frac{\unicode[STIX]{x1D70E}_{D2}(\unicode[STIX]{x1D708})P_{p}(\unicode[STIX]{x1D708})}{h\unicode[STIX]{x1D708}_{p}}\,\text{d}\unicode[STIX]{x1D708},\end{eqnarray}$$
 $$\begin{eqnarray}\displaystyle \displaystyle \frac{\text{d}n_{3}}{\text{d}t} & = & \displaystyle k_{23}n_{2}-k_{32}n_{3}[\text{Ar}]-\frac{n_{3}}{\unicode[STIX]{x1D70F}_{D1}}\nonumber\\ \displaystyle & & \displaystyle -\,(n_{3}-2n_{0})\unicode[STIX]{x1D70E}_{D1}\frac{f_{p}(P_{l}^{+}+P_{l}^{-})}{h\unicode[STIX]{x1D708}_{l}},\end{eqnarray}$$
 $$\begin{eqnarray}\displaystyle \displaystyle n_{\text{Cs}}\frac{T_{0}}{T} & = & \displaystyle n_{0}+n_{1}+n_{2}+n_{3},\end{eqnarray}$$
where $n_{0}$
,
$n_{0}$
, $n_{1}$
,
$n_{1}$
, $n_{2}$
and
$n_{2}$
and $n_{3}$
represent the number density of particles in the
$n_{3}$
represent the number density of particles in the $6^{2}\text{S}_{1/2}$
,
$6^{2}\text{S}_{1/2}$
, $\text{X}^{2}\unicode[STIX]{x03A3}_{1/2}^{+}$
,
$\text{X}^{2}\unicode[STIX]{x03A3}_{1/2}^{+}$
, $\text{B}^{2}\unicode[STIX]{x03A3}_{1/2}^{+}$
and
$\text{B}^{2}\unicode[STIX]{x03A3}_{1/2}^{+}$
and $6^{2}\text{P}_{3/2}$
energy levels of alkali atoms, respectively.
$6^{2}\text{P}_{3/2}$
energy levels of alkali atoms, respectively. $n_{\text{Cs}}$
denotes the total density of Cs vapor at a temperature of
$n_{\text{Cs}}$
denotes the total density of Cs vapor at a temperature of $T_{0}$
,
$T_{0}$
, $n_{\text{Cs}}=\frac{P_{\text{Cs}}}{k_{b}T_{0}}$
.
$n_{\text{Cs}}=\frac{P_{\text{Cs}}}{k_{b}T_{0}}$
. $k_{01}$
,
$k_{01}$
, $k_{10}$
,
$k_{10}$
, $k_{23}$
and
$k_{23}$
and $k_{32}$
are the thermal equilibrium constants between the energy levels[Reference Palla, Carroll, Verdeyen and Heaven10].
$k_{32}$
are the thermal equilibrium constants between the energy levels[Reference Palla, Carroll, Verdeyen and Heaven10]. $\unicode[STIX]{x1D70E}_{D1}$
is the lifetime of particle at the state of
$\unicode[STIX]{x1D70E}_{D1}$
is the lifetime of particle at the state of $6^{2}\text{P}_{3/2}$
.
$6^{2}\text{P}_{3/2}$
.

Figure 5. Schematic diagram of the temperature distribution in the cell after the pump light is turned on for 8 ms. $\unicode[STIX]{x1D70E}_{D2}$
represents the D2 line cross-section, assumed as a Lorentzian line type:
$\unicode[STIX]{x1D70E}_{D2}$
represents the D2 line cross-section, assumed as a Lorentzian line type:
 $$\begin{eqnarray}\unicode[STIX]{x1D70E}_{D2}(\unicode[STIX]{x1D708})=\unicode[STIX]{x1D70E}_{D2,0}\frac{(\unicode[STIX]{x0394}\unicode[STIX]{x1D708}_{\text{abs}}/2)^{2}}{(\unicode[STIX]{x1D708}-\unicode[STIX]{x1D708}_{\text{abs}})^{2}+(\unicode[STIX]{x0394}\unicode[STIX]{x1D708}_{\text{abs}}/2)^{2}},\end{eqnarray}$$
where $\unicode[STIX]{x1D708}_{\text{abs}}$
and
$\unicode[STIX]{x1D708}_{\text{abs}}$
and $\unicode[STIX]{x0394}\unicode[STIX]{x1D708}_{\text{abs}}$
are the center frequency of absorption and the linewidth, respectively.
$\unicode[STIX]{x0394}\unicode[STIX]{x1D708}_{\text{abs}}$
are the center frequency of absorption and the linewidth, respectively. $\unicode[STIX]{x1D70E}_{D2,0}$
denotes the pump beam cross-section, determined by the equilibrium function
$\unicode[STIX]{x1D70E}_{D2,0}$
denotes the pump beam cross-section, determined by the equilibrium function $f_{10}$
and the reduced absorption coefficient
$f_{10}$
and the reduced absorption coefficient $k_{\text{abs}}$
:
$k_{\text{abs}}$
:
 $$\begin{eqnarray}\unicode[STIX]{x1D70E}_{D2,0}=k_{\text{abs}}\frac{[\text{Ar}]}{f_{10}}=\frac{g_{0}}{g_{1}}\frac{k_{\text{abs}}}{4\unicode[STIX]{x1D70B}R_{0}^{2}\unicode[STIX]{x0394}R\exp (-\unicode[STIX]{x0394}E_{10}/k_{b}T)},\end{eqnarray}$$
where $R_{0}$
is the internuclear distance and
$R_{0}$
is the internuclear distance and $\unicode[STIX]{x0394}R$
is the range.
$\unicode[STIX]{x0394}R$
is the range. $\unicode[STIX]{x0394}E_{10}$
denotes the energy difference between the states
$\unicode[STIX]{x0394}E_{10}$
denotes the energy difference between the states $6^{2}\text{S}_{1/2}$
and
$6^{2}\text{S}_{1/2}$
and $\text{X}^{2}\unicode[STIX]{x03A3}_{1/2}^{+}$
.
$\text{X}^{2}\unicode[STIX]{x03A3}_{1/2}^{+}$
.
Both pump light and laser lines are assumed as Gaussian profiles described by the following expression:
 $$\begin{eqnarray}f_{p,l}(x,y,z)=\frac{c_{2}}{\unicode[STIX]{x1D70B}w_{p,l}(z)^{2}}\exp \left\{-c_{2}\left[\frac{x^{2}+y^{2}}{w_{p,l}(z)^{2}}\right]\right\},\end{eqnarray}$$
where $f_{p}(x,y,z)$
and
$f_{p}(x,y,z)$
and $f_{l}(x,y,z)$
represent the relative intensity of the pump and laser beams at the point
$f_{l}(x,y,z)$
represent the relative intensity of the pump and laser beams at the point $(x,y,z)$
.
$(x,y,z)$
. $c_{2}$
is the Gaussian coefficient.
$c_{2}$
is the Gaussian coefficient. $w_{p}(z)$
and
$w_{p}(z)$
and $w_{l}(z)$
are the radii of the pump and laser beams on the
$w_{l}(z)$
are the radii of the pump and laser beams on the $x$
–
$x$
– $y$
plane:
$y$
plane:
 $$\begin{eqnarray}w_{p,l}(z)=w_{0,p,l}\sqrt{\left[\frac{(z-z_{0})c_{p,l}l_{p,l}}{pw_{0,p,l}}\right]^{2}+1},\end{eqnarray}$$
where $w_{0,p,l}$
and
$w_{0,p,l}$
and $z_{0,p,l}$
denote the waists and coordinates on the
$z_{0,p,l}$
denote the waists and coordinates on the $z$
axis of the pump and laser beams, respectively.
$z$
axis of the pump and laser beams, respectively. $c_{p,l}$
is the geometrical optical coefficients.
$c_{p,l}$
is the geometrical optical coefficients.

Figure 6. (a) Relationship between the output laser power and time under different initial temperature conditions; (b) peak optical–optical efficiency of laser at different initial temperatures.
The initial pump beam is described by a Gaussian line shape:
 $$\begin{eqnarray}P_{p}=P_{p,0}\frac{2}{\unicode[STIX]{x1D708}_{p}}\sqrt{\frac{\ln 2}{\unicode[STIX]{x1D70B}}}\exp \left[-4\ln 2\frac{(\unicode[STIX]{x1D708}-\unicode[STIX]{x1D708}_{p})^{2}}{\unicode[STIX]{x0394}\unicode[STIX]{x1D708}_{p}^{2}}\right],\end{eqnarray}$$
where $\unicode[STIX]{x1D708}_{p}$
and
$\unicode[STIX]{x1D708}_{p}$
and $\unicode[STIX]{x0394}\unicode[STIX]{x1D708}_{p}$
are the central frequency and the FWHM of the pump beam, respectively.
$\unicode[STIX]{x0394}\unicode[STIX]{x1D708}_{p}$
are the central frequency and the FWHM of the pump beam, respectively. $P_{p,0}$
denotes the pumping power in total.
$P_{p,0}$
denotes the pumping power in total.
The propagations of the laser and pump light along the $z$
axis are described by the following iterative equations:
$z$
axis are described by the following iterative equations:
 $$\begin{eqnarray}\displaystyle \displaystyle P_{p}(z+\unicode[STIX]{x0394}z) & = & \displaystyle P_{p}(z)\mathop{\sum }_{-R\leqslant x,y\leqslant R}f_{p}(x,y,z)\nonumber\\ \displaystyle & & \displaystyle \times \exp [-(n_{1}-n_{2})\unicode[STIX]{x1D70E}_{D2}(\unicode[STIX]{x1D708})\unicode[STIX]{x0394}z]\unicode[STIX]{x0394}x\unicode[STIX]{x0394}y,\qquad\end{eqnarray}$$
 $$\begin{eqnarray}\displaystyle \displaystyle P_{l}^{\pm }(z+\unicode[STIX]{x0394}z) & = & \displaystyle P_{l}^{\pm }(z)\mathop{\sum }_{-R\leqslant x,y\leqslant R}f_{l}(x,y,z)\nonumber\\ \displaystyle & & \displaystyle \times \exp [-(n_{3}-2n_{0})\unicode[STIX]{x1D70E}_{D1}\unicode[STIX]{x0394}z]\unicode[STIX]{x0394}x\unicode[STIX]{x0394}y.\end{eqnarray}$$
The initial boundary conditions of $P_{l}^{+}$
and
$P_{l}^{+}$
and $P_{l}^{-}$
at
$P_{l}^{-}$
at $z=0$
are given by
$z=0$
are given by
 $$\begin{eqnarray}\displaystyle & \displaystyle P_{l}^{-}(0)=P_{l}/[T_{l}(1-R_{oc})], & \displaystyle\end{eqnarray}$$
 $$\begin{eqnarray}\displaystyle & \displaystyle P_{l}^{+}(0)=P_{l}T_{l}R_{oc}/(1-R_{oc}). & \displaystyle\end{eqnarray}$$
To calculate the output power of laser, we first assume a laser output power value and then substitute it into the initial equation for iterative operation. If the boundary equation $P_{l}^{-}(l)=P_{l}^{+}(l)T_{l}^{2}T_{s}^{2}R_{p}$
at
$P_{l}^{-}(l)=P_{l}^{+}(l)T_{l}^{2}T_{s}^{2}R_{p}$
at $z=l$
is satisfied, the correct output laser power is obtained, where
$z=l$
is satisfied, the correct output laser power is obtained, where $R_{oc}$
and
$R_{oc}$
and $R_{p}$
are the reflectivity of the output coupler and the back reflector.
$R_{p}$
are the reflectivity of the output coupler and the back reflector. $T_{l}$
is the single-pass cell window transmission and
$T_{l}$
is the single-pass cell window transmission and $T_{s}$
is the intra-cavity single-pass loss.
$T_{s}$
is the intra-cavity single-pass loss.
2.1 Calculation of three-dimensional heat conduction and temperature distribution
The thermal conduction equation given in Ref. [Reference Landau and Lifshitz17] is
 $$\begin{eqnarray}c_{p}\unicode[STIX]{x1D70C}\frac{\unicode[STIX]{x2202}T}{\unicode[STIX]{x2202}t}=K\unicode[STIX]{x0394}T+Q,\end{eqnarray}$$
where $K$
,
$K$
, $c_{p}$
and
$c_{p}$
and $\unicode[STIX]{x1D70C}$
are the coefficient of thermal conductivity, the specific heat and the mass density, respectively.
$\unicode[STIX]{x1D70C}$
are the coefficient of thermal conductivity, the specific heat and the mass density, respectively. $Q$
is the volume density of the generated heat power. In a gravitational field, the currents occurring inside due to the absence of mechanical equilibrium caused by the temperature gradient in the gain medium are called free convection. For the pulsed laser, the convection speed
$Q$
is the volume density of the generated heat power. In a gravitational field, the currents occurring inside due to the absence of mechanical equilibrium caused by the temperature gradient in the gain medium are called free convection. For the pulsed laser, the convection speed $\unicode[STIX]{x1D710}$
is negligibly small on a time scale of the millisecond level during the temperature rise, so it is ignored in the equation. Equation (15) is expanded in the Cartesian coordinate system as
$\unicode[STIX]{x1D710}$
is negligibly small on a time scale of the millisecond level during the temperature rise, so it is ignored in the equation. Equation (15) is expanded in the Cartesian coordinate system as
 $$\begin{eqnarray}c_{p}\unicode[STIX]{x1D70C}\frac{\unicode[STIX]{x2202}T}{\unicode[STIX]{x2202}t}=K\left(\frac{\unicode[STIX]{x2202}^{2}T}{\unicode[STIX]{x2202}x^{2}}+\frac{\unicode[STIX]{x2202}^{2}T}{\unicode[STIX]{x2202}y^{2}}+\frac{\unicode[STIX]{x2202}^{2}T}{\unicode[STIX]{x2202}z^{2}}\right)+Q(x,y,z,t).\end{eqnarray}$$
In the equation, we denote $T(x,y,z,t)$
as
$T(x,y,z,t)$
as $T_{i,j,k}^{t}$
and introduce
$T_{i,j,k}^{t}$
and introduce
 $$\begin{eqnarray}\left\{\begin{array}{@{}l@{}}\displaystyle \frac{\unicode[STIX]{x2202}T}{\unicode[STIX]{x2202}t}=\frac{T_{i,j,k}^{t+1}-T_{i,j,k}^{t}}{\unicode[STIX]{x0394}t},\\ \displaystyle \frac{\unicode[STIX]{x2202}^{2}T}{\unicode[STIX]{x2202}x^{2}}=\frac{T_{i+1,j,k}^{t}-2T_{i,j,k}^{t}+T_{i-1,j,k}^{t}}{\unicode[STIX]{x0394}x^{2}},\\ \displaystyle \frac{\unicode[STIX]{x2202}^{2}T}{\unicode[STIX]{x2202}y^{2}}=\frac{T_{i,j+1,k}^{t}-2T_{i,j,k}^{t}+T_{i,j-1,k}^{t}}{\unicode[STIX]{x0394}y^{2}},\\ \displaystyle \frac{\unicode[STIX]{x2202}^{2}T}{\unicode[STIX]{x2202}z^{2}}=\frac{T_{i,j,k+1}^{t}-2T_{i,j,k}^{t}+T_{i,j,k-1}^{t}}{\unicode[STIX]{x0394}z^{2}}.\end{array}\right.\end{eqnarray}$$
Substituting the above equation into Equation (16), the temperature recursion formula is given by
 $$\begin{eqnarray}\displaystyle T_{i,j,k}^{t+1} & = & \displaystyle (1-4\unicode[STIX]{x1D6FC}-2\unicode[STIX]{x1D6FD})T_{i,j,k}^{t}+\frac{\unicode[STIX]{x0394}t}{c_{p}\unicode[STIX]{x1D70C}}Q_{i,j,k}^{t}\nonumber\\ \displaystyle & & \displaystyle +\,\unicode[STIX]{x1D6FD}(T_{i,j,k+1}^{t}+T_{i,j,k-1}^{t})\nonumber\\ \displaystyle & & \displaystyle +\,\unicode[STIX]{x1D6FC}(T_{i+1,j,k}^{t}+T_{i-1,j,k}^{t}+T_{i,j+1,k}^{t}+T_{i,j-1,k}^{t}).\qquad\end{eqnarray}$$
In the equation, $\unicode[STIX]{x1D6FD}=\unicode[STIX]{x1D6FE}\unicode[STIX]{x0394}t/\unicode[STIX]{x0394}z^{2}$
,
$\unicode[STIX]{x1D6FD}=\unicode[STIX]{x1D6FE}\unicode[STIX]{x0394}t/\unicode[STIX]{x0394}z^{2}$
, $\unicode[STIX]{x1D6FC}=\unicode[STIX]{x1D6FE}\unicode[STIX]{x0394}t/\unicode[STIX]{x0394}x^{2}$
, and
$\unicode[STIX]{x1D6FC}=\unicode[STIX]{x1D6FE}\unicode[STIX]{x0394}t/\unicode[STIX]{x0394}x^{2}$
, and $\unicode[STIX]{x1D6FE}=K/c_{p}\unicode[STIX]{x1D70C}$
, in which
$\unicode[STIX]{x1D6FE}=K/c_{p}\unicode[STIX]{x1D70C}$
, in which $\unicode[STIX]{x1D6FE}$
is the thermal diffusivity.
$\unicode[STIX]{x1D6FE}$
is the thermal diffusivity.

Figure 7. Power and temperature as functions of time in a multi-pulse XPAL with a rectangular shape pump light. (a) Turn on the pump light again when the temperature rise drops to $1/3$
of its maximum; (b) turn on the pump light again when the temperature rise drops to
$1/3$
of its maximum; (b) turn on the pump light again when the temperature rise drops to $1/2.5$
of its maximum; (c) turn on the pump light again when the temperature rise drops to
$1/2.5$
of its maximum; (c) turn on the pump light again when the temperature rise drops to $1/2$
of its maximum.
$1/2$
of its maximum.

Figure 8. Graphical representation of the data in Table 2.
To improve the calculating speed with acceptable precision, the following conditions should be satisfied:
(1) the stability condition of the explicit difference scheme is
$1-4\unicode[STIX]{x1D6FC}-2\unicode[STIX]{x1D6FD}>0$
;(2) the cross-section includes
${>}99\%$
of the pump and laser energy;(3) the parameters
$\unicode[STIX]{x0394}x$
,
$\unicode[STIX]{x0394}y$
,
$\unicode[STIX]{x0394}z$
and
$\unicode[STIX]{x0394}t$
should be adjusted to increase the iteration rate under conditions (1) and (2).


 $Q_{i,j,k}^{t}$
is the heat generated by each volume element at time
$Q_{i,j,k}^{t}$
is the heat generated by each volume element at time $t$
, given by
$t$
, given by
 $$\begin{eqnarray}\displaystyle Q_{i,j,k}^{t} & = & \displaystyle (k_{01}n_{0_{i},j,k}^{t}[\text{Ar}]-k_{10}n_{1_{i},j,k}^{t})\unicode[STIX]{x0394}E_{10}\nonumber\\ \displaystyle & & \displaystyle +\,(-k_{32}n_{3_{i},j,k}^{t}[\text{Ar}]+k_{23}n_{2_{i},j,k}^{t})\unicode[STIX]{x0394}E_{23}.\qquad\end{eqnarray}$$ $c_{p}$
and
$c_{p}$
and $\unicode[STIX]{x1D70C}$
are described by
$\unicode[STIX]{x1D70C}$
are described by
 $$\begin{eqnarray}c_{p}\unicode[STIX]{x1D70C}=\frac{c_{p-\text{Ar}}n_{\text{Ar}}}{N_{A}},\end{eqnarray}$$
where $c_{p-\text{Ar}}=20.802-0.011/300\times (T-400)$
[18].
$c_{p-\text{Ar}}=20.802-0.011/300\times (T-400)$
[18]. $N_{A}$
is the Avogadro constant.
$N_{A}$
is the Avogadro constant.
The iterative calculating flow chart is shown in Figure 3.
As shown in the figure, the evolution of the temperature distribution and laser power over time can be obtained by multiple iterative loops. Table 1 lists some parameters related to the calculations of our model.
Table 1. Parameters in the simulation.

3 Results and discussion
In the XPAL system, heat production is always an important aspect. The heat generated by quantum defects and quenching results in a fluctuation of the atom density distribution, which can further influence the output laser power. Figure 4 plots the temporal behaviors of output laser power and central temperature in an XPAL with $T_{0}=410$
K and
$T_{0}=410$
K and $P_{p}=44272$
W. As shown in Figure 4, in the case of 5 ms pulse pumping, the temperature rises with time from 410.0 K to 791.1 K, while the output laser power drops from 21.45 W to 3.97 W. Hence, we consider that the accumulation of heat loading has a significant influence on the laser output power.
$P_{p}=44272$
W. As shown in Figure 4, in the case of 5 ms pulse pumping, the temperature rises with time from 410.0 K to 791.1 K, while the output laser power drops from 21.45 W to 3.97 W. Hence, we consider that the accumulation of heat loading has a significant influence on the laser output power.
After the pump light is turned on for 8 ms with the initial temperature $T_{0}=410$
K, the temperature distribution in the cell is as shown in Figure 5. It is obvious that the heat is concentrated in the center of the cell and diffuses in a ring shape. Its center has a maximum temperature of 914.11 K.
$T_{0}=410$
K, the temperature distribution in the cell is as shown in Figure 5. It is obvious that the heat is concentrated in the center of the cell and diffuses in a ring shape. Its center has a maximum temperature of 914.11 K.
Figure 6(a) shows the dependence of output power on time at different initial temperatures after pumping is turned on. As can be seen from the figure, the higher the initial temperature is, the faster the laser power decreases. In the cases of 410, 420, 430, 440 and 450 K, the time taken for the laser power to drop to $1/2$
of its initial value is 1.87, 1.12, 0.67, 0.45 and 0.32 ms, respectively. In addition, the optical-to-optical efficiencies at different temperatures are shown in Figure 6(b). Combining Figures 6(a) and 6(b), we find that a higher initial temperature can increase the initial output laser power, but lead to a quicker termination of lasing in static operation. Therefore, to obtain a higher laser output power and a more reasonable operating mode, we calculate the laser output power of a multi-pulse XPAL in static operation for different thermal relaxation times and initial temperatures.
$1/2$
of its initial value is 1.87, 1.12, 0.67, 0.45 and 0.32 ms, respectively. In addition, the optical-to-optical efficiencies at different temperatures are shown in Figure 6(b). Combining Figures 6(a) and 6(b), we find that a higher initial temperature can increase the initial output laser power, but lead to a quicker termination of lasing in static operation. Therefore, to obtain a higher laser output power and a more reasonable operating mode, we calculate the laser output power of a multi-pulse XPAL in static operation for different thermal relaxation times and initial temperatures.
As the pump signal is assumed to be an ideal rectangular shape, the relationship between laser power and maximum temperature rise over time is shown in Figure 7. The multi-pulse pumped XPAL operating mode is as follows: when the laser power drops to $1/2$
of the first peak value, the pump light is turned off; when the temperature rise drops to
$1/2$
of the first peak value, the pump light is turned off; when the temperature rise drops to $1/3$
,
$1/3$
, $1/2.5$
or
$1/2.5$
or $1/2$
of its maximum value, the pumping is turned on again. Here, we define the recovery coefficient as the ratio of the second laser pulse peak to the first laser pulse peak. The specific parameters in Figure 7 are listed in Table 2.
$1/2$
of its maximum value, the pumping is turned on again. Here, we define the recovery coefficient as the ratio of the second laser pulse peak to the first laser pulse peak. The specific parameters in Figure 7 are listed in Table 2.
Table 2. Data for the multi-pulse XPAL at $T_{0}=410$
K in Figure 7.
$T_{0}=410$
K in Figure 7.


Figure 9. Power and temperature as functions of time in a multi-pulse XPAL with different initial temperatures. All the pump light is turned on again when the temperature rise drops to $1/2$
of its maximum. (a)
$1/2$
of its maximum. (a) $T_{0}=410$
K; (b)
$T_{0}=410$
K; (b) $T_{0}=420$
K; (c)
$T_{0}=420$
K; (c) $T_{0}=430$
K; (d)
$T_{0}=430$
K; (d) $T_{0}=440$
K.
$T_{0}=440$
K.
One can see from Figures 7 and 8 that increasing the thermal relaxation time causes a wider linewidth of the laser pulse (except the first pulse) and a higher peak value in the second laser pulse (recovery coefficient), further causing a higher power of laser on average (shown in Figure 8). Nevertheless, shortening the heat relaxation time can enhance the pulse repetition frequency, thereby increasing the total energy of the laser output. The laser repetition frequencies in Figure 7 are all large enough ( ${>}100$
Hz) to realize quasi-continuous-wave (QCW) pumping.
${>}100$
Hz) to realize quasi-continuous-wave (QCW) pumping.
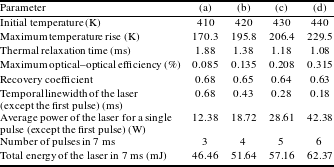
In Figure 9, we introduce different initial temperatures ( $T_{0}=420,430,440$
K) to compare with
$T_{0}=420,430,440$
K) to compare with $T_{0}=410$
K. The pump signal is still supposed to be an ideal rectangular shape. Switching of the pump is as mentioned above, but all the pump lights are ignited when the temperature rise drops to
$T_{0}=410$
K. The pump signal is still supposed to be an ideal rectangular shape. Switching of the pump is as mentioned above, but all the pump lights are ignited when the temperature rise drops to $1/2$
of its maximum. The specific parameters in the figure are listed in Table 3.
$1/2$
of its maximum. The specific parameters in the figure are listed in Table 3.
Table 3. Data for the multi-pulse XPAL with different $T_{0}$
in Figure 9.
$T_{0}$
in Figure 9.


Figure 10. Graphical representation of the data in Table 3.
As shown in Figure 10(a), a higher initial temperature results in a faster temperature rise and more severe thermal effects, so that a lower recovery coefficient is obtained. However, a higher maximum temperature means a greater temperature gradient, which causes a shorter relaxation time and a higher repetition rate (all repetition rates exceed 100 Hz). Figure 10(b) demonstrates that although the recovery coefficient would be reduced when the initial temperature increases, the increase of initial temperature has a greater influence on the absolute output value of the laser power (as can be seen from the optical–optical efficiency), so that the average power increases as the initial temperature increases, which also accounts for the rise in total output laser energy. In short, higher average output power and total output energy can be obtained by increasing the initial operating temperature.
4 Conclusion
By combining the rate equations, the power propagation equations and the thermal conduction equations, we construct a time evolution model of the laser power and temperature distribution in a pulsed XPAL. Time evolutions of the laser power and temperature distribution in static XPALs with long-pulse pumping and multi-pulse pumping were calculated and analyzed. For long-pulse pumping, calculation results demonstrate that the initial laser power increases with a rise in the initial temperature, but drops faster with temperature due to greater heat accumulation. For multi-pulse XPAL, with the same initial temperature, if we increase the repetition rate appropriately (turn on the pump light again when the temperature rise drops to $1/2$
of its maximum rather than
$1/2$
of its maximum rather than $1/2.5$
or
$1/2.5$
or $1/3$
), a higher output energy could be obtained. In another way, by increasing the initial temperature we could get a higher initial laser power and a shorter thermal relaxation time, which means a higher laser average power and output energy. The repetition frequencies in these calculations are all large enough to achieve QCW laser pulses. These calculation results can provide an effective way to design an efficient multi-pulse XPAL for experiments.
$1/3$
), a higher output energy could be obtained. In another way, by increasing the initial temperature we could get a higher initial laser power and a shorter thermal relaxation time, which means a higher laser average power and output energy. The repetition frequencies in these calculations are all large enough to achieve QCW laser pulses. These calculation results can provide an effective way to design an efficient multi-pulse XPAL for experiments.
Acknowledgements
This work was supported by the Aerospace Science and Technology Foundation (No. KM20170269).


 Open access