


I. INTRODUCTION
The successful development and implementation of a pure metallic lithium anode is among the holy grails of energy storage devices. Among the obstacles to overcome in realizing this technology is eliminating the formation and growth of lithium dendrites originating at the interface between the Li anode and the solid electrolyte (SE) separator. To that end, it has become a common practice to inhibit dendrite growth through the separator by utilizing high modulus ceramic separators and imposing an external stack pressure that acts normal to the interface and is higher in magnitude than the yield strength of bulk polycrystalline Li.Reference Yu, Schmidt, Garcia-Mendez, Herbert, Dudney, Wolfenstine and Siegel1,Reference Cheng, Sharafi and Sakamoto2 For reasons that are not well understood, this practice has only met with limited success in improving performance and prolonging cycle life. The scientific community is, therefore, striving to develop a more complete understanding of the complex coupling between device performance and the mechanical properties of both Li and the SE separator.
Motivated by the need to better understand the small-scale mechanical behavior at the Li/SE interface, nanoindentation experiments have been performed on high-purity 5 and 18 μm thick vapor deposited polycrystalline Li films to ascertain how the properties of Li change as a function of length scale and strain rate at 31 °C (homologous temperature, T H, of 0.67). To indentation depths of ∼1 μm, the results showcase the high elastic anisotropy of Li and, despite the high T H, the length scale and strain rate dependent ability of Li to support stresses ranging from ∼22 to 320 times larger than the yield stress of bulk polycrystalline Li (∼0.5 MPa at 298 K). A mechanistic rationalization of the data leads to three natural breaks in the analysis and interpretation based on the physical modes of indentation deformation observed. The first topic, and the subject of this paper, is the elastic modulus of vapor deposited Li as a function of film thickness. The second and third topics are addressed in subsequent publications.Reference Herbert, Hackney, Dudney, Thole and Phani3,Reference Herbert, Hackney, Dudney, Thole and Phani4 Topic two utilizes slightly modified forms of the Nabarro–Herring and Harper–Dorn creep mechanisms to rationalize length scale and strain-rate dependent diffusion-mediated flow. Topic three provides a mechanistic rationalization of the transition from diffusion to dislocation-mediated flow using a hypothesized cumulative probability density function for the activation of a Frank–Read source. Collectively, the outcome of this work is a more complete understanding of the mechanical behavior of Li just above room temperature and at length scales commensurate with defects (e.g., scratches, cracks, pores, and grain boundaries) at the interface between the Li and SE separator.
The direct implication for the design of next generation energy storage devices is that electrochemical deposition and growth of Li into small-scale defects at the Li/SE interface can result in mode I stress intensification that is significantly higher than nominally expected based on the yield strength of bulk, polycrystalline Li. In a manner that depends on the strain rate, which is presumably analogous to current density, the stress intensification could readily lead to localized mechanical failure at the Li/SE interface and the subsequent formation of Li dendrites into the breach, whether it is a pore, microcrack, or grain boundary.Reference Cheng, Sharafi and Sakamoto2
The elastic modulus of 5 and 18 μm thick vapor deposited polycrystalline Li films, measured here for the first time using nanoindentation, indicates the film surfaces may be predominantly comprised of grains with (hkl) planes near (111) and (100), respectively. After accounting for the substrate effect, the modulus of the Li film is found to be predominantly depth independent to a maximum depth corresponding to 22% of the film thickness. Under the deposition and testing conditions utilized here, the oxide contamination layer on the Li surface is found to be sufficiently thin such that its contribution to the measured properties, if any, is negligible. Near the free surface of the film, the ability of Li to dissipate mechanical energy is potentially found to vary with indentation depth and strain rate. This unique observation may provide direct insight into the subsurface defect structure of the Li film. Simple analysis procedures and metrics are used to identify and avoid potential sources of experimental error that could lead to misinterpretation and erroneous conclusions.
II. EXPERIMENTAL METHODS
A. Preparation of high-purity lithium films on glass substrates
Thin film Li was deposited from vapor in a dedicated high vacuum chamber (base pressure 1 × 10⁻⁹ torr) using a thermal evaporation source. Approximately 1 g of high-purity Li ribbon (Alfa Aesar no. 10769, 99.9%, 19 × 0.75 mm in thickness; Alfa Aesar, Haverhill, Massachusetts) is wound to fill a cylindrical Ta crucible and heated to achieve the desired deposition rate as measured by a quartz crystal microbalance positioned 15 cm from the top of the crucible. Glass substrates (75 × 25 × 1 mm) were also positioned 15 cm above the evaporation source. New Li was melted to remove much of the reaction products on the surface prior to deposition of the experimental films. Deposition was initiated at rates between 1 and 3 nm/s to achieve 10 mm diameter films ranging in thicknesses from 5 to 18 µm. Samples were cooled for at least 2 h under vacuum before being transferred into an adjacent high-purity Ar glove box. The film quality and grain size were determined by the base pressure, deposition rate, and film thickness. Once inside the glove box, glass cover slips were placed directly on top of the films to inhibit further contamination of the surface. Immediately prior to testing, the cover slips were removed by placing a razor blade between the cover slip and substrate. No transference of Li to the cover slip or evidence of damage to the film was observed. As discussed below, this unexpected outcome is possibly due to the presence of a thin (≤∼10 nm) oxide layer that likely formed on the surface as soon as the films were transferred from the deposition chamber to the glove box. To maximize the nanoindentation system’s frame stiffness, the substrates were cut into ∼12 × 25 mm sections and rigidly mounted to aluminum specimen holders using a thin layer of 5 min epoxy.
B. Nanoindentation
Nanoindentation experiments and optical microscopy were performed inside the continuously controlled atmosphere of a dedicated, ultra high-purity (UHP) Ar glove box (Inert, Amesbury, MA), which consists of a positive pressure (1–4 mbar) of UHP Ar (99.999%) and sustained H2O and O2 levels less than 0.1 ppm. The box’s internal temperature was recorded in two-minute intervals using an OM-PLT2 data logger (Omega Engineering, Norwalk, CT). Its reported accuracy and resolution are ±0.5 and 0.05 °C, respectively. Over the course of this investigation, the average temperature inside the box was approximately 31 ± 3 °C. The nanoindentation experiments were performed during intervals when the thermal stability of the box was within ±0.5 °C for a period of at least 6 h prior to testing.
Mechanical vibrations from sources such as, but not limited to, the glove box vacuum pump and blower were attenuated by a 250BM-1 isolator (Minus K Technology, Inglewood, California). The isolator platform supports a steel ballast plate, the nanoindentation system, manual x–y linear stages, and goniometer (Newport, Irvine, California), and a BXFM metallurgical light microscope mounted on a universal boom stand (Olympus, Center Valley, Pennsylvania). The microscope is configured with Olympus’ Stream Start software version 1.9.4, Nomarski optics, a DP22 digital color camera, and 4 oil immersion objectives (10, 20, 50, and 100×). The optical system enables analysis of residual hardness impressions, post-test surface morphology, and potential surface contaminants. Coupled with the micropositioners described below, the optics system also facilitates precision targeting of microstructural features such as individual grains and grain boundaries to within ±0.5 μm.
The nanoindentation experiments were performed using a diamond Berkovich indenter tip and the Nano Flip, a universal nanomechanical in situ testing platform that utilizes the InForce 50 electromagnetic actuator and capacitive displacement sensor (Nanomechanics, Inc., Oak Ridge, Tennessee). Inside the continuously circulating atmosphere of the glove box, the noise floor on the measured displacement signal with a 20 μs time constant is approximately ±0.75 nm (roughly double the noise floor outside the glove box). The system’s high-speed controller, interfaced through the software InView (version 1.5.420.0), utilizes a closed loop CPU control rate of 1 kHz (1 ms) and a maximum data acquisition rate of 100 kHz. The system’s mass, stiffness, damping coefficient, and load frame stiffness (quasi-static and dynamic) are approximately 200 mg, 200 N/m, 0.1 Ns/m, and 9.6 × 10⁵ N/m, respectively. The Nano Flip platform, which is comprised of the InForce 50 actuator and test specimen positioning system, is mounted to the aforementioned linear x–y stages and goniometer (both are unique to the glove box configuration). The test specimen’s x–y positioning and the macroscopic normal motion of the actuator are controlled by 3 piezo micropositioners, 2 mounted directly underneath the test specimen and 1 mounted directly below the actuator. Equipped with optical encoders and closed loop control, the micropositioners provide a minimum step size of 10 nm, 20 mm of travel, and an axial stiffness >1 × 10⁶ N/m.
C. Determination of the elastic modulus
Details of the methods and analysis procedures used to determine the elastic modulus, E, from nanoindentation have been thoroughly addressed elsewhere and will not be revisited here.Reference Oliver and Pharr5–Reference Pharr and Bolshakov10 Instead, we provide a brief summary of the models used in the analysis, values of their respective constants, and, most importantly, the experimental conditions under which measurements in Li result in accurate estimates of E. In this work, E is determined using the widely adopted methods and analysis procedures put forth by Oliver and Pharr.Reference Oliver and Pharr5,Reference Oliver and Pharr6 As such, E is determined through the universal stiffness relation,
 $${E_{\rm{r}}} = {{\sqrt \pi } \over 2}{1 \over \beta }{S \over {\sqrt A }}\quad ,$$
which relates the elastic contact stiffness, S, and the projected contact area, A, to E through β, which is a geometric constant that depends on the geometry of the indenter (1 ≤ β ≤ 1.05 for a Berkovich, taken to be 1.0 in this work) and E r, which is the reduced or effective elastic modulus given by
 $${E_{\rm{r}}} = {\left( {{{1 - {\nu _{\rm{i}}}^2} \over {{E_{\rm{i}}}}} + {{1 - {\nu ^2}} \over E}} \right)^{ - 1}}\quad ,$$
where νi and E i are Poisson’s ratio and the elastic modulus of the indenter, respectively, and ν is Poisson’s ratio of the test specimen.Reference Oliver and Pharr5–Reference Pharr, Oliver and Brotzen9 A commonly used mathematical relationship between A and the contact depth, h c, and the one utilized in this investigation, is given by
 $$A = C{h_{\rm{c}}}^2 + \sum\limits_{n = 0}^4 {{C_n}{h_{\rm{c}}}^{\left( {1{\rm{/}}{2^n}} \right)}} \quad ,$$
where C in this work is the measured lead term of the indenter tip and the constants C 0 through C 4 were empirically determined from curve fitting procedures applied to experimental data obtained from the standard reference material fused silica.Reference Oliver and Pharr5,Reference Oliver and Pharr6 Here, we use the Oliver–Pharr model to determine h c and note the geometric constant ε was taken to be 0.75 for the Berkovich indenter.Reference Oliver and Pharr5,Reference Oliver and Pharr6 In adopting the Oliver–Pharr model, we recognize this inherently assumes that the contact geometry is accurately modeled by elastic sink-in rather than pile-up or upward plastic flow around the faces of the indenter. While the extremely high modulus to yield strength ratio of Li (E/σy ∼ 16,000) suggests pile-up is likely, the absence of knowledge about its ability to work harden, which inhibits pile-up, makes it extremely difficult to predict a priori. The problem this poses is that pile-up cannot be accounted for using the Oliver–Pharr model and, in extreme cases, it can cause E to be overestimated by as much as 30%.Reference Hay and Pharr8 Accurate estimates of E, therefore, require thorough examination of the residual hardness impressions for any characteristic evidence of pile-up.
The extremely high E/σy ratio of Li and its strong propensity to creep near room temperature can also make it difficult to accurately implement the two most commonly used methods to determine S, the slope of the unloading curve evaluated at the maximum depth and the continuous stiffness measurement technique.Reference Herbert, Phani and Johanns11–Reference Merle, Maier-Kiener and Pharr13 The fundamental problem for both methods is that the deformation is dominated by time-dependent plasticity, which makes it difficult to generate data that are consistent with the requisite assumptions of the elastic analysis models applied to the data. Here we have chosen to use the continuous stiffness measurement technique for the reasons described below.
Despite its apparent simplicity, evaluating the slope of the unloading curve at the maximum depth and ensuring the data are predominantly representative of elastic deformation is difficult, particularly in the case of Li. As proposed by Ngan and Tang,Reference Ngan and Tang14 Feng and Ngan,Reference Feng and Ngan15 and separately by Cheng et al.,Reference Cheng, Ni and Cheng16,Reference Cheng, Ni and Cheng17 coupling sufficient hold times and fast unloading rates can be used to effectively mitigate nonelastic contributions during the unload, but only under conditions in which the product of the indenter tip velocity and the displacement measurement time constant is a small fraction of the depth. Identifying such conditions, if they are possible at all, can require a significant amount of trial and error.Reference Herbert, Phani and Johanns11 Furthermore, the steep unloading slope exhibited by Li is extremely sensitive to minor inaccuracies in the regression analysis; in particular, the curve fit’s ability to accurately capture the initial portion of the unloading curve. We also note that the slope of the unloading curve does not provide an efficient means of determining E as a continuous function of depth, as the depth resolution in a multiple load–unload or cyclic experiment can be significantly limited by the strong propensity for Li to creep during each hold segment. Additionally, displacement data from a cyclic loading history can be highly susceptible to thermal drift.Reference Herbert, Phani and Johanns11 Experimental protocols proposed by Ngan and TangReference Ngan and Tang18 and Zhou et al.Reference Zhou, Hui, Tang and Ngan19 may offer an effective means of eliminating the peak hold, but the recommended load-time history is still subject to the aforementioned time constant constraint and it is of no value if the goal is to achieve a constant strain rate.
The commonly used dynamic method known as the continuous stiffness measurement technique can, under the right conditions, eliminate a number of the potential problems and limitations described above.Reference Herbert, Phani and Johanns11 In the case of Li, we submit that the most easily obtained and accurate estimates of S (and therefore E) are achieved by implementing the dynamic technique while the applied load is held constant, as this enables the optimal conditions most likely to generate data consistent with the assumptions of the analysis method.Reference Herbert, Phani and Johanns11 Evaluating S (and E) continuously as a function of depth with a high degree of accuracy is also imminently doable, but subject to more significant experimental constraints. In this work, we have implemented the dynamic technique in both ways. As will be shown, with the appropriate precautions, both implementations of the dynamic technique can be used to accurately estimate the elastic modulus of Li.
Details of the dynamic technique are available elsewhere.Reference Hay, Agee and Herbert7,Reference Herbert, Phani and Johanns11,Reference Herbert, Oliver and Pharr20 Here we provide a brief summary of the experimental method to support and facilitate the discussion of the data analysis and metrics used to evaluate the accuracy of the results. In addition to the normal applied load, the technique utilizes a phase lock amplifier (PLA) to measure the material’s response to a small harmonic oscillation (typically 0.25–2 nm) that, under the right conditions, enables S to be calculated accurately.Reference Herbert, Phani and Johanns11 We note that the amplitude is frequently given as the root mean square (rms) value of the peak-to-valley amplitude. The purpose of the PLA is to extract the harmonic component, h o, from the measured displacement signal at the drive frequency of the oscillator. The PLA also directly measures the corresponding phase angle, δ, between the controlled harmonic load, f o, and the measured h o. Subject to a number of important constraints, the dynamic technique can be used to measure S during any and all aspects of the indentation experiment.Reference Herbert, Phani and Johanns11 Assuming the change in A and h o is very small over the time scale of the measurement being made by the PLA and the peak-to-valley oscillation is a small fraction of the elastic recovery, then an accurate estimate of S can be given by the following linear approximation,
 $$S = {\left( {{1 \over {{{\left. {{{{f_{\rm{o}}}} / {{h_{\rm{o}}}}}\cos \delta } \right|}_{{\rm{instrument}}\;{\rm{\& }}\;{\rm{specimen}}}} - {{\left. {{{{f_{\rm{o}}}} / {{h_{\rm{o}}}}}\cos \delta } \right|}_{{\rm{instrument}}}}}} - {1 \over {{K_{{\rm{lf}}}}}}} \right)^{ - 1}}\quad ,$$
where K lf is the stiffness of the measurement system’s load frame. Details of this relationship and its inherent assumptions are provided elsewhere.Reference Hay, Agee and Herbert7,Reference Herbert, Phani and Johanns11,Reference Herbert, Oliver and Pharr20
It is well documented that estimates of E determined by nanoindentation can be significantly influenced by the film’s substrate.Reference Saha and Nix21,Reference Hay and Crawford22 In this work, we have addressed this issue by adopting the film-substrate model developed by Hay and Crawford.Reference Hay and Crawford22 A brief summary of the model and the inputs used here are provided in Sec. III.B.
D. Unique experimental challenges implementing the dynamic technique due to the high E/σy ratio of Li
The E/σy ratio of Li is ∼16,000, which is nearly 30 times larger than that of most steels and 60 times larger than that of structural aluminum alloys. As reported by Pharr et al.,Reference Pharr, Strader and Oliver12 high ratios of E/σy (≥225) are problematic because continuous contact between the oscillating indenter tip and the surface of the test specimen cannot be achieved until there is sufficient elastic recovery to accommodate the peak-to-valley amplitude of the targeted h o. Once continuous contact is made, accurate estimates of S and E require that the data obtained from the PLA be uniquely representative of elastic deformation. Strictly speaking, this criterion cannot be achieved unless A is constant over the timescale of the measurement being made by the PLA. Because this condition occurs only in a very limited number of experimental circumstances, plasticity is almost always present and, therefore, accurate estimates of S and E can only be made when the relative contribution of plasticity per cycle is small. When E/σy is large, achieving this condition is particularly difficult. When it is not met, the PLA inherently captures the slope of both the loading and unloading curves and the result is a spurious increase in the measured δ and an overestimated measurement of h o. Both of these outcomes force S and E to be underestimated. At a fixed frequency, amplitude and measurement time constant of the PLA, the magnitude of the potential error in S and E due to the change in A scales directly with E/σy and the strain rate.Reference Herbert, Phani and Johanns11 Recent work by Merle et al.Reference Merle, Maier-Kiener and Pharr13 provides a comprehensive analysis of precisely this problem. Among the important outcomes, Merle clearly shows in single crystal and ultra fine-grained aluminum that an increase in δ can be a reliable indicator of erroneous results from the PLA due to plastic deformation occurring over the time scale in which δ and h o are measured. For future reference, we simply refer to this issue as the plasticity error.
When the plasticity error is negligible, then the most accurate estimates of S from the PLA are obtained when the peak-to-valley amplitude is a small fraction of the elastic recovery or, alternatively, when  $\sqrt 2 {f_{\rm{o}}}$ is a small fraction of P (the $\sqrt 2$ factor converts the reported rms value of f o to the peak amplitude assuming a perfect sinusoidal waveform). When this condition is not met, the PLA inherently captures the curvature of the unloading curve, which violates the linear approximation assumed by Eq. (4) and results in an underestimated calculation of S and E.Reference Herbert, Phani and Johanns11 Assuming the magnitude h o is fixed and the contact geometry is geometrically self-similar with depth (h f/h max is fixed), then the depth at which the peak-to-valley amplitude becomes a small fraction of the elastic recovery (or $\sqrt 2 {f_{\rm{o}}}$ becomes a small fraction of P) scales directly with the magnitude of E/σy.Reference Pharr, Strader and Oliver12
E. Experimental methods used to measure the elastic modulus
Loading was controlled such that the ratio  $\dot{P}{\rm{/}}P$ was held constant at targeted values of 0.05 and 0.5 s−1. For a bulk, homogeneous solid (elastic modulus and hardness are fixed) and at indentation depths that are large relative to the rounding of the indenter tip’s apex, this loading algorithm results in a constant indentation strain rate, defined as $\dot{h}{\rm{/}}h$. Upon reaching the prescribed depth limit of 1 μm (∼260 μN when $\dot{P}{\rm{/}}P$ = 0.05 s−1) the load was held constant for a period of 60 s. During both the loading and hold segments, the PLA was operated at a fixed drive frequency of 100 Hz, the amplitude of the harmonic oscillation was held constant at 1 nm rms (2.8 nm peak-to-valley assuming a perfect sinusoidal waveform) and the time scale of the measurement being made by the PLA was 50 ms (5 waveforms at the drive frequency). To indirectly verify the measurement system’s load and displacement calibrations, the magnitude of K lf and the indenter tip’s area function, experiments were also performed in the reference material fused silica.
Aspects of the experimental parameters described above were selected by design to generate data that are consistent with the requisite assumptions of Eq. (4) and operation of the PLA. Together, the targeted  $\dot{P}{\rm{/}}P$ value of 0.05 s−1 and the h limit of 1 μm serve to minimize the peak velocity but without unduly exposing the displacement data to significant contributions from thermal drift. Coupled with the PLA operating at 100 Hz with a 50 ms time constant, these parameters work together to minimize the risk of violating the elastic analysis assumptions underlying Eq. (4) by limiting the change in A over the timescale of the measurement made by the PLA. Assuming the effect of the aforementioned plasticity error is negligible, then the selected 1 nm rms amplitude enables the PLA to achieve and maintain full contact between the Li surface and the indenter tip at the smallest possible depth while also achieving a favorable signal to noise ratio. The 60 s hold at the end of the loading segment provides the best window of opportunity to reliably measure S and E, as the velocity is minimal and h o is the smallest possible fraction of the elastic recovery. At a depth limit of 1 μm, we note that the ratio of h to film thickness is still within the operating limits of the Hay–Crawford thin film model. Increasing the magnitude of $\dot{P}{\rm{/}}P$ to 0.5 s−1 provides a means of quantifying any potential rate effects or illustrating what happens when the assumptions of the elastic analysis associated with Eq. (4) are potentially violated.
Because of the propensity for Li to creep at the test temperature (T H = 0.67), it is exceedingly difficult to distinguish between thermal drift and creep. Since the drift rate could not be accurately measured, no attempt was made to correct the measured displacement for thermal drift. As previously noted, the effect of thermal drift was minimized by performing experiments only after the stability of the glove box reached ±0.5 °C for a period of at least 6 h prior to testing.
III. RESULTS AND DISCUSSION
A. Indirect verification of the instrument calibrations, frame stiffness, and area function
Although not explicitly shown, results from a fused silica reference block were used to indirectly verify the measurement system’s load and displacement calibrations, the frame stiffness, and the indenter tip’s area function. Over the course of the investigation, experiments in the reference block were routinely performed using a target  $\dot{P}{\rm{/}}P$ of 0.05 s−1 and 5 × 4 arrays with 20 μm spacing in the x and y directions. Typical values of the peak P, h, and S were 44.9 mN ± 0.05%, 646.4 nm ± 0.1%, and 1.679 × 10⁵ N/m ± 1.0%, respectively. Over 80 ≤ h ≤ 640 nm (truncated at 80 nm to avoid tip rounding effects), the depth independent magnitude of S 2/P was found to be 660.3 GPa ± 0.2%, which is within 0.63% of the nominally expected value of 656.2 GPa.Reference Oliver and Pharr5,Reference Oliver and Pharr6 Here we note that the expected value is taken to be the midpoint of the range in S 2/P assuming E = 72 GPa, ν = 0.18, E i = 1141 GPa, νi = 0.07, β = 1.0, and 9.3 ≤ H ≤ 9.7 GPa. Direct comparison between the measured and expected magnitude of S 2/P is particularly insightful because the ratio is based on directly controlled or measured parameters and it requires no modeling of the contact. Furthermore, the measured S is relatively insensitive to thermal drift. Barring offsetting errors in the load and displacement calibrations, the strong correlation between the measured and expected value of S 2/P provides indirect confirmation of the measurement system’s load and displacement calibrations.Reference Oliver and Pharr6 To be clear, the favorable comparison is a necessary but not sufficient condition to confirm the instrument’s load and displacement calibrations. In addition to the magnitude, the depth independence of S 2/P demonstrates that for rigidly mounted test specimens, the K lf of 9.6 × 10⁵ N/m (±∼5%) is an accurate estimate that can be used without extrapolation to a maximum S limit of 1.679 × 10⁵ N/m (the peak S used to determine K lf). Over 15 ≤ h ≤ 640 nm, the depth independent E of fused silica was found to be 73.3 GPa ± 0.43%, which is within 1.8% of the expected E of 72 GPa.Reference Oliver and Pharr5,Reference Oliver and Pharr6 This result corroborates the accuracy of K lf and indicates that the indenter tip’s 6-term area function provides an accurate estimate of the tip geometry to a maximum contact depth of 450 nm. Although the h o of 1 nm (rms) may induce the aforementioned curvature error in silica at depths below ∼50 nm, for reasons described below, the Li data are examined only at h > 100 nm. We also note that while the area function is only calibrated to a contact depth of 450 nm, it extrapolates in a completely smooth and continuous fashion to a depth of at least 2 μm. Throughout the investigation, no significant changes were observed in the measured properties of the silica reference block or the magnitude of K lf.
B. The elastic modulus of vapor deposited lithium
Implementing the experimental methods described above, the elastic modulus of a 5 μm thick Li film on a glass substrate was measured as a continuous function of depth over the range of ∼100–1100 nm. While nanoindentation is commonly used to accurately measure E at depths as low as 10 nm, due to limitations of the measurement technique that are unique to the high E/σy ratio of Li, the data are necessarily truncated at depths below 100 nm. An explanation of the depth cut-off is provided in Sec. III.D. Using Eqs. (1)–(4), the elastic modulus was calculated from the data acquired during the loading segment at a targeted  $\dot{P}{\rm{/}}P$ of 0.05 s−1 and during the 60 s hold at P max (260 μN). As previously noted, none of the data were corrected for thermal drift. Poisson’s ratios of the diamond indenter and Li were taken to be 0.07 and 0.362, respectively. The elastic modulus of diamond was taken to be 1141 GPa.
Effects of the glass substrate were eliminated through application of the film-substrate model proposed by Hay and Crawford.Reference Hay and Crawford22 In addition to the experimentally controlled and measured parameters, the inputs for the model are the film thickness, Poisson’s ratio of the film, and the elastic properties of the substrate (E and ν). The input values used here were as follows: film thickness = 5 μm, νfilm = 0.362, E glass = 69 GPa, and νglass = 0.18. Despite the large mismatch between the modulus of the film and substrate (E film/E substrate = ∼0.13), by representing the film and substrate as a system of linear elastic springs that allow the film to act both in series and in parallel with the substrate, the model enables the elastic properties of the Li film to be determined independent of the substrate to depths as large as 25% of the film thickness.
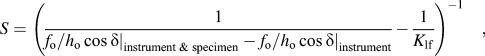
To a maximum depth of 22% of the film thickness, Fig. 1 shows the apparent (measured) and substrate corrected film modulus as a continuous function of indentation depth. The results are plotted throughout the loading segment ( $\dot{P}{\rm{/}}P = 0.05$ s−1) and during the 60 s hold at P max (260 μN), which commences at h = 1 μm. The data presented in Fig. 1 represent the average of 45 of 56 measurements performed in a 7 × 8 array with 35 μm spacing between targeted test sites. The scatter bars span one standard deviation about the mean. Results from measurements with significantly skewed residual hardness impressions caused by the indenter inadvertently being placed on boundaries between grains at different heights were discarded due to the ambiguity in determining A. At the end of the 60 s hold, S max ≤ 80,000 N/m, which is well below the K lf extrapolation limit of 1.679 × 10⁵ N/m and ≤0.08K lf. Thus, assuming the test specimen is rigidly mounted, any reasonable uncertainty or error in the magnitude of K lf does not make a significant contribution to the measured displacement or the calculated modulus. As previously noted, the indenter tip’s area function is valid at h ≥ 15 nm and it extrapolates in a completely smooth and continuous fashion to a depth of at least 2 μm.
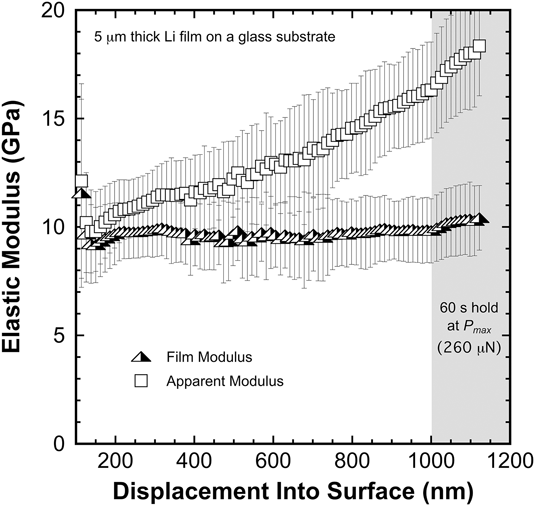
FIG. 1. The film (substrate corrected using the Hay–CrawfordReference Hay and Crawford22 thin-film model) and apparent (measured) elastic modulus of a high-purity vapor deposited 5 μm thick Li film on a glass substrate (T = 31 °C).
Having effectively eliminated the K lf and area function as potential sources of experimental error, we submit that the significant increase in the apparent modulus as a function of depth is predominantly due to the substrate effect. Other experimental factors that could potentially contribute to the depth dependence are, but not limited to, thermal drift, the plasticity error, capturing the curvature of the unloading curve, and pile-up. Although we do not provide a rigorous, systematic elimination of these potential sources of error, we do note several key experimental observations indicating their potential contribution(s) are minimal. Assuming the thermal drift rates are similar to those observed while testing fused silica, ∼0.05 nm/s, the effect of drift diminishes with depth and becomes insignificant at h max = 1.1 μm; the time to reach the end of the 60 s hold in the Li film is 195 s, therefore, the estimated contribution from drift is <0.009h max. The potential effect of the plasticity error appears to be small as well, as the increase in the film E observed during the 60 s hold is only ∼5.4% despite the dramatic decrease in velocity of the indenter during the hold segment. Thus, it follows that data acquired during loading are not severely affected by the plasticity error. Due to the high E/σy ratio of Li, the unloading curve is remarkably steep (the ratio of the final depth to the maximum depth, h f/h max = ∼0.98), thus, it follows that the potential curvature effect diminishes with increasing depth. High magnification optical images of the residual hardness impressions shown in Fig. 2 reveal no evidence of pile-up, as the contact edges connecting the 3 corners of each impression are very straight, smooth lines that appear to be in the original plane of the surface. In addition, there are no optically visible slip lines or changes in the local surface morphology that are characteristic of pile-up. Collectively, these observations suggest that the depth dependence observed in the apparent modulus is predominantly due to the substrate effect. Furthermore, the absence of significant pile-up indicates the Li film has a strong capacity for work hardening.
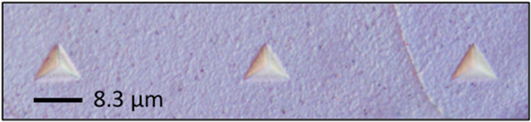
FIG. 2. Approximately 1.1 μm deep residual hardness impressions in Li. The straight (rather than bowed outward) contact edges connecting the 3 corners and the absence of discernible changes in the surface morphology radiating outward from the contact indicate that there is no significant pile-up.
The predominantly depth independent film E is, therefore, taken to be a direct outcome of the Hay and Crawford model. Over the depth range of 150–1100 nm, the average elastic modulus of the 5 μm thick Li film is 9.8 GPa ± 11.9%. We surmise that the large scatter in the average directly reflects the high shear anisotropy factor of Li (∼8.4), as the residual hardness impressions in this particular film span from 1 to no more than 5 grains.Reference Nash and Smith23–Reference Xu, Ahmad, Aryanfar, Viswanathan and Greer25 We also note that these results are generally consistent among all the films examined, but as shown in Sec. III.E, the average E varies by 18% with film thickness over the range of 5–18 μm, possibly due to changes in texture. We further note that the depth independent E is a very strong indicator that the oxide film layer on the surface is minimal, as it clearly does not make a significant contribution to the measured properties over the depth range of ∼100–1100 nm.
A subset of characteristic residual hardness impressions similar to those shown in Fig. 2 were used to indirectly verify the indenter tip area function and frame stiffness. Using the x–y positions of the piezo stages and a fixed fiduciary marker (cross hair) on the computer screen, the projected contact area was calculated from the x–y coordinates of all 3 corners. Although the population was small (<10), the measured area was within 3–5% of the area deduced from the maximum indentation depth, the measured contact stiffness, and the indenter tip area function. This validation of the projected contact area confirms the accuracy of the area function, the magnitude of the frame stiffness, and, thus, the estimated E presented here and the H results presented in subsequent publications.Reference Herbert, Hackney, Dudney, Thole and Phani3,Reference Herbert, Hackney, Dudney, Thole and Phani4
C. Comparison to literature values
The experimentally measured E of bulk, polycrystalline Li at room temperature ranges from approximately 5–8 GPa.Reference Yu, Schmidt, Garcia-Mendez, Herbert, Dudney, Wolfenstine and Siegel1,Reference Xu, Ahmad, Aryanfar, Viswanathan and Greer25,Reference Schultz26 This 46% discrepancy may be a reflection of the manner in which E is measured, as YuReference Yu, Schmidt, Garcia-Mendez, Herbert, Dudney, Wolfenstine and Siegel1 points out that the values of 5 and 8 GPa correspond to mechanical testing methods performed under oil and resonance spectroscopy, respectively. The average E reported here (9.8 GPa ± 11.9% for a 5 μm thick Li film) clearly agrees best with the resonance spectroscopy results. We note, however, that when extrapolated to room temperature, the elastic constants of Li measured by Nash et al.Reference Nash and Smith23 (ultrasonic pulse-echo technique) and separately by Slotwinski et al.Reference Slotwinski and Trivisonno24 (reportedly a more precise ultrasonic pulse-echo technique), both predict an orientation-dependent E that ranges from approximately 3.1 GPa in the [100] direction to 21.4 GPa in the [111] direction. This room temperature range in E has also been confirmed by density functional theory (DFT) calculations recently performed by Xu et al.Reference Xu, Ahmad, Aryanfar, Viswanathan and Greer25 As such, we conclude the magnitude of E measured here is well within the expected range and, moreover, the measured value of 9.8 GPa ± 11.9% may be indicative of texture in the film. The potential effect of elastic anisotropy on the measured indentation modulus and the change with film thickness is discussed in Sec. III.E.
D. Explanation of the 100 nm cut-off and further evidence of minimal surface contamination
As described in Sec. II.D and illustrated by the ratio  ${{\sqrt 2 {f_{\rm{o}}}} / P}$ shown in Fig. 3, below 100 nm, the targeted 1 nm amplitude of h o (2.8 nm peak-to-valley) is too large for the PLA to achieve continuous contact between the indenter tip and the surface of the Li film. Measurements from the PLA at h < ∼100 nm are, therefore, meaningless. Scatter bars on the Li data below 100 nm are intentionally not plotted because they span nearly the entire range of the y-axis.

FIG. 3. The peak force amplitude of the harmonic oscillation normalized by the applied load.
Figure 3 also provides direct evidence of minimal surface contamination. As the data show the elastic recovery in Li at ∼100 nm is 0.028h and, therefore, the ratio of the final depth, h f, to the maximum depth, h max, is 0.972. This result is consistent with the high E/σy ratio of Li and the magnitude of h f/h max from experiments performed to depths of 1 μm in 18 μm thick films.Reference Pharr and Bolshakov10 This direct observation requires no modeling of the contact and indicates that the data obtained near the free surface is representative of predominantly uncontaminated Li, as a significant oxide layer would suppress the intermittent contact and provide substantially more elastic recovery. Direct comparison between the ratio  ${{\sqrt 2 {f_{\rm{o}}}} / P}$ for Li and fused silica, which is also shown in Fig. 3, directly supports this claim. Using precisely the same test method, the averaged silica data from 20 measurements (the scatter bars are completely obscured by the data points) show that the peak amplitude of the harmonic load is never more than 20% of the normal load. This indicates continuous contact in the silica was maintained to depths at least as low as 10 nm. We submit that if the Li surface was contaminated with a significant oxide layer, it would either completely suppress the intermittent contact $\left( {{{\sqrt 2 {f_{\rm{o}}}} / {P \lt 1}}} \right)$ or at least suppress it until the oxide layer cracked and was no longer capable of supporting the applied load. Clearly the former did not occur, and if the later is true, then the contribution made by the oxide layer is insignificant.
E. Elastic anisotropy and a variation in E with film thickness
To better capture the extent of elastic anisotropy and the potential effect of film thickness, three randomly placed 8 × 8 arrays of 1 μm deep indents with 35 μm spacing were performed in two additional Li films; one 5 μm thick and the other 18 μm. Figure 4 shows the cumulative distribution function of the film E calculated from data obtained during the 60 s hold at P max, specifically over the depth range of 1050–1100 nm. As before, adverse effects of the glass substrate were removed from the 5 μm thick film using the Hay and Crawford model.Reference Hay and Crawford22 Data from the 18 μm thick film were not corrected for the substrate because the apparent and film modulus are effectively the same (no significant substrate effect).
FIG. 4. The elastic modulus of high-purity vapor deposited 5 and 18 μm thick Li films on glass substrates. The modulus was measured during the 60 s hold at 260 μN (corresponding depth of ∼1.1 μm). Data from the 5 μm thick film have been corrected for the substrate using the Hay–Crawford thin-film model. Data from the 18 μm thick film did not require a substrate correction.
The average elastic moduli of the 5 and 18 μm thick films are found to be 9.3 GPa ± 17.3% and 8.2 GPa ± 14.5%, respectively. These averages are in general agreement with the result obtained from the previously examined 5 μm thick film (9.8 GPa ± 11.9%). As shown in Fig. 4, the measured E of the 5 and 18 μm thick films ranges from approximately 5.1–13.7 GPa and 5.9–11.9 GPa, respectively.
Based on the previously mentioned linear extrapolation of the elastic constants measured by NashReference Nash and Smith23 or Slotwinski,Reference Slotwinski and Trivisonno24 both of which are consistent with Xu’sReference Xu, Ahmad, Aryanfar, Viswanathan and Greer25 recent DFT calculations, it is possible to predict the orientation-dependent E measured by nanoindentation (for solids with cubic crystal symmetry) using an analysis method proposed by Vlassak and Nix.Reference Vlassak and Nix27 Taken directly from Slotwinski’s linear extrapolation, the room temperature (298 K) elastic constants of Li are as follows: C 11 = 13.42; C 12 = 11.3 and C 44 = 8.89, all in units of GPa. The calculated compliances are as follows: S 11 = 0.3237; S 12 = −0.1480; S 44 = 0.1125, all in units of GPa−1. The resulting shear anisotropy factor, A = 2C 44/(C 11 − C 12), is 8.4. Following the analysis method of Vlassak and Nix, the predicted indentation modulus for the (100), (110), and (111) surfaces is 7.9, 9.4, and 9.9 GPa, respectively. Among the required inputs of the analysis method, the elastic modulus and Poisson’s ratio of isotropic, randomly oriented, polycrystalline Li are taken to be 8 GPa (arguably the literature’s best estimate from ultrasonic measurements) and 0.364, respectively. Furthermore, Poisson’s ratio in the [100] direction is taken to be |S 12/S 11| = 0.45. Based on these inputs, the gray box shown in Fig. 4 represents the orientation-dependent range in E predicted by Vlassak and Nix. We note that this range is based on tabulated values limited to A < 8, which is just below the 8.4 value calculated for Li. The error this may introduce is not examined here, but could presumably be quantified by utilizing the rigorous solution proposed by Vlassak and Nix rather than the tabulated values.
Taken at face value, the average E of the 18 μm thick film (8.2 GPa) and the analysis proposed by Vlassak and Nix suggest that the film surface is predominantly representative of (hkl) surfaces near (100). For the 5 μm thick film, the average modulus of 9.8 GPa indicates that the film surface is predominantly representative of (111) texture. The nearly factor of 3 discrepancy between the measured and predicted range in E is not well understood. In addition to A being beyond the limits of the tabulated values, it is not immediately clear whether the measured stiffness from an indentation that spans anywhere from 2 to 5 grains is consistent with the assumptions of the proposed analysis. To the extent this may be a problem, one would expect it to be more prevalent in the thinner film (5 μm thick) due to its inherently smaller grain size.
F. Evaluation and validation of the measurements performed by the PLA
Over the depth range of 100 to ∼1100 nm, Figs. 5(a)–5(c) show the average h o,  $\dot{A}{\rm{/}}A$ and δ for the 5 and 18 μm thick Li films and, for comparative purposes, data obtained from fused silica (h max = 650 nm). These specimens were characterized using the same test method, but $\dot{P}{\rm{/}}P$ targets ranging from 0.05 to 0.5 s−1. Scatter bars for the silica data are completely obscured by the data points in all three figures. For the sake of clarity, scatter bars for the 18 μm thick film have been omitted from Figs. 5(a) and 5(c). Over the entire depth range, the silica data show that h o is stable at the targeted 1 nm amplitude, the increase in A over the timescale of the measurement being made by the PLA is never more than 0.25% (product of $\dot{A}{\rm{/}}A$ and the PLA’s measurement time constant, 50 ms) and, as expected, for a bulk, homogeneous linear elastic solid, δ is nearly 0°. Coupled with the small ratio of ${{\sqrt 2 {f_{\rm{o}}}} / P}$ shown in Fig. 3 and silica’s small ratio of E/σy (≤16), these observations indicate that the PLA’s measurements in silica are generally consistent with the elastic analysis assumptions implicitly required by Eq. (4).

FIG. 5. Comparisons between fused silica and two Li films, 5 and 18 μm thick on glass substrates: (a) the amplitude (rms) of the harmonic oscillation; (b) the relative change in contact area; and (c) the material’s ability to dissipate mechanical energy. Data in the gray regions were obtained during the 60 s hold at P max rather than during the loading segment.
At depths of approximately 230 and 350 nm in the 18 and 5 μm thick films, respectively, the deformation mechanism is hypothesized to transition from diffusion to dislocation mediated flow. This conjecture is not addressed here, but is the focus of the following companion papers.Reference Herbert, Hackney, Dudney, Thole and Phani3,Reference Herbert, Hackney, Dudney, Thole and Phani4 From the onset of this proposed transition to near the end of the loading segment, the PLA’s measurements of h o and δ are less accurate. Although not explicitly shown here, the dislocation-mediated flow is accompanied by displacement bursts and stair-step P–h behavior, both of which diminish the accuracy and precision with which the PLA can determine h o and δ. Furthermore, in a manner that depends on the strain rate and the velocity of the indenter, the plasticity error may also cause h o and δ to be overestimated. Because the 60 s hold at P max is the most stable segment of the experiment, it naturally follows that the change in E before and after stabilizing in the hold directly reflects the extent to which the data obtained by the PLA may or may not be affected by the plasticity error. This comparison is directly illustrated in Fig. 6, which shows the film modulus as a continuous function of depth for the 5 and 18 μm thick films. When  $\dot{P}{\rm{/}}P$ is targeted at 0.05 s−1, the 5.4% increase in E after transitioning to the hold clearly suggests that the plasticity error in the loading segment is small. Conversely, at a targeted $\dot{P}{\rm{/}}P$ of 0.5 s−1, the 42% increase in E signifies the data obtained during the loading segment are not consistent with the underlying assumptions of Eq. (4) and are, therefore, deemed unreliable. Although not explicitly shown here, we note that the change in E observed in fused silica before and after the hold is less than 1%.

FIG. 6. The elastic modulus of high-purity vapor deposited 5 and 18 μm thick Li films on glass substrates. At the higher targeted  $\dot{P}{\rm{/}}P$ of 0.5 s−1, the decrease in E with depth (to h = 1 μm) is an experimental artifact due to the plasticity error, i.e., the contact area is changing significantly over the time scale of the measurement being made by the PLA.
G. Potential damping effect near the free surface
The peak in δ near the free surface (h < 200 nm), shown in Fig. 5(c), is of particular interest. We note, however, that the data acquired thus far provide no definitive insight into whether any fraction of the observed change in δ with depth may or may not be an experimental artifact due to the testing conditions. Nevertheless, the possible change in δ attracts significant interest because the directly measured parameter indicates the material’s out-of-phase response to the imposed harmonic oscillation. In other words, it indicates the extent to which mechanical energy is dissipated in the form of heat. Although the peak values near the free surface are not particularly large (8.3 and 10.6° at  $\dot{P}{\rm{/}}P$ targets of 0.05 and 0.5 s−1, respectively), any localized heating in the Li could make a significant contribution to the overall stability and performance of the Li/SE interface. Moreover, δ may provide unique insight into the defect structure of the volume of the material being sampled. Perhaps eventually even revealing important changes as a function of electrochemical cycling. For example, it would seem energy dissipation associated with a 2.8 nm oscillation (peak-to-valley) driven at 100 Hz occurs too quickly to be accommodated by diffusion. At a time scale of 0.01 s, perhaps δ reflects internal friction due to some type of pulsating dislocation motion in a manner that depends on the dimensions of the contact relative to the dislocation density and strain rate. Although nothing more than conjecture, this hypothesis could be rigorously investigated in the future using a combination of $\dot{P}{\rm{/}}P$ and load and hold experiments performed with multiple indenter geometries.
H. Summary of the experimental observations indicating minimal surface contamination
Despite the well-controlled environment of the dedicated glove box (<0.1 ppm O2 and H2O), there is unquestionably a layer of contamination on the Li surface. Based on results and analysis presented by Zavadil et al.,Reference Zavadil and Armstrong28 who examined the surface chemistry and reactivity of Li with exposure to O2 and H2O in an ultra high vacuum environment, it is likely that CO2 and H2O in the glove box fortuitously act as a kinetic regulator, slowing the oxidation rate such that the contamination layer on the surface is possibly less than 5–10 nm over the 12–15 day period from deposition to completion of the experiments. Significant experimental observations support this claim: (i) The measured film modulus of 9.8 GPa ± 11.9% (5 μm thick film) is predominantly depth independent from 100 to 1100 nm and well within the expected range. This result indicates that the surface is predominantly representative of uncontaminated Li; (ii) the peak-to-valley amplitude of 2.8 nm does not achieve continuous contact with the indenter tip until h ≥ ∼100 nm. This result is also consistent with the expected behavior of a predominantly uncontaminated Li surface; (iii) the surface morphology of the residual hardness impressions show no evidence of cracking, delamination, or spalling of a contamination layer. In addition, the multifaceted geometry of much deeper (6 μm) indentations used as fiduciary markers shows significant pile-up caused by the substrate,Reference Hay and Pharr8 appreciably bowed edges, highly distorted grains, and plastic anisotropy, yet no discernible evidence of cracking, delamination, or spalling of a contamination layer; (iv) optical images of the Li film surface show significant grain boundary grooving and ghost boundaries, both of which are indicative of continuous annealing with time.Reference Chongmo and Hillert29,Reference Andrés, Caballero, Capdevila and Martín30 These observations suggest that the surfaces are generally free of a thick, uniform contamination layer, as the grooving and grain growth can only occur if the free surface is largely unconstrained and surface diffusion is uninhibited; (v) although not explicitly shown here, at the target  $\dot{P}{\rm{/}}P$ of 0.05 s−1, the measured hardness initially increases with h which is completely opposite of what would be expected for an oxide layer on a relatively soft film.Reference Saha and Nix21 Collectively, these experimental observations are consistent with the results presented by Zavadil et al.Reference Zavadil and Armstrong28 and suggest that the contamination layer on the film surface is minimal and its effect on the measured properties is negligible if any at all.
IV. CONCLUSIONS
(1) Over indentation depths ranging from 150 to 1100 nm, the average elastic modulus of a high-purity 5 μm thick vapor deposited Li film is found to be 9.8 GPa ± 11.9%. Although slightly higher than the 8 GPa reported for bulk, polycrystalline Li measured by ultrasonic test methods, this result and the high standard deviation are consistent with the elastic constants of Li and its high shear anisotropy factor of ∼8.4. Based on the anisotropic analysis of Vlassak and Nix, the indentation modulus of 9.8 GPa suggests the film surface is predominantly representative (hkl) surfaces with (111) texture. The substrate effect was removed using the Hay and Crawford thin-film model.
(2) The average elastic modulus of an 18 μm thick vapor deposited Li film is found to be 8.2 GPa ± 14.5%. Based on the anisotropy analysis of Vlassak and Nix, the indentation modulus of 8.2 GPa indicates that the film surface is predominantly representative of (hkl) surfaces near (100).
(3) The elastic modulus results presented here indicate that the elastic properties of bulk polycrystalline lithium cannot be used to accurately model the interface between lithium and a SE.
(4) Under high magnification in an optical microscope, there is no discernible evidence of pile-up. This indicates that the Li film also has a strong capacity for work hardening. Measurements of the projected contact area are within 3–5% of the area calculated analytically using the Oliver–Pharr model. This validation of the projected contact area confirms the accuracy of the area function, the magnitude of the frame stiffness, and, thus, the estimated E presented here and the H results presented in subsequent publications.Reference Herbert, Hackney, Dudney, Thole and Phani3,Reference Herbert, Hackney, Dudney, Thole and Phani4
(5) In spite of the high reactivity of Li, numerous experimental observations indicate that the contamination layer on the film surface is minimal and its affect on the measured properties is negligible if any at all.
(6) The energy dissipation capability of Li appears to be higher near the free surface. Although the results generated here could not be fully verified, the preliminary observations suggest the measured phase angle may prove to be a valuable parameter in evaluating the subsurface defect structure of Li, particularly as a function of electrochemical cycling.
(7) Significant experimental challenges are created by the high elastic modulus to yield strength ratio of Li and its strong propensity to creep near room temperature. Experimental artifacts and misinterpretation can only be avoided through the implementation of well-designed experiments and rigorous vetting of the data.
ACKNOWLEDGMENTS
This research was sponsored jointly by the U.S. Department of Energy, Office of Energy Efficiency and Renewable Energy’s Advanced Battery Materials Research program (managed by Tien Duong) and by TARDEC, the U.S. Army Tank Automotive Research Development and Engineering Center. E.G.H. is grateful for start-up funding from the Department of Materials Science and Engineering at Michigan Technological University.


