

Introduction
Artificial Intelligence (AI) excels at a range of cognitive tasks, from speech and image recognition to game playing,[1,Reference Silver, Schrittwieser, Simonyan, Antonoglou, Huang, Guez, Hubert, Baker, Lai, Bolton, Chen, Lillicrap, Hui, Sifre, van den Driessche, Graepel and Hassabis2] and holds great promise for automating scientific discovery.[Reference Tabor, Roch, Saikin, Kreisbeck, Sheberla, Montoya, Dwaraknath, Aykol, Ortiz, Tribukait, Amador-Bedolla, Brabec, Maruyama, Persson and Aspuru-Guzik3–Reference King, Whelan, Jones, Reiser, Bryant, Muggleton, Kell and Oliver8] The interpretation of scientific data remains a challenge for AI due to both the need for intricate scientific background knowledge and reasoning and the lack of large annotated training datasets. AI-based reasoning and learning methods are particularly critical for the field of high-throughput materials science where automated experiments are dramatically accelerating the pace of materials discovery for a variety of critical technologies.[Reference De Luna, Wei, Bengio, Aspuru-Guzik and Sargent4–Reference Nikolaev, Hooper, Webber, Rao, Decker, Krein, Poleski, Barto and Maruyama6,Reference Green, Choi, Hattrick-Simpers, Joshi, Takeuchi, Barron, Campo, Chiang, Empedocles, Gregoire, Kusne, Martin, Mehta, Persson, Trautt, Duren and Zakutayev9,Reference Kusne, Gao, Mehta, Ke, Nguyen, Ho, Antropov, Wang, Kramer, Long and Takeuchi10] Foundational techniques in high-throughput materials discovery include simultaneous synthesis of hundreds to thousands of materials using co-sputtering followed by rapid structural characterization via synchrotron XRD [Fig. 1(a)]. For complex materials containing three or more elements, the most common rate-limiting step in the discovery process is the construction of a crystal phase diagram from the composition and structural characterization data. We refer to this task as the phase mapping problem, which requires the identification of basis patterns (or factors) corresponding to pure crystal phases, some of which may not be sampled separately, such that all the XRD measurements can be explained as a mixture of the basis patterns [Figs. 1(c)–1(f)]. The XRD measurements are typically noisy, which contributes to the challenge of separating the basis pattern “sources” from the collection of patterns. Additionally, materials thermodynamics places a set of intricate physical constraints on the solution, and while synthesis of materials may not reach thermodynamic equilibrium, the non-equilibrium behavior is most commonly exhibited as the presence of non-equilibrium phases as opposed to deviations from, e.g., the Gibbs phase rule.
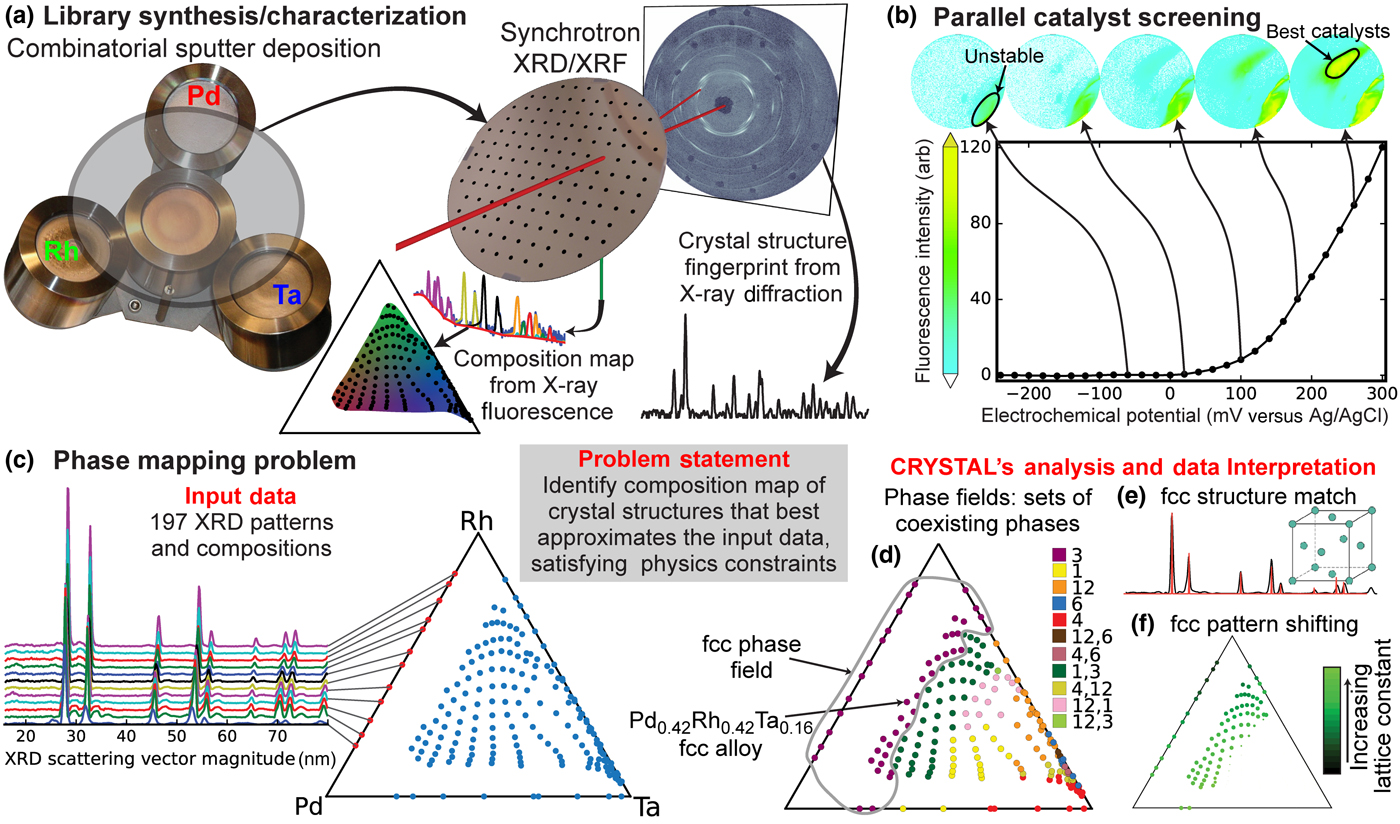
Figure 1. Materials discovery cycle. (a) Synthesis of materials using sputter co-deposition from palladium (Pd), rhodium (Rh), and tantalum (Ta) sources to form a “materials library” thin film with continuous composition variation. Collection of both elastically (XRD) and inelastically (XRF) scattered x-rays, using a synchrotron x-ray beam, to characterize the materials' crystal structure and composition, respectively, the latter enabling a ternary composition map of the Pd-Rh-Ta library. (b) Each library is screened for catalytic activity using an electrochemical imaging strategy in which the best catalysts are identified using a fluorescent marker.[Reference Reddington, Sapienza, Gurau, Viswanathan, Sarangapani, Smotkin and Mallouk11] Materials which appear active in the absence of methanol are denoted as “unstable.” (c) The triangle-composition plot contains the 197 distilled XRD/XRF measurements that comprise the input for phase mapping. The 12 XRD patterns along the Pd-Rh composition line illustrate composition-dependent peak shifting due to the two elements alloying in a single-crystal structure. (d) CRYSTAL's phase map solution identifies five phases (purple, yellow, orange, blue, and red) and six multi-phase fields; each sample's XRD pattern is explained by either a single phase or a mixture of phases. (e) The XRD pattern for a phase “3” sample is shown with red sticks denoting the known peak pattern of the face centered cubic (fcc) crystal structure, indicating that the broad range of compositions in the fcc phase field crystallize into this same structure. (f) The average atomic radius varies systematically with the alloy composition, which CRYSTAL captures by mapping the composition-dependent fcc lattice constant.
Phase mapping has traditionally been a bottleneck of the high-throughput materials discovery cycle as the synthesis and characterization experiments [Figs. 1(a) and 1(b)] can be performed on several libraries of materials per day while the manual effort required to solve a given phase mapping problem limits the throughput to only several phase diagrams per year. Previous reports have detailed the shortcomings of existing de-mixing algorithms,[Reference Hattrick-Simpers, Gregoire and Kusne12] most notably in the presence of noise and substantial alloying, an important phenomenon in which a range of elemental compositions crystallize into the same phase, causing its basis pattern to shift systematically with composition.[Reference Baumes, Moliner, Nicoloyannis and Corma13] Non-negative matrix factorization (NMF) techniques[Reference Lee and Seung14] have shown promise in the efficient extraction of representative diffraction patterns from large datasets,[Reference Long, Bunker, Li, Karen and Takeuchi15,Reference Kusne, Keller, Anderson, Zaban and Takeuchi16] but their limited ability to encode physical constraints and prior knowledge results in routine production of non-physical solutions. From a computational perspective, phase mapping is an example of a challenging NP-hard problem[Reference LeBras, Damoulas, Gregoire, Sabharwal, Gomes and van Dover17] whose sheer number of possible combinations of basis patterns and activations grows exponentially with data size, rendering monolithic solvers and traditional search methods computationally infeasible, which motivates the exploration of innovative AI approaches.
CRYSTAL: a multi-agent AI system for phase mapping
CRYSTAL is a multi-agent AI system that can run in unsupervised or semi-supervised mode and that decomposes phase mapping into smaller, more tractable sub-problems that are tackled by nimble algorithmic bots with unique background knowledge and reasoning capabilities (Fig. 2). Interleaved Agile Factor Decomposition (IAFD) is CRYSTAL's core phase-mapping engine, which interleaves factor decomposition (AgileFD bot) with constraint enforcement (Gibbs, Gibbs Alloy, and Phase Connectivity bots), whose collective reasoning produces physically meaningful phase maps. At a high level, IAFD relaxes and postpones the combinatorial physical constraints and iteratively repairs and enforces them when violations are detected.

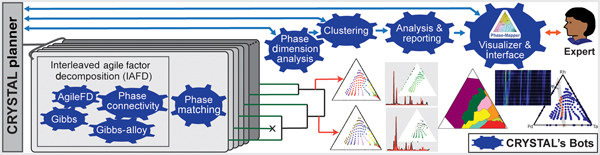
Figure 2. Outline of the CRYSTAL system. CRYSTAL incorporates a diverse collection of fast and specialized algorithms with different types of knowledge and computational capabilities. IAFD integrates the AgileFD, Gibbs, Gibbs Alloy, and Phase Connectivity bots, constituting CRYSTAL's core phase-mapping engine: AgileFD performs agile factor decomposition to learn the factors or basis patterns, corresponding to pure crystal structures, and its three partner bots enforce physical constraints. The Phase Matching bot matches the basis patterns discovered by IAFD to known crystal structure patterns from databases. The Phase Dimension Analysis bot analyzes and validates the generated phase maps and infers the system's maximum number of pure phases, which dictates how many system configurations CRYSTAL explores, using parallelism and randomization, to produce a large number of candidate phase maps. The hierarchical Clustering bot uses automated thresholding to identify a small set of representative candidate solutions, which are provided to either the CRYSTAL Planner for solution refinement or to the Analysis & Reporting bot to generate phase diagrams and other visualizations for human-expert inspection. The Visualizer & Interface bot enables users to interact with CRYSTAL for solution selection and fine tuning.
The graph reasoning algorithms of the Gibbs, Gibbs Alloy, and Phase Connectivity bots are applied at a local scale to enable parallel computation and ensure scalability for large real-world problems. The key insight is that global maintenance of the combinatorial physical constraints is computationally prohibitive, yet appropriate data exploitation with local constraint enforcement provides global constraint satisfaction at a relatively small computational expense. While generating a phase diagram is a confounding and time-consuming task even for experienced materials scientists, IAFD generates a solution typically within 2 min for the dataset reported in this paper, a groundbreaking advance in phase mapping since no other algorithm imposes the physical constraints to reliably yield physically meaningful solutions (see Table S1).
The capability to rapidly generate physically meaningful solutions enables CRYSTAL's large-scale computations to assess solution stability, uncovering a critical and previously overlooked aspect of phase mapping. Even with the imposed physical constraints, different phase diagram solutions are often “inadequately differentiated” by the source XRD patterns. Inadequate differentiation in phase mapping arises in part from the fundamental non-invertibility of an XRD pattern to obtain its crystalline phase source(s) and is compounded by both noise in the source data and presence of different phases with similar basis patterns. The standard practice in phase mapping, and more generally in data modeling, is to extract knowledge from a single solution that sufficiently reconstructs the source data. In contrast, CRYSTAL explores the search space by deploying bots in parallel to produce a large number of candidate solutions. Using additional bots for solution analysis and aggregation (Figs. 2–4), CRYSTAL runs unsupervised and autonomously to generate a parsimonious portfolio of phase diagrams that represent different interpretations of the source data.
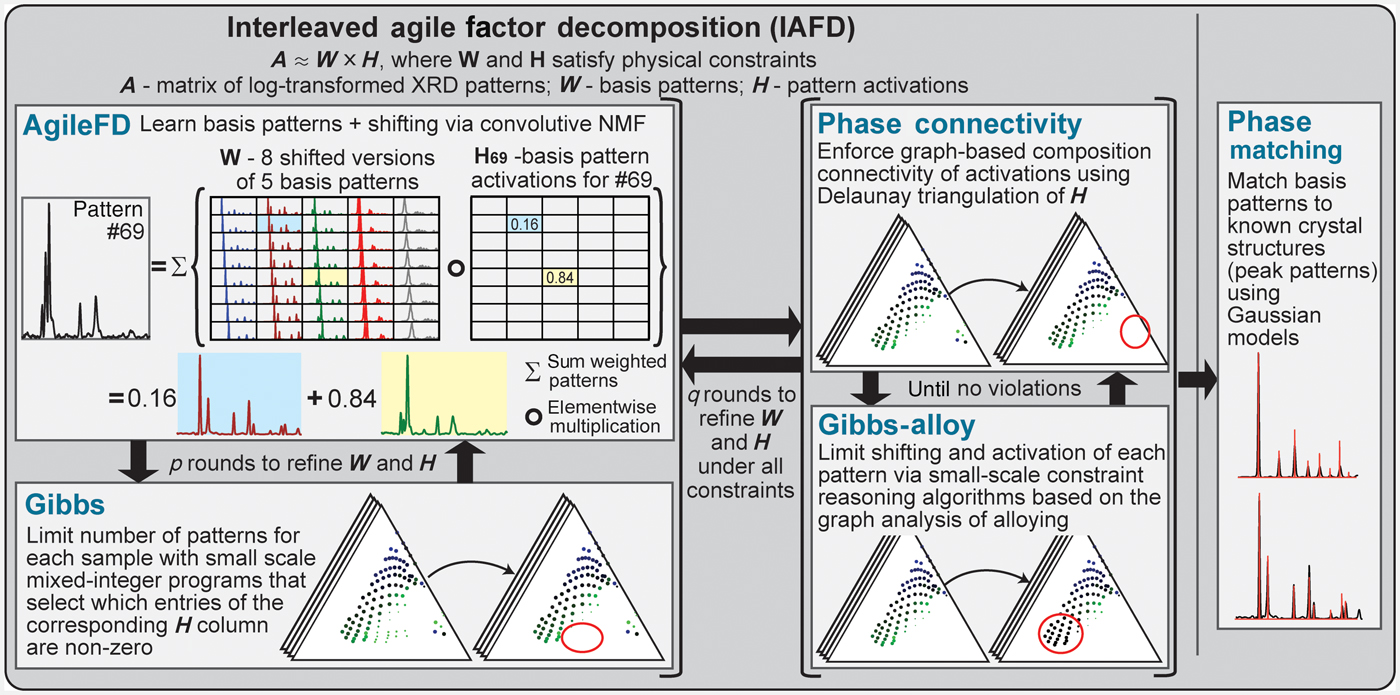
Figure 3. Solving phase mapping using an unsupervised generative approach. The IAFD bot network solves phase mapping as a constrained matrix factorization problem in which the input XRD pattern matrix (A) is decomposed into factors W and H such that W × H approximates A while satisfying physical constraints. W encodes the characteristic patterns of pure crystal phases (including shifted versions) and H their activations, which dictate both the amount and the pattern shifting extent of each pure phase in each XRD measurement. IAFD starts with p (typically three) rounds of interactions between the AgileFD and Gibbs bots followed by rounds of iterations between the Gibbs Alloy and Phase Connectivity bots, until all the constraints are satisfied. AgileFD performs matrix factorization using light-weight multiplicative updating rules, without enforcing the combinatorial physical constraints. The AgileFD solution's violations of the connectivity constraint and the constraints based on Gibbs' phase rule are repaired by the corresponding bots in an interleaved manner using efficient algorithms (red circles highlight repaired activations of H). The entire procedure is repeated for solution refinement (typically q = 2), and the resulting generated basis patterns are passed to the Phase Matching bot to identify the crystal structures by comparison with ICDD and/or determine if the solution potentially contains a new phase. The figure illustrates a representative XRD pattern of the Pd-Rh-Ta system (#69) that is decomposed into shifted versions of two different basis patterns (0.16 and 0.84 of each, respectively).
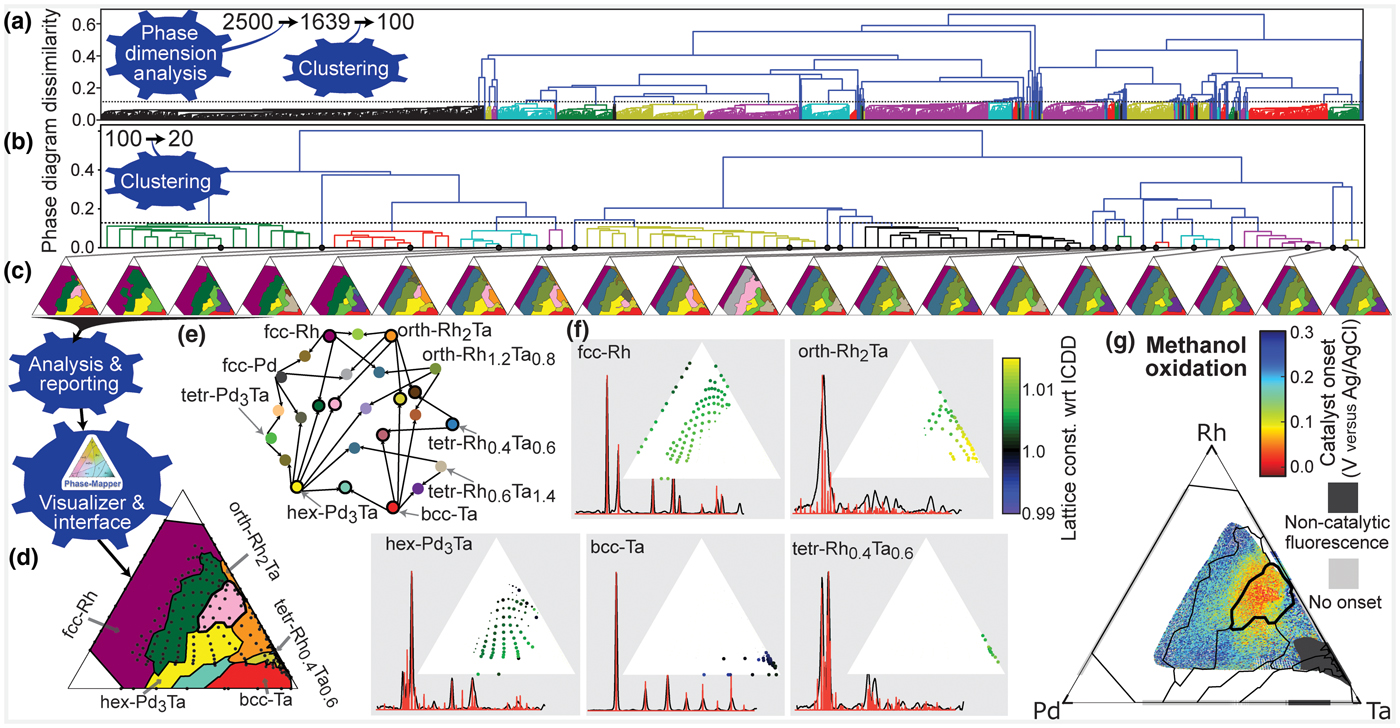
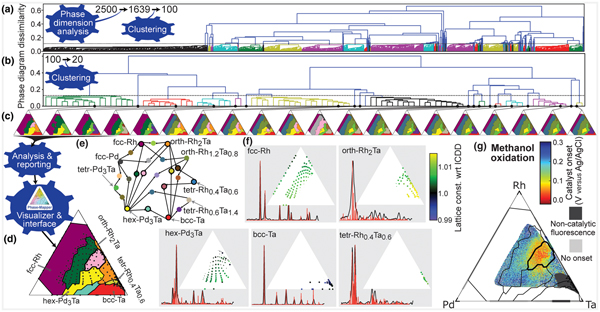
Figure 4. CRYSTAL's solution to the Pd-Rh-Ta catalyst system. (a) CRYSTAL automatically generates 2500 phase diagrams in parallel from which the Phase Dimension Analysis bot identifies 1639 valid solutions and the Clustering bot identifies 100 representative solutions for additional refinement. (b) From the 100 refined phase diagrams, CRYSTAL automatically identifies the span of solutions with different physical meaning, which is 20 phase diagrams in this case. (c) The selected 20 phase diagrams that represent their respective clusters. (d) The final solution resulting from expert consideration of CRYSTAL's report. The expert user also provided minor manual refinement of the phase diagram, in particular small phase field boundary adjustments in composition regions with sparse measurement data. (e) Color scheme for the phase fields where the single-phase fields are labeled and phase combinations are denoted by linkages. The 11 phase fields marked with a black circle appear in the final solution. (f) The basis patterns for the final solution with stick patterns from the International Center for Diffraction Data shown in red. Composition maps of the relative lattice constant for each phase reveal alloying-based shifts due to the different atomic radii of the elements (Ta > Pd > Rh). The dot size denotes the phase concentration. (g) The methanol oxidation onset potential for the ternary and binary composition spaces where Rh-Ta is the only binary to exhibit catalytic activity. The overlay of the final solution's phase field boundaries reveals that the best activity (lowest onset potential) is observed in the mixed orth-Rh2Ta + hex-Pd3Ta phase field.
CRYSTAL's algorithms
As mentioned above, CRYSTAL is a collection of nimble algorithmic bots, with different knowledge and reasoning capabilities performing a variety of tasks outlined in Fig. 2 and described in more detail below. The IAFD bots collectively solve the phase mapping problem, using an unsupervised generative approach, to produce a phase map that satisfies the physical constraints. The CRYSTAL planner launches parallel runs of IAFD with different random initializations and parameters, in particular the number of target phases, and each IAFD run follows the algorithm outlined below and illustrated in Fig. 3:
Step 0: Initialization: Initialize the inner-loop (AgileFD-Gibbs) counter CNT1, bounded above by p, together with CNT2 which counts outer-loops bounded above by q, to be 0. As discussed below, p and q are typically set to 3 and 2 respectively.
Step 1: AgileFD bot: Apply AgileFD on randomly selected N/p “untouched” samples
Step 2: Gibbs bot: Enforce Gibbs phase constraint on these N/p samples
Step 3: If some samples still have not been processed, namely CNT1 is still smaller than p, increase CNT1 by 1 and go back to step 1, otherwise, move on to step 4
Step 4: Gibbs-Alloy bot: enforce Gibbs-Alloy constraint on all N samples
Step 5: Phase Connectivity bot: enforce Connectivity constraint on all N samples
Step 6: If Gibbs-Alloy constraint is violated, go back to step 4, otherwise, go to step 7
Step 7: If CNT2 hasn't reached the upper bound q, refined solutions from Step 6 are fed into step 1 as initialization and the whole algorithm starts over again. Otherwise, the IAFD output is taken as the phase map finalized in step 6. Further documentation and source code for IAFD can be found at http://www.udiscover.it/resources/software/.
AgileFD bot
As illustrated in Fig. 3, we formulate phase mapping as a constrained matrix factorization problem. Experimental XRD measurements are represented by a matrix A of size L × N. Each column of A is a vector representing the XRD pattern sampled at L diffraction angles, obtained at one out of N sample locations. The phase mapping problem entails decomposing A in terms of factors W and H, satisfying physics constraints. W encodes the characteristic patterns or structure associated with each pure crystalline phase and H represents the mixing parameters, such as the phases present, their proportions, and any alloying present.
Under the assumed “isotropic” alloying model, an XRD pattern measured as a function of scattering vector magnitude will shift multiplicatively, with, for example, a 1% lattice contraction causing peaks to shift by a factor of 1.01. We convert the multiplicative shift to an additive constant by performing the factorization of logarithmically transformed patterns, making A a convolutive mixture of the bases in W. W and H are naturally non-negative, leading to a convolutive non-negative matrix factorization (CNMF) problem,[Reference Cichocki, Zdunek, Phan and Amari18] which AgileFD performs using lightweight multiplicative coordinate gradient-descent updating rules applied to the logarithmically transformed XRD data.[Reference Smaragdis19,Reference Suram, Xue, Bai, Le Bras, Rappazzo, Bernstein, Bjorck, Zhou, van Dover, Gomes and Gregoire20]
Gibbs and Gibbs-Alloy bots
For a physical system where l elements are deposited, Gibbs' phase rule implies that at most l phases are present at each sample location. Mathematically, this is equivalent to constraining the number of non-zero elements in the vector  $\mathop \sum \limits_m {\bf H}_{*,n}^m $ for any sample location n to be no more than l.
The Gibbs bot uses a Mixed Integer Programming (MIP) approach to find the best activation matrix H that activates no more than l phases per sample point and minimize the reconstruction loss, while holding the phases in W fixed.[Reference Bai, Bjorck, Xue, Suram, Gregoire and Gomes21] Notice that when W is fixed, the columns of matrix H are independent which leads to a decomposition into a smaller MIP program per violated sample point, which finds the best l phases that minimize the reconstruction loss of sample location n, as described further in the Supplementary Information.
The Gibbs Alloy bot extends the Gibbs constraint by reducing the allowed number of coexisting phases allowed by one when alloying is detected, i.e., for those sample locations with varying mean shift parameters compared with nearby locations. This is motivated by the thermodynamic degree of freedom associated with alloying, although instead of identifying details of the alloying behavior, the bot identifies where alloying is taking place and lowers the number of allowable phases by 1 at those composition points.
Phase and Phase Field Connectivity bot
The Connectivity constraint requires that both (i) the sample points where a specific phase is present and (ii) the sample points where each unique set of phases is present form a connected component in composition space, which is determined using the activations of each phase for each composition sample. Specifically, we define a graph G in which sample points are nodes and two nearby sample points in composition space are connected with an edge based on the Delaunay Triangulation. The Connectivity constraint states that the sample locations n for which  $\mathop \sum \limits_m {\bf H}_{n,k}^m $ is larger than zero must form a connected component in graph G, and that phase fields consisting of a unique combination of phases must similarly form a connected component. The Phase and Phase Field Connectivity bot rectifies the connectivity constraints in a lazy and iterative manner. See also Supplementary Information.
Phase Matching and Phase Dimensionality Analysis bots
The Phase Matching bot matches the basis patterns produced by the IAFD module, as part of each solution, to known crystal structure patterns from the ICDD. Fitting an ICDD-derived pattern to each basis pattern (see Supplementary Information for details) provides the additional opportunity to threshold the loss such that if no ICDD-derived pattern sufficiently matches the basis pattern, then the basis pattern may be describing a new phase. The matching of a single ICDD entry to multiple basis patterns in a single solution is an indication that the K (number of phases) of the solution is too large and thus the solution is invalid. Based on this concept, the CRYSTAL planner monitors Phase Dimensionality Analysis results to determine the maximum number of phases to consider for the given system. The CRYSTAL planner runs IAFD configurations with an increasing number of phases until the resulting phase diagrams have an ICDD entry assigned to more than one basis pattern or the valid solution rate becomes vanishingly small, providing automatic determination of the upper bound on the number of phases (basis patterns).
Phase Diagram Clustering and Analysis & Reporting bots
The IAFD bot produces physically meaningful phase diagrams, whose phases are labeled using the ICDD, for the known phases. CRYSTAL runs the IAFD module in parallel (in this paper we report 500 runs for a given number of phases but in general 100 or fewer runs is sufficient) to produce candidate phase diagrams that require automated phase diagram analysis and consolidation. The Clustering bot takes as input the set of solutions produced by parallel runs of the IAFD module and outputs a small set of representative candidate solutions. This bot uses hierarchical agglomerative clustering based on pair-wise phase diagram dissimilarity with automated thresholding. A distance metric between phase diagrams is defined as the across-sample average of the dissimilarity of the pair of phase fields in which the sample resides in the pair of phase diagrams. The phase field for a given sample is defined as the set of basis patterns activated for that sample, which is labeled according to the ICDD phase matching results, and the comparison of the resulting pair of ICDD phase sets is performed under consideration that multiple ICDD patterns may match a given basis pattern within a predefined tolerance. Hierarchical clustering of phase diagram solutions provides (i) 100 representative solutions from the initial runs of IAFD and (ii) a portfolio of unique phase diagrams from the 100 refined solutions where the number of clusters is determined through automated thresholding based on unique sets of ICDD patterns. The set of representative candidate solutions identified by the clustering bot are provided to either the CRYSTAL Planner for solution refinement by the IAFD module, as initial solutions, or to the Analysis & Reporting bot to generate phase diagrams and other visualizations for human-expert inspection.
Pd-Rh-Ta experiments
The Pd-Rh-Ta system was chosen for investigation based on the use of Pd in catalysts for alcohol oxidation in alkaline electrolytes[Reference Bianchini and Shen22] and recent success improving the methanol oxidation reactivity of Pt by combining it with Ta, where surface sub-oxides of Ta appeared to lower the adsorption of CO and thus mitigate catalyst poisoning.[Reference Gregoire, Tague, Cahen, Khan, Abruña, DiSalvo and van Dover23] The 197 XRD and XRF measurements were acquired on four co-sputtered thin film composition libraries: the Pd-Rh-Ta ternary library and one for each binary system (the edges of the composition triangle). The XRF measurements provide the mapping from the physical location on the substrate to the Pd-Rh-Ta ternary composition space, with measurement details and data processing as described in Ref. Reference Gregoire, Dale, Kazimirov, DiSalvo and van Dover24.
The catalytic activity of each of the four composition spread thin films was mapped using the high-throughput fluorescence-based screening, and the results for the Pd-Rh-Ta film are shown in Fig. 1(b) with false-color images of fluorescence intensity showing background-subtracted images from a charge-coupled device camera, as previously described.[Reference Gregoire, Tague, Cahen, Khan, Abruña, DiSalvo and van Dover23,Reference Jin, Prochaska, Rochefort, Kim, Zhuang, Disalvo, Vandover and Abruna25] The N2-sparged aqueous electrolyte contained 3 mM quinine (fluorescent indicator) and 0.1 M potassium triflate (supporting electrolyte). An initial voltage sweep in this electrolyte without methanol was used to identify any regions exhibiting fluorescence, which could be due to film oxidation or oxidative corrosion, prompting our labeling of these composition regions as “unstable.” A solution with the addition of 5 M methanol was then used for screening catalysis of the methanol oxidation reaction. As standard practice, the experiment was repeated three times with fresh electrolyte and similar results were obtained, Figs. 1(b) and 4(g) showing the results from the first of these voltage sweeps. In all of these experiments, the voltage sweep was performed from 0.4 to +0.5 V versus Ag/AgCl at a scan rate of 0.05 V/s. By setting a fluorescence intensity threshold, the onset potential associated with each pixel in the library image was determined and the XRF-based composition map was used to map the onset potential data to composition space, as shown in Fig. 4(g).
Phase mapping for catalyst discovery in the Pd-Rh-Ta system
The Pd-Rh-Ta system poses substantial phase mapping challenges due to strongly overlapped features in its phases' XRD patterns as well as substantial alloying-based peak shifting, which are compounded by experimental noise in the thin-film XRD measurements. CRYSTAL generated a total of 2500 phase maps (500 phase maps per configuration with a number of phases K = 3, 4, 5, 6, and 7). As shown in Table I, 100% of the composition points, phases, and phase fields meet the physical constraints imposed by the algorithmic bots. For comparison, an analogous 2500 runs were performed using AgileFD and NMF, with Table I revealing some constraint satisfaction, but not sufficient to produce any physically meaningful solutions. Comparison was also made with NMFK, a recently reported algorithm that involves clustering of NMF components to identify basis patterns,[Reference Stanev, Vesselinov, Kusne, Antoszewski, Takeuchi and Alexandrov26] which produced a single K = 5 solution for which the constraint satisfaction rates exceed that of NMF and AgileFD but still do not provide a physically meaningful phase diagram where all constraints are satisfied. Comparison of this NMFK solution with that of Fig. 4 is shown in Fig. S1, revealing a substantially different interpretation of the data.
Table I. Comparison of constraint satisfaction for solutions generated by different algorithms.

For each number of basis patterns (K), 500 random initializations were used to generate a set of solutions, which were then evaluated for compliance with four physical constraints. The percentage of samples (Gibbs and Gibbs-Alloy), percentage of phases (Pure phase connectivity), and percentage of phase fields (Phase field connectivity) are shown assuming a threshold value of 10−6 on phase activations (values of H). While AgileFD and NMF solutions satisfy constraints for some of the composition points despite the lack of enforcement, none of the resulting phase diagrams meet all requirements. NMFK produced a single K = 5 solution, which satisfies constraints better than NMF and AgileFD but similarly does not provide physically meaningful phase diagrams where all constraints are satisfied. Due to its constraint enforcement, CRYSTAL produces solutions which meet all of the physical requirements.
CRYSTAL continued processing of its initial 2500 phase diagrams via the Phase Dimension Analysis bot, which determined that the system contains no more than K = 6 phases and passed 1639 valid solutions to the Clustering bot, which identified 100 representative solutions using hierarchical agglomerative clustering based on pairwise phase diagram dissimilarity. After further refining the 100 solutions using the IAFD bots, the hierarchical Clustering bot, using automated thresholding, identified 20 representative phase diagrams that represent the span of different data interpretations. These phase diagrams were passed to the Analysis & Reporting bot to produce phase diagram visualizations and composition maps of the phase fields and lattice constant shifts, which are readily interpretable by an expert [Figs. 1(d)–1(f) and 4]. The expert user analyzed and compared the 20 candidate phase diagrams, eliminating 15 candidate phase diagrams since they do not meet subtle criteria based on prior knowledge specific to the Pd-Rh-Ta system. In this case, this prior knowledge was from a previous analysis of the Pd-Rh binary line where a single face centered cubic (fcc) seven-phase diagram was analyzed. While this prior knowledge was used to screen candidate solutions in the present work, this type of knowledge can be used to initialize and/or constrain IAFD, as described previously for AgileFD.[Reference Smaragdis19,Reference Suram, Xue, Bai, Le Bras, Rappazzo, Bernstein, Bjorck, Zhou, van Dover, Gomes and Gregoire20] Other types of prior knowledge may also be incorporated, which may require the development of new algorithmic bots, another motivation for building CRYSTAL as a network of bots that can be adapted for specific research tasks and expanded to incorporate new modes of reasoning. After applying this filter, the expert user selected the final phase diagram remaining five phase diagrams, which we note could have also been automatically selected via a voting method since the selected phase diagram represents the hierarchical cluster containing 17 refined solutions, more than any other remaining cluster [Fig. 4(c)].
In addition to identifying complete solubility of Pd and Rh into the fcc structure, this phase diagram also indicates substantial alloying in the intermetallic phases [Figs. 4(d)–4(f)]. For each phase, the lattice constant variation with composition matches expectations based on the metallic radii of the elements. For the three non-cubic phases, the observed <1% lattice expansions are well modeled by the isometric peak shifting model. The hex-Pd3Ta phase exhibits the largest alloying extent of these phases, with up to 30 at.% of the smaller Rh and up to 35 at.% excess of the larger Ta leading to lattice expansions <0.7%.
CRYSTAL's phase diagram enabled insightful interpretation of the catalytic activity in the Pd-Rh-Ta system. Figure 4(g) shows the result of a high-throughput screening of the Pd-Rh-Ta libraries for methanol oxidation, a critical reaction for direct methanol fuel cells traditionally addressed with Pt-based catalysts.[Reference Liu, Song, Zhang, Zhang, Wang and Wilkinson27] While many of the compositions exhibit inactivity or instability under the reaction conditions, selected Pd-Rh-Ta compositions exhibit an activity that is on par with the best Pt-based catalysts evaluated by this high-throughput method. On the Rh-Ta binary line, the orth-Rh2Ta phase provides the highest catalytic activity. The methanol oxidation onset potential is further lowered by 0.2 V to approximately 0.5 V versus RHE via mixing orth-Rh2Ta with an alloy of hex-Pd3Ta at a composition Pd0.17Rh0.33Ta0.5. Such combinations of catalyst materials have recently been proposed for overcoming historical barriers that limit catalyst performance for multi-step reactions,[Reference Andersen, Medford, Nørskov and Reuter28,Reference Casado-Rivera, Gál, Angelo, Lind, DiSalvo and Abruña29] and indeed the activity of this multi-intermetallic catalyst is quite remarkable. The best thin film catalysts for methanol oxidation that have been identified by this technique include the Pt-Ta intermetallics with an onset potential of 120 mV versus Ag/AgCl,[Reference Gregoire, Tague, Cahen, Khan, Abruña, DiSalvo and van Dover23] and a family of Pt-based fcc alloys including binary alloys with Ru, In, Sn, and Zn, which have onset potentials between 0 and 40 mV versus Ag/AgCl.[Reference Tague, Gregoire, Legard, Smith, Dale, Hennig, DiSalvo, van Dover and Abruña30] The Pd0.17Rh0.33Ta0.5 catalyst is the only known Pt-free catalyst with onset potential in this range. The onset potential of 0.5 V versus RHE is also within the range of onset overpotentials observed with Pd-based catalyst in alkaline electrolytes,[Reference Bianchini and Shen22] and given the inactivity of Pd and Rh in the weak acidic electrolyte used in our experiments, the Ta-based intermetallics appear to enable the activity at lower pH, opening a new direction for catalyst development and a pathway for the further development of Pt-free catalysts.
The discovery of this multiphase catalyst highlights both the power of high-throughput materials science and the effectiveness of AI techniques for integrating multiple knowledge sources to provide meaningful solutions. By teaching CRYSTAL to reason about phase diagrams, we have for the first time automated the generation and exploration of alternative data models, demonstrating the ability of AI systems to accelerate phase mapping and providing a novel data-interpretation approach for materials sciences and beyond.
Supplementary material
The supplementary material for this article can be found at https://doi.org/10.1557/mrc.2019.50
Acknowledgments
This work was supported by NSF awards CCF-1522054 and CNS-0832782 (Expeditions), CNS-1059284 (Infrastructure), and IIS-1344201 (INSPIRE); ARO awards W911NF-14-1-0498 and W911NF-17-1-0187; AFOSR Multidisciplinary University Research Initiatives (MURI) Program FA9550-18-1-0136, Toyota Research Institute award; and US DOE Award No. DE-SC0004993. Use of SSRL is supported by DOE Contract No. DE-AC02-76SF00515. Use of CHESS is supported by the NSF award DMR-1332208. The authors thank A. Mehta, D. G. Van Campen, M. Tague, and D. Dale for assistance with data collection.
Author contributions
The authors’ contributions are as follows: C.P.G., R.B.vD., and J.M.G. conceived and managed the project. C.P.G. conceived CRYSTAL'S multiple knowledge source approach. J.Ba., JBj., C.P.G., and Y.X. designed the bots' algorithms. J.Ba., C.P.G., J.M.G., B.H.R., and Y.X. designed the Diagram Rendering bot. J.Ba. implemented the IAFD bots, phase matching bot, and phase analysis bot. B.H.R. implemented the diagram rendering algorithm, and Analysis & Reporting and Visualizer & Interface bots. S.K. performed the comparison with NMFK. R.A.B. assisted with programming in several components of CRYSTAL. R.B.vD. and J.M.G. acquired Pd-Rh-Ta data, and S.K.S. and J.M.G. acquired Nb-Cu-V data with assistance as noted in the Acknowledgments. S.K.S. and J.M.G. served as human experts for both systems. C.P.G. and J.M.G. were the primary authors of the manuscript. S.A., J.Ba., J.Bj., C.P.G., J.G.M., B.H.R., and Y.X. were the primary authors of the Methods and Supplementary Information.
Data availability
The raw data for the Pd-Rh-Ta along with CRYSTAL's results and reports will be available at http://www.udiscover.it/resources/data/. Further documentation and source code for IAFD can be found at http://www.udiscover.it/resources/software/.
Author information
The authors declare no competing financial interests. Correspondence should be addressed to gomes@cs.cornell.edu and gregoire@caltech.edu.