Archaeological field survey frequently records large amounts of data from three basic groups of variables: location, context, and material evidence. The combination of these data in a well-articulated recording system can be challenging, depending on factors such as how remote survey contexts are, the necessity for onsite analysis of artifacts, or the specific goals and financial volume of each project. Even more challenging is the fact that, since most current projects tend to incorporate international and multidisciplinary teams, rapid data sharing and collaborative use of survey data are becoming more and more important aspects to consider (Delson et al. Reference Delson, Harcourt-Smith, Frost and Norris2007; Snow et al. Reference Snow, Gahegan, Giles, Hirth, Milner, Mitra and Wang2006).
Digital approaches to archaeology have become increasingly common and have solved some of these problems, making use of innovations in spatial databases and cloud services for storing and sharing data, mobile devices for data collection (Averett et al. Reference Averett, Gordon and Counts2016; Cascalheira et al. Reference Cascalheira, Gonçalves and Bicho2014), and state-of-the-art software interfaces for designing inclusive and reliable data collection and management workflows (Reed et al. Reference Reed, Barr, McPherron, Bobe, Geraads, Wynn and Alemseged2015). However, while a great part of modern mobile collectors (i.e., handheld computers, smartphones, tablets, etc.) are relatively low-priced and user-friendly devices, data repositories and software solutions can be rather expensive or, in the case of free open-source options, complex to manage and integrate, requiring skills in programming that most researchers do not possess. Several solutions have been adopted in this context (Austin Reference Austin2014): some projects hire programmers to develop custom software (Fee et al. Reference Fee, Pettegrew and Caraher2013), others simply adopt digital mobile technologies utilizing off-the-shelf applications to convert preexistent databases for use on mobile devices (e.g., Ellis and Wallrodt Reference Ellis and Wallrodt2011; Houk Reference Houk2012), and others make use of open-source platforms to modify prefabricated data forms or design new ones (e.g., Smith and Levy Reference Smith and Levy2012).
The solution outlined in this paper fits into this last category, showing the application of a system based on Google freeware services. It is composed of two self-authored Android mobile applications with fully customizable configurations that make use of the built-in chips and input/output capabilities of smartphones and tablets to gather data and automatically store and share it in a web database service called Google Fusion Tables.
This particular system was developed in the context of a recent survey project designed to locate new Stone Age sites in Mozambique (Bicho et al. Reference Bicho, Haws, Raja, Madime, Gonçalves, Cascalheira, Benedetti, Pereira and Aldeias2016), but its application to survey projects with different chronologies or geographies is perfectly viable through customization.
In Mozambique, most of the fieldwork our team has done since 2011 involves the identification and characterization of hundreds of surface lithic scatters, among which thousands of stone tools needed to be analyzed due to transport limitations and, in some areas, very strict no-collect policies. Thus, a mobile digital recording system was required that would allow us to (1) register information of each scatter, including context description and geographical coordinates; (2) do onsite lithic analysis using custom data entry forms and allowing direct input from digital calipers; and (3) rapidly organize, visualize, and share survey data with team members on a daily basis.
Our solution is an updated version of the approach McPherron et al. (Reference McPherron, Dibble and Olszweski2008) developed for the Abydos Survey for Paleolithic Sites project in Egypt (Olszewski et al. Reference Olszewski, Dibble, Schurmans, McPherron and Smith2005). Back then, the authors established a system based on PocketPC handheld computers, running ArcPad with customized data entry forms and directly connected to GPS units through a serial port. The handhelds were also used for onsite analysis of the lithic materials using a version of their well-known E4 software (McPherron and Dibble Reference McPherron and Dibble2003a) and digital calipers, connected through a secondary serial port, to record measurements from the stone tools.
Due to a series of technological advances, we were able to transpose a similar type of approach to Android smartphones, reducing the weight and amount of hardware taken to the field and optimizing the management of data after collection. Below we describe the hardware and software used in our system, as well as some of its practical implications and limitations when using it in the field.
HARDWARE SPECIFICATIONS
The choice of hardware to integrate our system had to fulfill a series of requirements related to (1) the type and ways in which the information would be recorded, (2) challenges posed by the survey context, and (3) the compatibility with software interfaces, whose development was limited by the programming knowledge of team members. This latter point was very important since, as explained in the next section, it restricted us to the use of Android-powered devices.
To meet the first set of requirements, we needed to be able to record a series of numerical and text variables on each context (including geographic location), to take photographs, and to record artifacts’ metric information utilizing digital calipers with direct USB transfer capabilities. Most Android devices, either smartphones or tablets, are equipped with relatively good-quality digital cameras, GPS chips, and USB ports for data transfer and charging. Digital cameras were used not only to acquire photographs from the contexts and/or artifacts but also because we used barcode labels to link artifacts (in those cases where we had permission to collect materials for further analysis) to a site ID (Dibble et al. Reference Dibble, Marean, Shannon and McPherron2007).
One of the main concerns was the quality of GPS data obtained from the chips of mobile devices such as smartphones. We tested the GPS chips of several brands and models of smartphones and the results were rather precise, with a level of accuracy that, when compared with Trimble® GeoXT™ data, we considered adequate for recording the location of lithic scatters (for results, see Cascalheira et al. Reference Cascalheira, Gonçalves and Bicho2014).
Finally, USB capabilities required specific configurations that we had to take into account to be able to send direct numerical information from digital calipers to the device. Standard USB uses a master/slave architecture in which a host acts as the master device for the entire bus, and a USB device acts as a slave. Thus, in using standard USB ports, devices must assume one role or the other. In the case of computers, for example, these are generally set up as hosts, while printers, mice, or keyboards normally function as slaves. Some smartphones and tablets are implemented only with slave functionality to allow easy transfer of data to and from computers. Such inconvenience is solved by the use of a different technology, called USB On-the-Go (OTG), which recognizes that a device can perform both master and slave roles (USB Implementers Forum 2016). Not every Android device supports USB OTG, because the manufacturer has to enable it in the phone or tablet's kernel (i.e., the first program loaded on start-up that handles the rest of start-up as well as input/output requests from software, translating them into data-processing instructions for the central processing unit). Since we were trying to use Android devices as masters to receive and process information from external measuring instruments, the USB OTG component was a very important feature.
We used Mitutoyo calipers with a Mitutoyo USB Input Tool Direct cable. This cable works by being automatically recognized as a Human Interface Device (HID) keyboard when connected to a USB port without needing special drivers or software requirements. This way, the values displayed on the caliper can be sent to the computer just by pressing a small data switch, creating the same result as that of typing numbers using a standard keyboard. Since the USB connector in these cables is a standard one, and most mobile devices have only micro-USB ports, we also needed OTG-enabled micro-USB-to-USB dongles to connect the calipers with the devices. Fortunately, and as expected, when the caliper is connected to most devices, these recognize the former instantly as a keyboard and, thus, it is only important to choose within the operative system that this is the “keyboard” we would like to use every time it is connected. However, once the caliper is connected and selected as the main keyboard, it has specific practical implications/limitations, which we present in detail below.
Theoretically, the connection between the calipers and the devices could be made using Bluetooth. There are very few solutions for this on the market, i.e., portable units that can be used to connect USB keyboard-like instruments and transmit data through a wireless signal. The main problem with these devices is one of battery life, most of them requiring constant charging due to small battery capacity, while others use dry cell batteries that, depending on the use, can be emptied very fast.
The second set of requirements we had when choosing hardware was related to the circumstances of doing fieldwork in relatively remote and adverse field conditions in Mozambique. We were concerned with two factors: power and the sturdiness of the equipment.
We usually camp or stay in rented cabins, and in both situations we have access to power during the night. During the day, however, it is often impractical, due to the distances involved, to go back to the camp and recharge batteries. Although most recent smartphones and tablets have large battery capacities that can last for several hours, this depends on the type and size of tasks performed. Fortunately, there is a wide range of portable power supplies that can be used to charge smartphones and tablets. We ended up equipping surveyors with portable powerbanks to recharge the devices.
We also needed devices sturdy enough to resist shock, falls, dust, temperature, and water. While there are several brands that sell especially rugged devices, particularly resistant to most of these conditions, those tend to be expensive and have below-average hardware specifications. Sometimes it is even cheaper to buy an entirely duplicate set of hardware than it is to buy the specially protected hardware. We opted, however, for equipping our devices with protective cases and screen protectors that are significantly cheaper and can prevent a certain amount of damage. Because all ports in the device need to remain uncovered, dust or water can potentially cause damage. Careful use and sporadic cleaning of the device can prevent major problems. The same holds true for the digital calipers, since grit can make them difficult to slide back and forth and can scratch the scale and display surfaces (McPherron and Dibble Reference McPherron and Dibble2003b).
The final set of requirements was related to the characteristics of the software and programming tools used for designing our data management workflow. Apple devices have been preferred for archaeological fieldwork (see, e.g., Fee et al. Reference Fee, Pettegrew and Caraher2013; Motz and Carrier Reference Motz, Carrier, Earl, Sly, Chrysanthi, Murrieta-Flores, Papadopoulos, Romanowska and Wheatley2013; Reed et al. Reference Reed, Barr, McPherron, Bobe, Geraads, Wynn and Alemseged2015). Android equipment, on the contrary, has been much less utilized, but does offer some major advantages, the most relevant of which is, in our opinion, price. There are hundreds of devices on the market, from several brands, that are fairly inexpensive and have enough hardware characteristics to hold most of the tasks required for archaeological fieldwork. On the other hand, most iPhone or iPad models support only limited types of USB OTG devices, which are sold especially for this purpose. We are not certain, for example, that digital calipers would work with Apple closed-system devices as easily as with Android devices.
In the specific case of our apps, the basic needs, other than the components mentioned above, were a free memory space of approximately 20MB for app installation and a bit more to hold the database file (usually less then 1MB) and the photographs, whose size depends on the megapixels and file format that can vary greatly among devices. Even if more space was required, most Android smartphones support the integration of micro SD cards, which today can hold up to hundreds of gigabytes.
Overall, we ended up putting together a surveying set of hardware that was composed of the elements shown in Figure 1. We ultimately chose smartphones over tablets for the following reasons: (1) most of our team members already had a usable smartphone (sometimes one that was not being used for a while but with adequate hardware specifications); (2) the portability and hardware specifications of smartphones were sufficient to run our custom software; and, finally, (3) all smartphones allow mobile and internet communication (unlike tablets that may not have a SIM card slot) and thus can be used to establish contact among team members whenever needed, obviating the use of walkie-talkies.
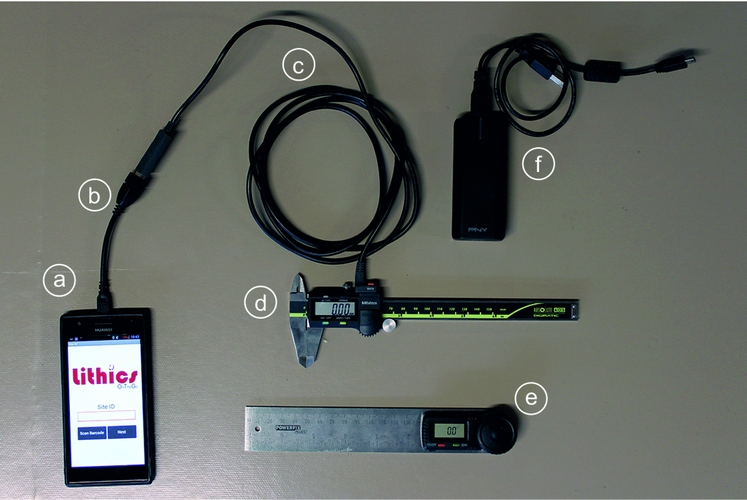
FIGURE 1. Equipment used during survey: (a) mobile device; (b) USB OTG cable adaptor; (c) Mitutoyo USB input tool direct cable; (d) digital caliper; (e) digital goniometer; (f) powerbank. Photograph by João Cascalheira.
SOFTWARE
App Creation and Customization
There are currently a large number of platforms to create applications for mobile devices. Very few, however, are cross-platform (i.e., can create apps for Android, iOS, or Windows simultaneously). Apple users, for example, are able to create mobile Apps by using the FileMaker Pro software to export files to FileMaker Go and use them on iPhones and iPads (see, e.g., Motz and Carrier Reference Motz, Carrier, Earl, Sly, Chrysanthi, Murrieta-Flores, Papadopoulos, Romanowska and Wheatley2013). This, however, is not a freeware solution and the software is rather expensive.
For Android OS, most of the platforms that offer customizable (but only to a certain extent) software are also pricey (e.g., ArcGIS Survey123, SurveyCTO, doForms), but there are at least two freeware solutions—the Open Data Kit (ODK) and the App Inventor, both with very different characteristics and goals.
ODK is an open-source, out-of-the-box set of tools intended to help researchers build forms, collect data on mobile devices, and send the data to a server where they can be extracted in useful formats (Brunette et al. Reference Brunette, Sundt, Dell, Chaudhri, Breit and Borriello2013; Hartung et al. Reference Hartung, Lerer, Anokwa, Tseng, Brunette and Borriello2010). With this solution, users can use XML files to choose among more than a dozen question types, including the incorporation of multimedia, and data entry restrictions can utilize skip logic to supply only applicable data fields. This is a rather complete set of tools and fully compatible with most Google services (Austin Reference Austin2014).
App Inventor, by contrast, is not a ready-made solution, unlike ODK, and it was not specifically developed for the creation of forms or to be used as a tool for data collection. It was created by Google in 2010 and closed down very shortly after, to be rescued by the Massachusetts Institute of Technology (MIT), which renamed it MIT App Inventor. A beta, but fully functional, second version of this platform can be found at http://ai2.appinventor.mit.edu/. MIT App Inventor is a freeware application that runs in a web browser and lets users create mobile apps for an Android system without having to write the traditional software programming codes. This is done by using blocks of preestablished controls, tools, and components that can be combined to perform actions using the internal capabilities and hardware of the smartphone or tablet, but also other available apps (Cascalheira et al. Reference Cascalheira, Gonçalves and Bicho2014) (see Figure 2 for some examples). Although limited by the progress made by the developers, the MIT App Inventor offers an array of programming options combined in groups of actions, of which four are of particular relevance for our purpose and the example presented here: Layout/Interface (used to set the visual interface of the app), Sensors (used to communicate with several sensors of the device), Storage (allowing users to store data locally or online), and Connectivity (used to call different apps installed in the device or communicate via Bluetooth with other devices).
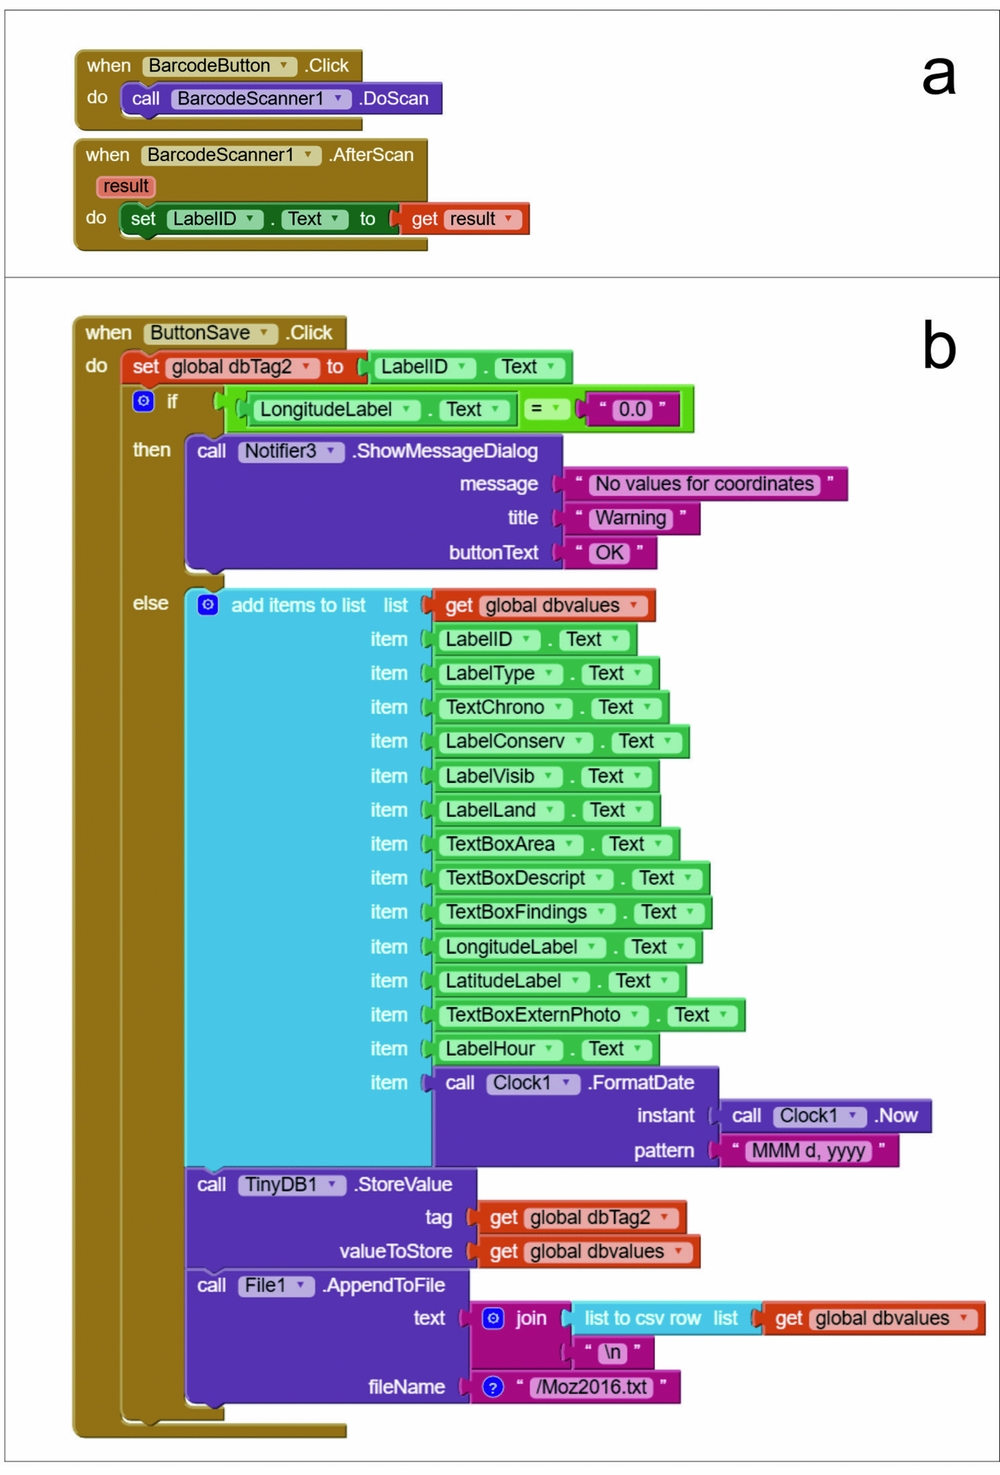
FIGURE 2. Examples of programing blocks in MIT App Inventor: (a) when clicking a button, the app opens the barcode scanner and, after scanning, it will fill a text box with the barcode text; (b) a more complex setting in which, after clicking a button, the app checks whether the longitude is not equal to 0 (if that is the case, then a notifier will be displayed) and gathers information from a series of text boxes, converting it into a list, storing those values in a TinyDB component, and appending it to a .txt file in the device internal memory.
Since it is not the objective of this paper to show how to make an app within MIT App Inventor—for that, a number of online tutorials and textbooks are available (see, e.g., Kloss Reference Kloss2012; Walter and Sherman Reference Walter and Sherman2014; Wolber et al. Reference Wolber, Abelson, Spertus and Looney2011)—we briefly describe how we used the tools provided by this platform to create mobile applications that fulfilled our recording needs during field survey in Mozambique.
The Apps
Our software requirements for survey in Mozambique were to be able to (1) record site characteristics, including latitude/longitude values and photographs of the surroundings, and associate that information with some of the materials recovered; (2) perform analysis of stone artifacts using both qualitative and quantitative descriptive variables, the latter read by external devices; and (3) save all these data in a file/database that would be easily accessible for data management and sharing with team members and other researchers.
For this, and keeping in mind that requirements (1) and (2) could exist separately for other projects, we developed two apps that were the basis for the workflow used in our approach. Both are available at Mendeley Data (Cascalheira Reference Cascalheira2016), including the .apk files to install on Android devices and the .aia files to open in MIT App Inventor and customize the apps. In fact, although some of the characteristics of these apps are very specific to our own needs in the field, they are fully customizable using the MIT App Inventor platform. Detailed instructions of how to access the platform and change the properties of the configuration files are available as part of this article's supplemental materials (Supplemental File 1). No software programming technical skills are needed, but some persistence in dealing with testing complex relations between user inputs and apps outputs is essential.
The first app, called ArcheoSurvey (Figure 3), records the site location and the site's characteristics. The app is composed of two different screens only: one initial screen where the surveyor is allowed to choose between different save modes (i.e., online or offline) to quickly check position on Google Maps and to click a button to start the recording of a new site, and another data entry screen where all the site information is recorded.
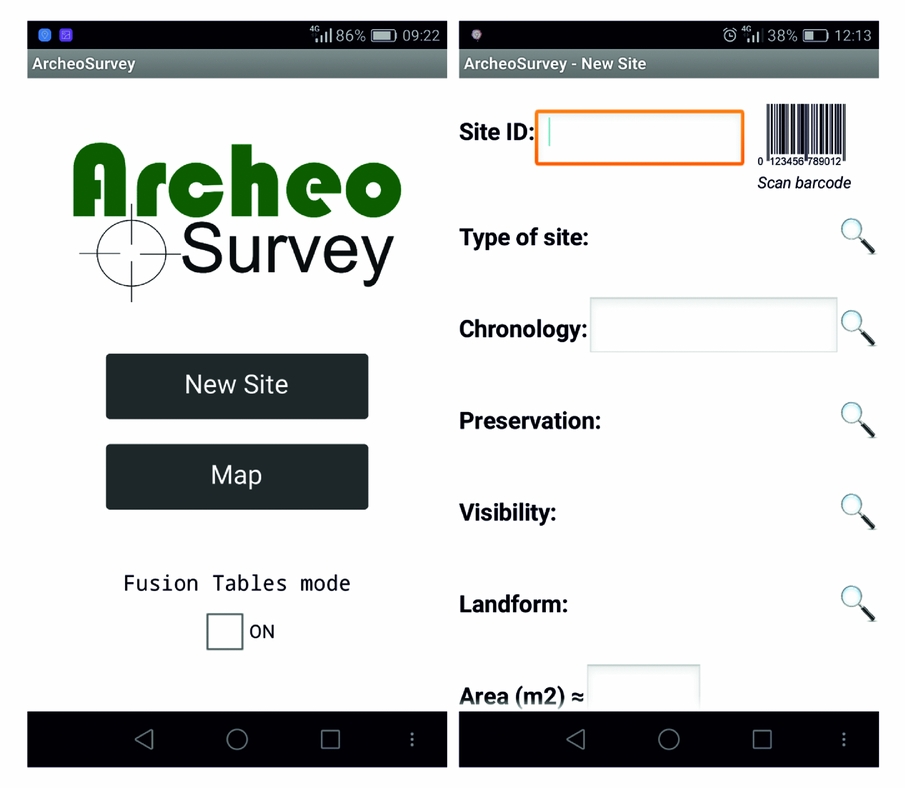
FIGURE 3. Screenshots of the ArcheoSurvey App first and second screens. The second screen shows some of the variables available for site description.
In this screen, the first component is a barcode reader button that is used by the surveyor to read the next preprinted barcode label available, attributing a site ID to the location. This label is used for identifying the materials that are collected. A barcode app is needed for this step, but there are plenty of free apps in Google's Play store that can be installed. The second component is a series of variables that are either filled using preconfigured menus or text fields to characterize the site in question. These include, among others, visibility, chronology, landform, or approximate area of material dispersion. The geographical location is the third module, and values for longitude and latitude are obtained by pressing a button that activates a function that communicates with the GPS chip of the smartphone/ tablet, asking for the current coordinates and the error associated with those. In the current configuration, the error is not kept in the database and is merely informative, appearing in the form of a notifier box so that the surveyor can make decisions on whether to accept or reject the coordinates. Bad weather conditions, dense vegetation, or short time of GPS connection after app initialization can all cause large errors, each of which may, or may not, be solved using different strategies. In this component, the surveyor can also check position using a Google Maps button that opens the maps application and automatically shows the current survey position. Unfortunately, this is one of the elements that is dependent on internet connection in our apps, since Google Maps is fully functional only while online. There are a couple of work-arounds to this problem, however. The simplest solution would be to cache Google Map tiles of the survey area before going to the field. This is fairly easy to set within the Google Maps app, but, depending on the initial zoom, it will be impossible to zoom in as much as when using it online. Other solutions might include the use of a static map of the survey area or using other open-source mapping services offering offline solutions, to connect with the app, but these are not easily accomplished in the current version of MIT App Inventor. The fourth component of the app is a photography button that opens the camera application, allowing us to take a photograph, save it, and save the path to the photo on a text box within the ArcheoSurvey app. This text box is editable, so that, if using an external camera, the surveyor can take note of the photo(s) number(s). In our own work, we tend to use at least one photo from the smartphone camera as a reference for the site and to include in the general database.
The final section of the app is basically a save data button. This button is programmed so that all data filled in the previous fields, in addition to date and hour information, are added to specific files. If using the online mode, chosen in the opening screen, data will be simultaneously saved to two different files: a CSV (comma-separated values) file, stored in the internal memory or memory card of the device, and a Google Fusion Table online database whose path is previously determined in the App Inventor file configuration (see Supplemental File). Most of the time—incredible as it may seem—we have a good enough internet signal during our fieldwork in Mozambique, but for other projects the online solution will not work and the surveyor should choose to save data to the local CSV file only.
While it is fairly simple to introduce text and numeric records for these files, the same is not true for the photographs. This is a limitation of both the MIT App Inventor and the Fusion Tables. The former does not have a direct way to send files to the cloud or a webserver; the latter incorporates images in the database only if they have a valid URL. Further, images must be viewable without having to sign in to a cloud user account. We find that the best solution for this is to use a webserver to store the images and use its URL to display them within the Fusion Table. We are currently using the ICArEHB website server to do this, uploading the files using an FTP (File Transfer Protocol) extension for MIT App Inventor developed by Taifun from Pura Vida Apps (www.puravidaapps.com). This allows photographs to be transferred via the internet from our app into the webserver using basic FTP login information. When working offline, the photographs will, of course, have to be transferred manually from the smartphone/table internal memory or card to the server.
The use of the server allows us to specify, in advance, the path to the photograph that will be used by the Fusion Tables database to display it. However, we had to make a small adjustment in the app so that each time the photograph path is saved within ArcheoSurvey, the path already contains the URL prefix (e.g., http://www.icarehb.com/.../IMG985.jpg) that will lead Fusion Tables to the ICArEHB website folder where the photograph is kept.
After the data is successfully saved, a dialog box asks the surveyor if the lithics from that location will be analyzed onsite. If yes, it automatically opens our second app, named LithicsOTG, where lithic data can be recorded. The communication between apps also allows a direct transfer of the site ID so that there is no need for the surveyor to reread that site's barcode label.
LithicsOTG (Figure 4) was developed to transpose to an Android operative system an analysis freeware Windows-only software that we, as well as other researchers, have been using in our laboratory: the E4 program (available at http://www.oldstoneage.com/software/e4.shtml). This program allows faster and more reliable data entry due to the possibility of defining conditional statements that allow variables to be skipped based on values entered for previous variables. So, for example, if a distal fragment of a flake is chosen in the technological class variable, then the software will skip all variables related to the characteristics of the platform of the blank. Our app applies the same concept, making use of the “if-then” control blocks in MIT App Inventor so that if a value is true, then the app will skip (or not) the following variable.

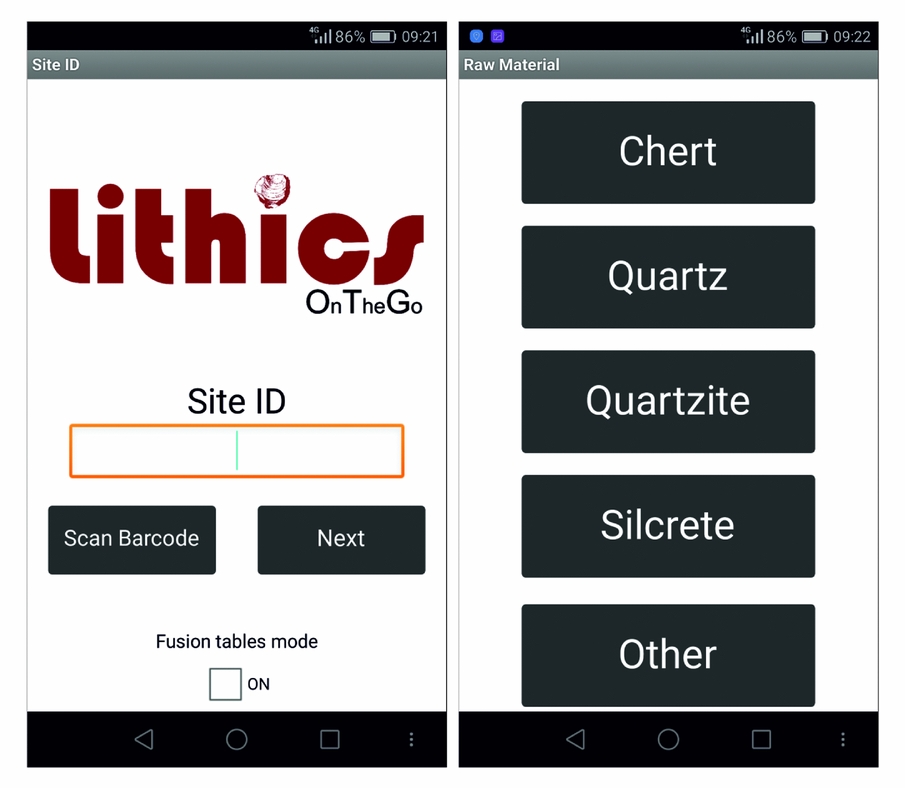
FIGURE 4. Screenshots of the LithicsOTG App. The screen to the right gives an example of how the user can choose raw material options using one of the buttons.
Overall, the app is composed of a series of screens, each corresponding to a variable that presents either menu items to choose from (Figure 4) or numeric input boxes to insert measurements taken on each individual artifact. This was done using the digital calipers connected via USB to the smartphones. But in the case of researchers who use standard calipers, the measurements can be inserted using the device digital keyboard, which will pop up when the insert box is selected. In the case of angle measurements, though, since we were using digital goniometers without USB connection, a number pad was included to substitute for the pop-up keyboard. This is necessary because when a caliper is connected to the smartphone as an external “keyboard,” each time that the internal keyboard is needed, the settings need to be changed in the device configurations, potentially leading to wasted time during analysis.
This version of the app also includes a variable that is an auto-increment ID that, by numbering each analyzed artifact, makes possible the connection between data and photographs that might be taken with an external camera. During survey, we used external DSLR cameras to photograph lithic materials because they allow more detailed artifact images, but also because this task can be accomplished by another person in the course of lithic analysis, without disturbing the specialist during the analysis. Following Fisher et al. (Reference Fisher, Albert, Botha, Cawthra, Esteban, Harris, Jacobs, Jerardino, Marean and Neumann2013), photographs were taken by placing each artifact over an ISO A5-size laminated card stock page that had a 1 cm grid and 50% gray, 18% gray, black, and white color targets to adjust for color cast and contrast in digital image postprocessing. This page also has a small section to annotate the site's reference and the automatically created artifacts’ IDs.
The final screen on the LithicsOTG app is a Boolean variable in which the surveyor needs to choose whether a photo is (or is not) taken of that specific stone tool. After that, a dialog box will appear asking whether another artifact will be analyzed for that site and the app will go back to the auto-increment artifact ID screen. This step, as in the ArcheoSurvey app, adds data to a CSV file located in the internal memory of the phone and, if online mode is on, to a Fusion Tables file.
DATA MANAGEMENT AND SHARING
Whether using the online or offline mode, data gathered using both apps are backed up nightly onto a computer during fieldwork. Text versions of the CSV files are kept, and data is also imported into MS Excel spreadsheets as a backup. The structure of the CSV is a basic flat table in which columns are variables and rows are the recorded cases, and thus it is fairly easy to import. If using the Fusion Tables transfer mode, each one of the two tables (sites and lithics) is inspected for errors. When not using the online transfer mode, all data is imported into the corresponding Fusion Table from the CSV file.
Google Fusion Tables is a cloud-based service for data management and integration, enabling users to upload tabular data files (e.g., spreadsheets, CSV, KML). Some people call it a “spreadsheet on steroids” since, besides being able to gather data in real time and store it in the cloud (i.e., Google Drive), it provides several ways to filter, aggregate, and visualize data (e.g., charts, maps, and timelines) (Figure 5), as well as to integrate data from multiple sources by performing joins across tables that may belong to different users (Gonzalez et al. Reference Gonzalez, Halevy, Jensen, Langen, Madhavan, Shapley and Shen2010). Users can keep data private, share it with a select set of collaborators, or make it public and traceable by search engines. Journalists have taken serious advantage of Fusion Tables, and there is a large array of examples provided at the Fusion Tables example gallery (see https://sites.google.com/site/fusiontablestalks/stories).
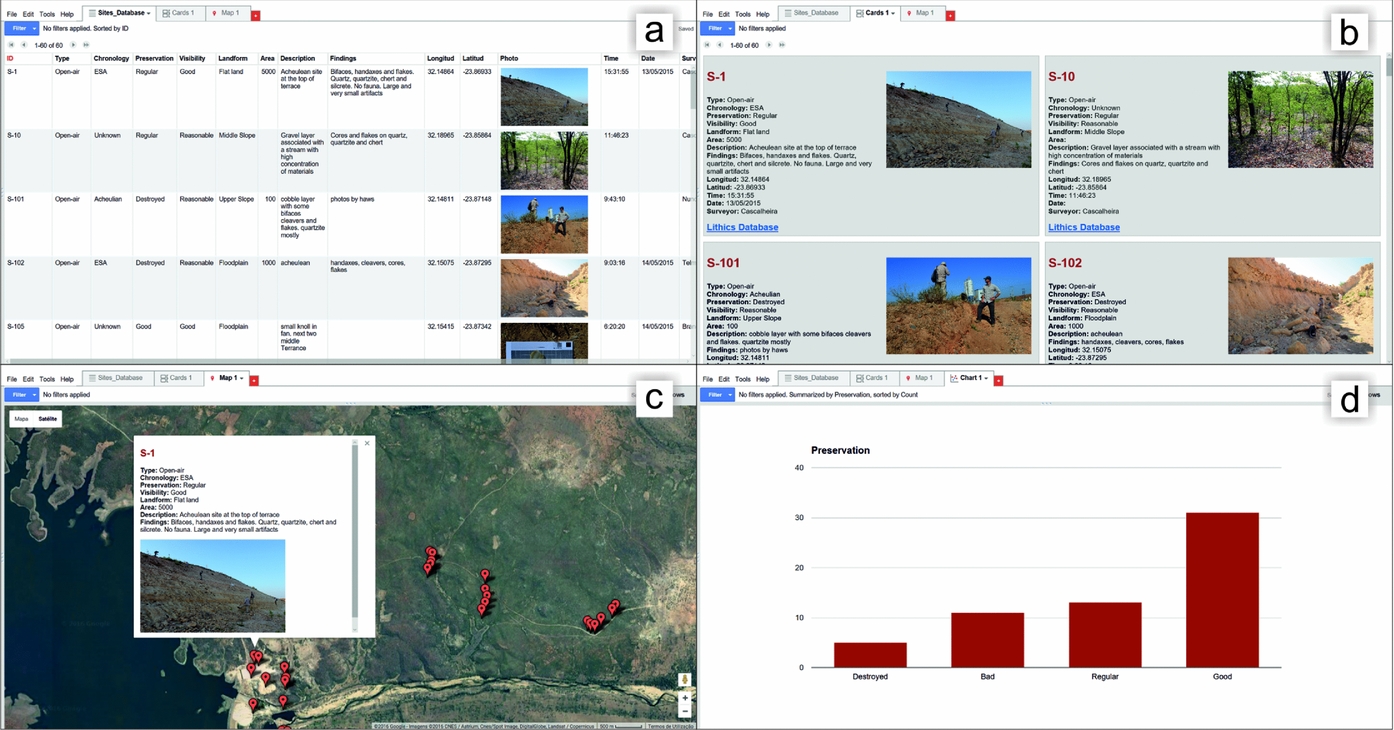
FIGURE 5. Google Fusion Table screenshots representing some of the most important components of the database platform: (a) database sheet; (b) representation of each entry in the database as an individual card, with all the information of each archaeological site, including the photograph and the link to the lithics database; (c) representation of the location of archaeological sites in a satellite map; after clicking on each of the markers on the map, a pop-up window will also show the specific information of that specific location; (d) example of a chart representing the counting of one of the variables recorded during field survey. A full interactive table example can be consulted at https://www.google.com/fusiontables/DataSource?docid=1JOH9MI4NIJpKC0-wOdHZTnxdAjeAiwSNlaORS7Ys.
The visualization tools are one of the most important components of Fusion Tables, particularly those regarding spatial information. Users can upload tables with street addresses, or coordinates of points, lines, or polygons, and Fusion Tables will automatically render these tables as map layers (Figure 5c). In the case of archaeological data, and using the example of Mozambique, once a site's data is inserted into the table, it is extremely easy to create a map with the distribution of sites, or a chart with counts of sites in different states of preservation discovered throughout the field season (Figure 5d). Fusion Tables also supports the rendering of heat maps. It is very useful to see a map colored according to the density of features in space (Gonzalez et al. Reference Gonzalez, Halevy, Jensen, Langen, Madhavan, Shapley and Shen2010). For those who need extra elements, Google Fusion Tables also allows shapefiles to be imported and represented on the map with other data, using the tool available at http://shpescape.com/ft/.
Another feature of Google Fusion Tables that stands out for our own work is the ability to merge tables according to a specified primary key. We sometimes need to create maps showing the distribution of particular classes of lithics across the survey paths. To do this, we simply merge the sites table with the lithics table, using site ID as primary key, and Fusion Tables creates a merged table that can be manipulated to create the desired map.
Given these properties, and the full integration with apps created in MIT App Inventor, we found Fusion Tables the best platform to manage our Mozambique survey data (although other uses have been applied by our team—see Gonçalves et al. [Reference Gonçalves, Raja, Madime, Cascalheira, Haws, Matos and Bicho2016]). The rapidity with which we can render maps and produce graphs and tables while in the field has been of great help for making decisions on survey strategies.
Although data management, sharing, and visualization are fairly easy in Fusion Tables, saving data from our apps is a more laborious task because you first need to acquire a special Google email address. This service account acts as a virtual user and together with its key-file allows users to edit a specific Fusion Table without having to log in with their own Google accounts. Using this email, the URL, and the ID of the Fusion Table, it is relatively easy to set the apps to send out information (see Supplemental File for more details).
PRACTICAL IMPLICATIONS AND LIMITATIONS
The use of the components described above has allowed us to record hundreds of locations and analyze thousands of lithic artifacts over the years. No major, unsolvable failures of equipment and software have been registered so far, and we feel that the incorporation of an entirely digital survey system has significantly improved our efficiency in the field. While we agree with some of the criticism recently addressed to onsite artifact analysis (Heilen and Altschul Reference Heilen and Altschul2013), our approach to lithic analysis, taking advantage of predefined menus and conditional statements, seeks to reduce errors and interobserver variability. Additionally, following McPherron et al. (Reference McPherron, Dibble and Olszweski2008), we found that, although a single person is able to use the system, the lithic analysis phase works better when done by two persons, one analyzing the materials (including taking the measurements) and the other recording the attributes in the LithicsOTG app (Figure 6). Even though some training is required for the two people to communicate, this allows the analyst to be completely focused on the artifact rather than on controlling the device.
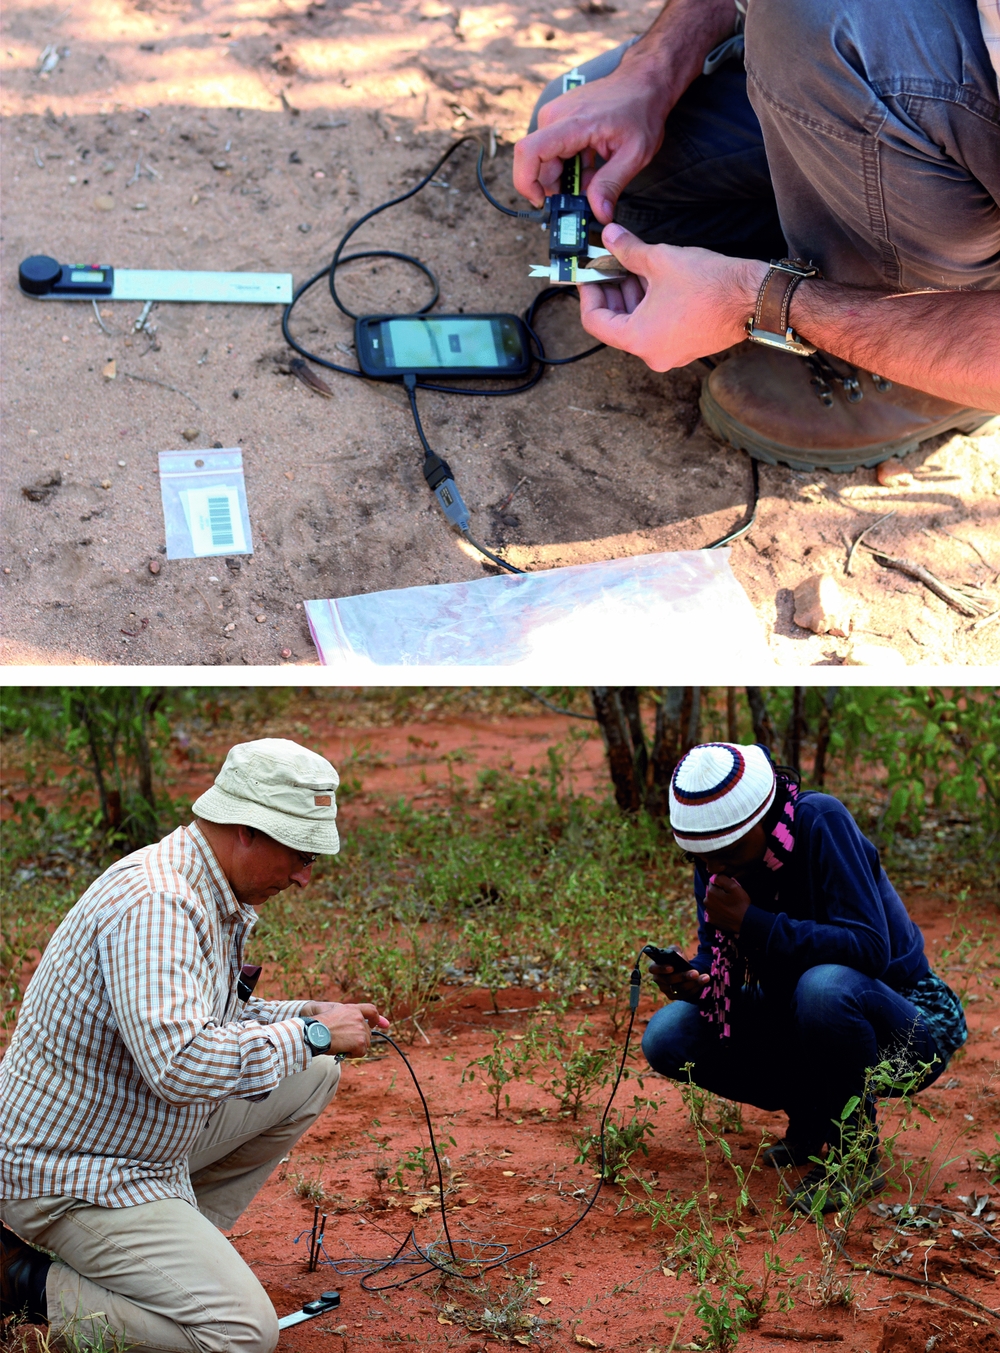
FIGURE 6. Analysis of lithic materials during field survey for Stone Age archaeological sites in Mozambique using the solution described here. Photographs by Célia Gonçalves.
The whole system has proved to be quite user-friendly. Over the years we have incorporated Mozambican, American, and Portuguese undergraduate and graduate students in our field team and have taught them to work with both apps. The results have been very satisfying, with most of the students learning quickly how the system works and being able to use it flawlessly.
Although we have been making small progressive modifications to improve the system, there are still some noteworthy shortcomings. One of the main limitations right now is the fact that the ArcheoSurvey app does not allow direct editing of maps, either to draw polygons or lines and export them as an associated field to a specific database entry, or to use these types of geographical features to tell the surveyor to follow a specific survey path or to stay restricted to a certain survey area. These are all tools that were, in fact, not needed in our own work but that can be added to the app by editing the configuration files supplied.
Another shortcoming that we are remedying is the addition of an “edit data” component. This will allow surveyors to edit, directly in the apps, previously saved sites and material analysis whether using Fusion Tables or the local stored CSV file.
Finally, Fusion Tables work only as flat-file databases, meaning that cross-referencing between tables is either made by a link in the sites table to the lithics table (as we have done in the example provided—see Figure 5) or by merging both tables into a single discrete file.
CONCLUSIONS
Mobile devices offer a variety of solutions for archaeological field practice. Some fit a specific project's needs better than others. The system presented here is not intended to be a one-size-fits-all solution. We believe, however, that it is a good starting point for those who may be beginning field survey projects and are looking for a digital, fully customizable recording structure, with the capacity to be expanded and integrated across different fieldwork practices. In this sense, modifications of our apps toward improvement or making use of different sets of variables (e.g., creating a CeramicsOTG, etc.) are both welcome and an important step in any freeware, open-source system.
We are aware that the future of archaeology should lie, as in many other disciplines, in operating more like a “high-consensus, rapid discovery” science (Collins Reference Collins1994; Reed et al. Reference Reed, Barr, McPherron, Bobe, Geraads, Wynn and Alemseged2015), rather than following the fairly unstandardized data collection methods we use nowadays. The system presented here may be critiqued as just another contributor to this lack of standardization, creating yet another different alternative in a pool of options that will become (if it is not already) overwhelming for researchers. However, we believe that being a fully freeware solution and making use of a core-database platform intended for data sharing make it somewhat closer to the desired public outreach and fast collaboration standards that archaeologists need to pursue (Kintigh Reference Kintigh2006).
Acknowledgments
We would like to thank the two anonymous reviewers and Shannon McPherron, whose comments and suggestions helped to improve the final version of this paper, and Ana Abrunhosa for reviewing the Spanish version of the abstract. Fundação para a Ciência e Tecnologia (PTDC/EPH-ARQ/4998/2012) and the Wenner-Gren Foundation for Anthropological Research funded the research in Mozambique. Fieldwork permits were given to Nuno Bicho for a four-year period starting in 2014 by the Governmental Authority for Cultural Heritage of Mozambique, Direcção Nacional do Património Cultural.
Data Availability Statement
All data are fully available without restriction at Mendeley Data Repository (https://doi.org/10.17632/8r8wh8w92m.1).
Supplemental Materials
For supplemental material accompanying this paper, visit https://doi.org/10.1017/aap.2017.21.
Supplemental File 1. Tutorial to access and customize the software.