1. Introduction
Glacier surging, also known as ‘galloping’ (Reference KambKamb and others, 1985), can be defined as rapid cyclic movements of a glacier over a relatively short time, after a long quiescent stage (Reference Meier and PostMeier and Post, 1969). Although scientists have recognized this phenomenon since the earliest study of Alaska glacier surges during the 1890s (Reference Tarr and MartinTarr and Martin, 1914), the mechanics of surging remains an unsolved mystery in glaciology (Reference Harrison and PostHarrison and Post, 2003). Sometimes glacier surges can cause disasters, for example the 2002 Kolka glacier catastrophe in the Caucasus (Reference Kotlyakov, Rototaeva and NosenkoKotlyakov and others, 2004), and the 1986 and 2002 surges of Hubbard Glacier, Alaska, and related outburst floods (Reference Motyka and TrufferMotyka and Truffer, 2007).
As suggested by earlier researchers, surging glaciers are concentrated in certain regions and completely absent from others (Reference Meier and PostMeier and Post, 1969). Known centers of surging glaciers are mainly distributed in western North America (Reference PostPost, 1969), Yukon, Canada (Reference Clarke, Schmok, Ommanney and CollinsClarke and others, 1986), Svalbard (Reference Jiskoot, Boyle and MurrayJiskoot and others, 1998), Iceland (Reference Björnsson, Palsson, Sigurðsson and FlowersBjörnsson and others, 2003), Greenland (Reference Jiskoot, Murray and LuckmanJiskoot and others, 2003) and the Pamir and Karakoram ranges in central Asia (Reference Barrand and MurrayBarrand and Murray, 2006; Reference Kotlyakov, Osipova and TsvetkovKotlyakov and others, 2008; Reference Quincey, Braun, Glasser, Bishop, Hewitt and LuckmanQuincey and others, 2011). There are also surging glaciers in western China. Reference ZhangZhang (1992) investigated and reported surges and related glacial hazards of Zelongnong glacier (298370 N, 958020 E) on the west slope of Namjagbrawa peak, southeast Tibetan Plateau, as well as the surge of Midui glacier (298250 N, 968300 E) on nearby Gangrigabu mountain. Several researchers have noted other glacier surging phenomena via remote sensing. These works mainly focused on glaciers on Anyemaqen mountain (338270 N, 918070 E) and Geladandong mountain (348470 N, 998280 E) (Reference Yang, Ding, Liu, Lu and ChenYang and others, 2003), and surging glaciers in the Shaksgam river valley (358420 N, 768550 E) of the Chinese Karakoram (Reference ShangguanShangguan and others, 2005; Reference Liu and WangLiu and Wang, 2009; Reference Niu, Liu, Wang and HewittNiu and others, 2011). A study on the incidence of surging glaciers in the Karakoram found more such glaciers in the Chinese part of this mountain range (Reference CoplandCopland and others, 2011). Reference Mayer, Fowler, Lambrecht and ScharrerMayer and others (2011) have modeled the surge of north Gasherbrum glacier in the Shaksgam river valley.
This paper introduces a newly found surging glacier, central Yulinchuan glacier (CYG), on the north slope of Muztag mountain, northern Tibetan Plateau. We present characteristics of its 2008/09 surge, based on sequential Landsat Thematic Mapper (TM) and Enhanced TM Plus (ETM+) images. Three types of velocity profiles were derived via the widely used cross-correlation feature-tracking (CCFT) method, and surge processes were analyzed based on these velocity profiles. Changes of glacier length and area, as well as surface crevasse development, were retrieved to provide additional information.
2. Study Area
Muztag mountain (368160–368380 N, 87840–878400 E; peak elevation 6973 m a.s.l.) is the largest glacial center in the southeast Tarim basin and central Kunlun mountains of the northern Tibetan Plateau. It is covered by 116 glaciers, with total area 681.2 km2 and ice volume 92.1 km3 (Reference Shi, Liu, Ye, Liu and WangShi and others, 2008). We collected meteorological records from two nearby weather stations, Qiemo (38890 N, 858330 E; 1247m a.s.l.; 240 km northwest of CYG; average annual temperature and precipitation 10.48C and 22.3 mm, respectively, during 1954–2004) and Ruoqiang (39820 N, 888100 E; 888 m a.s.l.; 300 km northeast of CYG; average annual temperature 11.78C, and precipitation 24.6 mm). These reveal that the region has experienced dramatic climatic changes over the last 50 years (1954–2004). The annual mean rate of temperature increase at Qiemo reaches 0.298C (10 a)–1 (R2 = 0.43), and the rate at Ruoqiang reaches 0.178C (10 a)–1 (R2 = 0.24). Both rates are greater than the global mean rate during a similar period (0.138C (10 a)–1, from 1956 to 2005; Reference Pachauri and ReisingerPachauri and Reisinger, 2007). Precipitation at both sites has a slight increasing trend (Ruo-qiang: 4.8 mm(10 a)–1, R2 = 0.15; Qiemo: 2.6mm(10a)–1, R2= 0.09). This has significantly impacted glaciers in this region. For example, the glaciers in the basin of Qarqan river, which originates from the north slope of Muztag and distributes 45% of the glacial area in the entire river basin (Reference Shi, Liu, Ye, Liu and WangShi and others, 2008), have shrunk by ∼ 3 . 4% of their total area during 1977-2001 (Reference Shangguan, Liu, Ding, Ding, Xu and LiShangguan and others, 2009).
Yulinchuan is the largest glacier around Muztag mountain and the southeast Tarim basin, and is located on the north slope of Muztag mountain, with an area of ∼104km2 (Reference Shi, Liu, Ye, Liu and WangShi and others, 2008). It covers an altitude range of 1765 m (5160-6925 m a.s.l.), with an equilibrium-line altitude (ELA) of ∼5640m a.s.l. (green line in Fig. 1). This is according to the first glacier inventory (FGI) of this region, compiled from aerial photographs in 1972 and related topographic maps (Reference Yang and AnYang and An, 1994). Yulinchuan consists of three branches: north Yulinchuan glacier (NYG), CYG and west Yulinchuan glacier (WYG) (Fig. 1). The snout of CYG diverges ∼ 9 km away from the highest peak of the glacier, and flows separately into the drainages of NYG and WYG. The north divergent branch has a mean width of ∼1.3 km, and the west branch only 0.9 km.

Fig. 1. Map of Yulinchuan glacier. TA and TB denote two termini of CYG; FL-W and FL-E indicate two flowlines of CYG; the equilibrium lines (in green) are read from the first glacier inventory of Muztag region (in 1972; Reference Yang and AnYong and An, 1994); dark purple window shows extent of Landsat images used in orthorectification accuracy validation; background is from QuickBird images acquired 24–29 January 2009 (download from Bing Maps, provided by Digital Global).
The three branches of CYG converged to form a united glacier when the FGI of this region was made (1972). However, comparison between a Landsat multispectral scanner (MSS) image from 15 December 1972 (Fig. 2a) and a TM image from 4 September 2004 (Fig. 2b) reveals that all termini of the three branches retreated during the last few decades. The terminus of NYG retreated ∼440m, and the two termini of CYG ∼150m (terminus A in Fig. 1) and ∼120m (terminus B). The retreat of WYG was relatively small, reaching ∼100m. These terminus retreats are attributed to intense ablation under the warming climate of this region.

Fig. 2. Changes of CYG termini during 1972–2010, and development of surface crevasses during 2007–10. Dates are year/month/day. Gridlines (black in (a), white in (b–i)) are at 2 km intervals. Short horizontal lines in different colours denote northernmost position of north terminus (TA in Fig. 1) on different dates. Yellow lines are equilibrium line of CYG read from the glacier inventory of Muztag region in 1972.
3. Data and Methods
3.1. Criteria to identify surge of CYG
There are several distinctive surface features for identifying a surge-type glacier. These include repeated loops and folds in medial moraines, chaotically distributed and rapidly developing surface crevasses, potholes or surface lakes, and rapid advances of glacier snouts (Reference Meier and PostMeier and Post, 1969; Reference SturmSturm, 1987; Reference Barrand and MurrayBarrand and Murray, 2006; Reference CoplandCopland and others, 2011). These surface features make it easy to distinguish a surge-type glacier from a non-surge-type glacier by remote sensing. Many studies have used remote-sensing techniques to identify surge-type glaciers, such as with early use of aerial photographs (Reference PostPost, 1969) and recent studies based on satellite images (e.g. Reference Rolstad, Amlien, Hagen and LundenRolstad and others, 1997; Reference Murray, Strozzi, Luckman, Pritchard and JiskootMurray and others, 2002; Reference Jiskoot, Murray and LuckmanJiskoot and others, 2003; Reference Barrand and MurrayBarrand and Murray, 2006; Reference CoplandCopland and others, 2011). CYG was confirmed as a surge-type glacier based on some specialized surface features, i.e. contorted longitudinal foliations, rapid development of surface crevasses, and advances of glacier termini (see Section 4).
3.2. Improved cross-correlation feature-tracking (CCFT) method
The CCFT method, which is widely applied in remote-sensing-based glacier studies (e.g. Reference Scambos, Dutkiewicz, Wilson and BindschadlerScambos and others, 1992; Reference Rolstad, Amlien, Hagen and LundenRolstad and others, 1997; Reference Strozzi, Luckman, Murray, Wegmuller and WernerStrozzi and others, 2002; Reference Dowdeswell and BenhamDowdeswell and Benham, 2003; Reference Luckman, Murray, Jiskoot, Pritchard and StrozziLuckman and others, 2003; Reference Scherler, Leprince and StreckerScherler and others, 2008; Reference Mayer, Fowler, Lambrecht and ScharrerMayer and others, 2011; Reference Quincey, Braun, Glasser, Bishop, Hewitt and LuckmanQuincey and others, 2011), was used to collect image control points and extract glacier surface velocities. Most CCFT methods perform transformations on a satellite image by Fourier, wavelet or other methods prior to image matching, and obtain sub-pixel-scale accuracy by fitting the correlation coefficient surface around the matching pixel in the master image with two-dimensional (2-D) functions (e.g. Reference Scambos, Dutkiewicz, Wilson and BindschadlerScambos and others, 1992; Reference Strozzi, Luckman, Murray, Wegmuller and WernerStrozzi and others, 2002; Reference Leprince, Barbot, Ayoub and AvouacLeprince and others, 2007). Although this type of image-matching method can provide 1/10 to 1/20 pixel-matching accuracy, their algorithms are relatively complicated and have lesser efficiency.
We developed a more straightforward and simplified image-matching method in this study, using Interactive Data Language (IDL) programming tools, to extract matching points from a large number of Landsat image pairs more efficiently. It can also provide sub-pixel-scale image-matching accuracy. The maximum correlated matching window was first searched in one image band, without performing any transformation. We used a sub-pixel interpolation method rather than 2-D function fits to improve the accuracy of matching-point coordinates. The best matching-window result in the first step was divided into 1 0 x 1 0 sub-pixel positions, and the pixel value at each position was calculated by a bilinear interpolation method. The sub-pixel position having the maximum correlation coefficient within the matching window in the slave image was taken as the final matched position.
Although this method only finds the maximally matched position at 1/10 pixel scale, it is simpler and more efficient to attain a large number of image matches. The nominal 1/10 pixel-scale positioning accuracy is reasonable, so the method is capable of capturing small movements greater than 1/10 pixel size.
3.3. Landsat images and their orthorectification accuracy validation
Images acquired by TM and ETM+ on board Landsat-5 and Landsat-7 satellites, respectively, were used to study the CYG surge. All images were obtained from the US Geological Survey (USGS), and were orthorectified based on the Shuttle Radar Topography Mission digital elevation model (SRTM DEM) and ground control points from the Global Land Survey 2005 (GLS2005) dataset (USGS, 2011). In total, 19 Landsat images were used (Table 1), 12 of which are ETM+ images partially influenced by missing data strips due to failure of the satellite scan-line corrector.
Table 1. Landsat images used and their geometric accuracies. A l l accuracies were calculated by improved CCFT method, using Landsat TM image from 6 August 2010 as common reference image
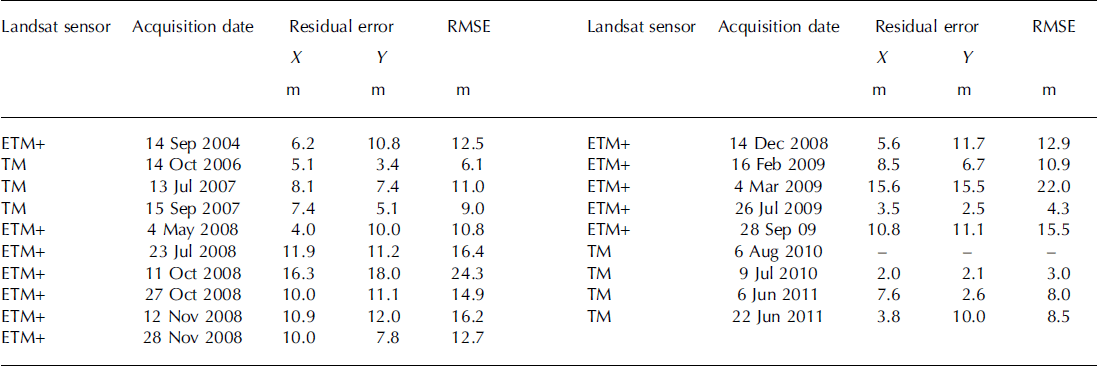
Before retrieval of glacier surface speed, orthorectifica-tion accuracies of all images must be validated. The Landsat TM image from 6 August 2010, which has no bad strips and minimal snow and cloud cover among the images, was used as a common reference. All Landsat images around Yulinchuan glacier were made into subsets (spatial extent shown by the window in dark purple in Fig. 1), and at least 25 evenly distributed control points on them were collected using the CCFT method and minimum correlation coefficient 0.8. The first band of all Landsat TM and ETM+ images (0.45-0.52 |im; 30 m spatial resolution), which has greater contrast over normal land surfaces, was selected for the ground control point search. The search window in this process has a size of 51 x 51 pixels, whereas the matching window size varied from 17 to 35 pixels. Maximally correlated sub-pixel locations of all matching window sizes were preserved, and optimally matched locations were manually selected from the results. Results located on the glacier surface were also manually deleted. For ETM+ images, matched windows with bad strip area larger than 1/3 were skipped to minimize their influence. Residual error in the x and y directions and root-mean-square error (RMSE) of different images were calculated based on coordinates of the 25 matched control points.
Validation results (Table 1) illustrate that all Landsat images used have higher and more stable orthorectification accuracies, relative to the results of widely used manual orthorectification processes (half to one pixel size was generally achievable). Most RMSEs are less than half-pixel size, and some even reach 1/6 to 1/10 pixel. The larger RMSEs of two ETM+ images from 11 October 2008 and 4 March 2009 are due to thick snow cover, which may have caused failure in some of the matching points searched. Therefore, this study applies these USGS orthorectified Landsat images directly to the study of CYG’s surge, without additional corrections. However, we include the validated orthorectification errors in error assessment.
3.4. Detection of glacier area and length changes and error assessment
Changes in glacier area were based on glacier outlines. Outermost glacier outlines were automatically extracted by the widely used band ratio method (band 3/band 5; Reference Paul , Kaab, Maisch, Kellenberger and HaeberliPaul and others, 2002), adding some manual improvements for imagery with extensive snow and/or cloud cover. All these outlines were then divided by topographical ridgelines of Muztag mountain. The ridgelines were generated by procedures that automatically extract boundaries of small drainage basins using ArcInfo hydrologic analysis tools, and delete boundary sections in flat topography with reference to the aspect difference of pixels along both sides of the boundary, using a set of IDL procedures (Reference Guo, Liu, Yu and XuGuo and others, 2011). Glacier lengths at different dates were calculated by intersecting corresponding glacier outlines and two glacier flowlines, which were manually digitized by reference to the Landsat TM image of 6 August 2010.
Errors in glacier area and length and their changes were assessed by incorporating Landsat image resolution (30 m), relative orthorectification error (RMSE and x,y residuals; Table 1), and accuracy of the improved CCFT image-matching method (nominally ± 3 m). Errors in glacier length and its changes are calculated by
where EL is error in glacier length induced by image resolution (counted as half the pixel size, A) and orthorectification errors relative to the Landsat TM image of 8 August 2010 (er, corresponding to RMSE in Table 1), and ELC are errors in glacier length changes that propagate from errors in glacier length in the pre-change (subscript 1) and post-change (subscript 2) images. The largest errors in glacier length and its change via Eqn (1) are ±28.6 m and ±35.5 m, respectively, which are related to the Landsat image of 11 October 2008 with the maximum orthorectification error.
Errors in glacier area and its change are calculated following principles similar to the error estimation method of Reference Bolch, Menounos and WheateBolch and others (2010):
where E A is error in glacier area from pixel resolution (E a&ɛ , counted as half the pixel area) and the relative mis-orthorectification (E a&ɛ , calculated summing x, y residual errors (&ɛrx , &ɛry ) of each image in Table 1, and multiplying by pixel size), and includes area errors of all pixels along the glacier outline (with n the total, excluding pixels along ice divides). EAC is error in glacier area change, which is also calculated by area error in the pre-change (subscript 1) and post-change (subscript 2) images. The maximum area and area change errors from the above formulas are ±0.11 km2 and ±0.16 km2, respectively, which also correspond to the Landsat image of 11 October 2008.
3.5. Glacier surface speed derivation and error assessment
Glacier surface velocities were also derived by the improved CCFT method. Horizontal displacements of regular grid-points over the glacier surface with 5 x 5 pixel steps were extracted, based on Landsat images acquired on two successive dates. The near-infrared band (band 4; 0.76-0.90 &µ.m) of TM and ETM+, which has lower reflectance for glacier surfaces, was selected as the main data source in feature tracking. We calculated cross-correlation coefficients of a series of moving windows, with size increasing from 11 to 27 pixels in two-pixel increments. The maximum correlation coefficient was searched in a 45 x45 pixel window for every moving window size, and the best-matching window for each moving window size (with highest correlation coefficients) recorded. Selection of the searching and matching window sizes was dependent on manual measurement of maximum horizontal displacements of the glacier surface between 14 December 2008 and 16 February 2009 (with about 300 m or 10-pixel size). The larger matching window is more flexible for capturing surface features, but gives a smaller coefficient because of large glacier surface change during surge. In contrast, the smaller matching window can give a higher coefficient, but is less reliable. Thus, using multiple sizes of matching window is more appropriate for attaining the most accurate matching results. The sub-pixel match was then performed on the best-matched pixel-scale window of each size.
The maximally correlated sub-pixel position does not always correspond to the best point in representing the correct direction of glacier movements, because of the larger variance of the glacier surface during surge (sometimes it is even located on the upstream side of the glacier). Therefore, results of the CCFT method with different matching window sizes require further filtering. We used the glacier surface aspects calculated from SRTM to filter resulting points at each location, according to the fact that most movements of mountain glaciers are downslope. An index for each matching result was calculated to solve this problem:
where I is the index, R is the correlation coefficient of the matching window of different size, Rmax and Rmin are maximum and minimum coefficients among all matching window sizes, D is the absolute value of the difference between the direction of motion and aspect of the pre-move pixel, which was constrained within the range 0–&π, D max and D min are maximum and minimum D for all matching window sizes, and WR and WA are weights of the correlation coefficient and normalized angular difference, which were set to 0.6 and 0.4, respectively. The image-matching result with the largest I value was selected as the final matched location.
We also did sequential tracking of surface features, which are mainly composed of surface crevasses with certain spatial patterns, to obtain velocity and overall motion distance on different parts of the glacier surface. In total, 15 surface features were tracked, most of them formed by surface crevasses developed during the surge. Each was tracked by the same CCFT method and criteria as above, taking previously tracked positions on the post-move image as inputs to the next tracking process. The CCFT method is more sensitive to the structure of the matching window. Therefore, rather than absolute positions of surface features, inputs for the first track are roughly defined by visually determined centers of distinctive surface features formed by crevasses.
Accuracies of horizontal displacement and corresponding velocities were calculated as follows:
where E d and ED are displacement errors between two tracking dates and all tracked dates, respectively, Ev is accuracy of motion velocity, E r1 and E r2 are relative orthorectification accuracies of pre-move and post-move Landsat images (Table 1), u is uncertainty in the feature-tracking method (±3 m) and d is the number of days between two image acquisition dates.
4. Results
4.1. Identification of CYG surge
There is one pre-surge surface feature that can be used to identify CYG as a surge-type glacier. Some contorted longitudinal foliations on the lower glacier snout (near the diverging point of CYG) can be distinguished from a fine-quality Landsat ETM+ image from 14 September 2004 (Fig. 2b), implying that at least one of its branches has surged in past decades. Furthermore, two types of evidence during the surge directly prove that CYG is a surge-type glacier. The first is that its termini advanced during 2008-10. As mentioned in Section 2, the united Yulinchuan glacier disintegrated between 1972 and 2004 (Fig. 2a and b). However, Landsat images acquired after 2007 (Fig. 2d-f) show that the termini of CYG have clearly advanced and reconverged into NYG and WYG, indicating that CYG has surged.
The second piece of evidence from the surge stage is from surface crevasse development. Similar to the CYG termini, the glacier surface has experienced dramatic changes, as clearly demonstrated by the Landsat image sequence (Fig. 2d-h). The surface was dominated by continuous and smooth ice before 2008, with some longitudinal features (see Fig. 2b and c). However, some transverse crevasses appeared just below the CYG equilibrium line on 11 October 2008, similar to those found on some Svalbard surging glaciers (Reference Sund, Eiken, Hagen and KaabSund and others, 2009). The surface crevasses then entered a stage of rapid development, and their area expanded quickly between 11 October and 14 December 2008. After that, crevasses developed more slowly, especially after 4 March 2009. The surface became stable after 7 September 2010 (Fig. 2f); the maximum range of surface crevasses was >6km, and the area reached 8 km2 (Fig. 3a).
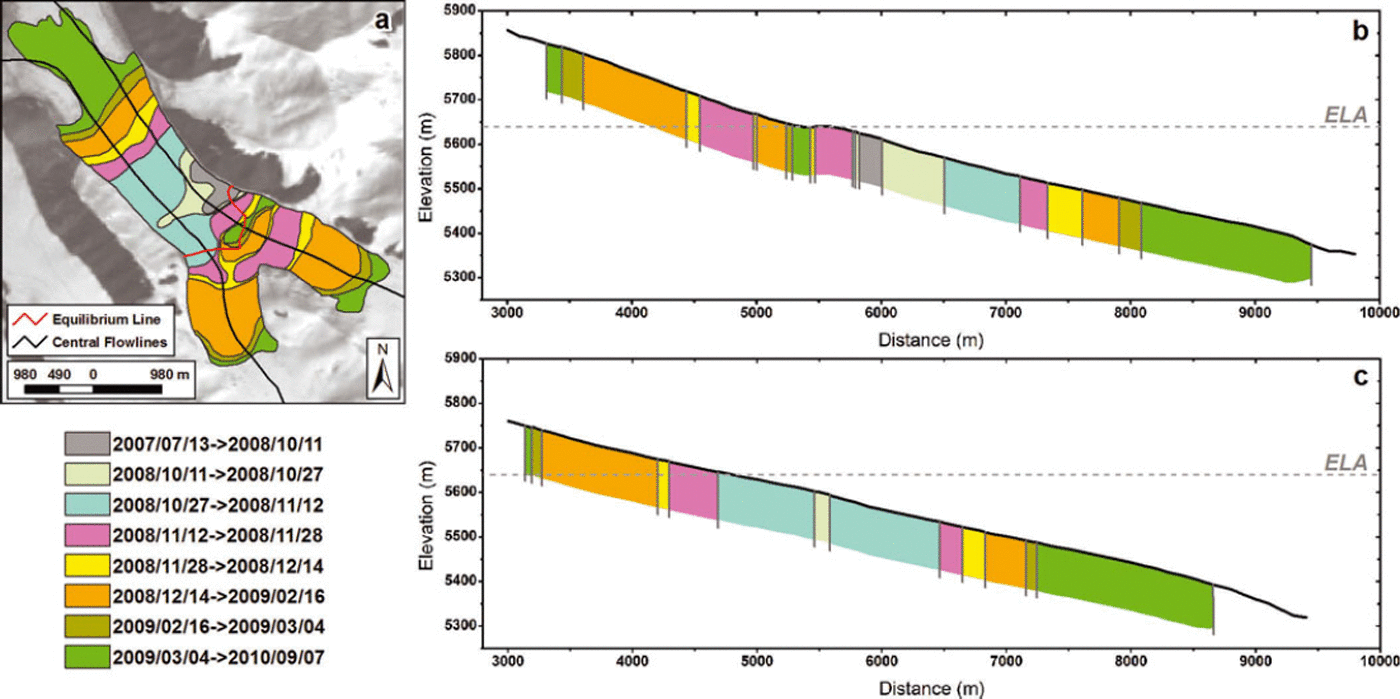
Fig. 3. Surface crevasse development sequence of CYG in different periods (a), and their distributions along (b) east and (c) west flowlines. Crevasse regions were manually digitized, referenced with corresponding Landsat images. Dates in legend are year/month/day.
From the planar, longitudinal and altitudinal distribution of crevasse developments (Fig. 3), it was discerned that the surface crevasses first developed on the middle glacier (∼5610 ma.s.l. and 5.9 km from the top), and then rapidly expanded to the upper and lower glaciers, especially along the west flowline development profile (Fig. 3c). The profile along the east flowline shows some difference (Fig. 3b). The regions around and above the ELA in this figure (just below the convergence point of the small northeast branch) were not seriously crevassed until 14 December 2008, although the first crevasse appeared near this region. Another difference is with the uppermost elevation of the crevasse distribution. The highest elevation of crevasses on the larger east branch of CYG was close to 5850 m a.s.l. (Fig. 3b), while the corresponding elevation of the west branch is ∼5750 ma.s.l. (Fig. 3c).
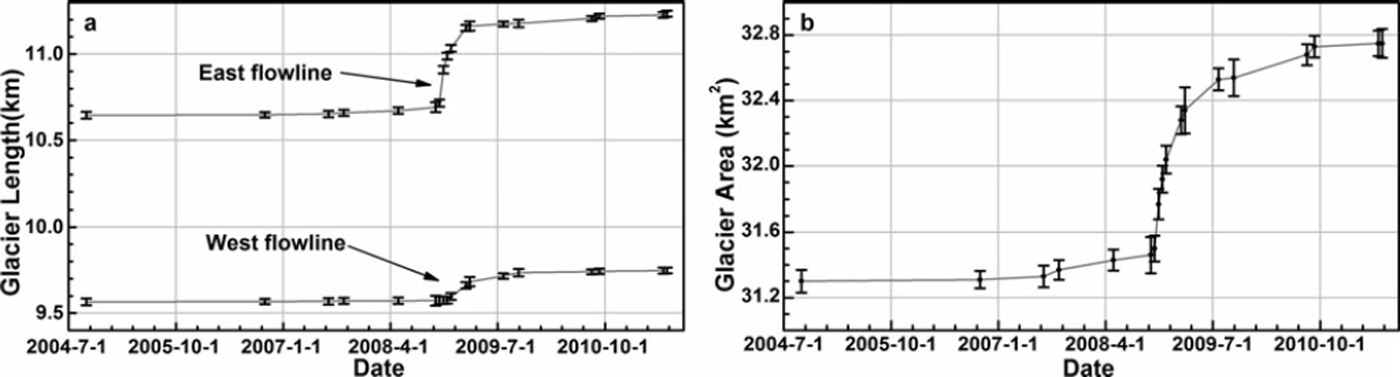
4.2. Changes in glacier area and length
As mentioned above, advance of a glacier terminus during surge is a primary indication of most surging glaciers. The length changes of CYG provide detailed information on its terminus advances (Fig. 4a). Glacier lengths at the two termini gradually increased between July 2007 and October 2008 (with mean rate of increase 0.07 ± 0 . 0 9 and 0.01 ± 0.09 m d–1 at termini A and B, respectively). Then there was a period of rapid increase until March 2009, in which termini A and B advanced about 472 ± 39 m (3.28 ± 0.3 md–1) and 1 0 9 ± 3 9m (0.76 ± 0.3 md–1) , respectively. Total changes of CYG length at the two termini reached 590 ± 26 m (5.1 ± 0 . 2% of the 2004 length) and 1 8 2 ± 2 6m (1.8 ±0.3%), respectively.

Changes in glacier area had temporal patterns similar to glacier lengths. In total, glacier area increased ∼1.41± 0.11 km2 (4.6 ± 0 . 4% of 2004 glacier area). The largest increase was between October 2008 and March 2009, ∼ 0 . 8 8 ± 0 . 1 8 km 2 (Fig. 4b). The area changes show some differences with lengths, mainly within stages before October 2008 and after March 2009. The glacier area showed a larger increasing trend, whereas glacier termini had relatively small advances. Comparing Landsat imagery on different dates, we found that these phenomena were induced by glacier expansions near the divergence point before October 2008, and widening of the glacier snout near terminus A after March 2009.
4.3. Changes in glacier surface velocities
Tracking of distinctive surface features over most of the surge phase shows that horizontal displacements in the lower and middle parts of the glacier surface had a much larger motion distance than the primary glacier terminus (terminus A in Fig. 1). The maximum tracked surface displacement (feature point B in Fig. 5; 13 July 2007 to 6 June 2011) is 1657±297 m. Identifiable motion distances of most other tracked feature points (A, B, C, E, F, G and I in Fig. 5) on the lower and middle parts are also close to or greater than 1000 m.

Fig. 5. Surface horizontal displacements of CYG, derived by sequential tracking of surface features during surge. Black characters represent codes of surface features, and red numbers are their tracked motion distances. Dates in legend are year/month/day.
Velocities of each surface feature in different stages were calculated by dividing the horizontal displacements by time intervals. Results clearly show that the glacier surface experienced dramatic changes in velocity during its surge. The surging phase for all velocity profiles was between July 2008 and July 2009, with the maximum surge from October 2008 to March 2009 (Fig. 6). The maximum surface velocity among tracked features was at point A during 12-28 November 2008, reaching 13 ± 1.5 md- 1 . The maximum speed of advance of terminus A was 12.1 ± 1 . 8 m d – 1 , but this was before the date of maximum speed of other feature points (27 October to 12 November 2008) on the eastern half of CYG. This implies that some undetected movements propagated to terminus A before July 2008. On the other hand, it may also suggest that the surge was initiated near the terminus.
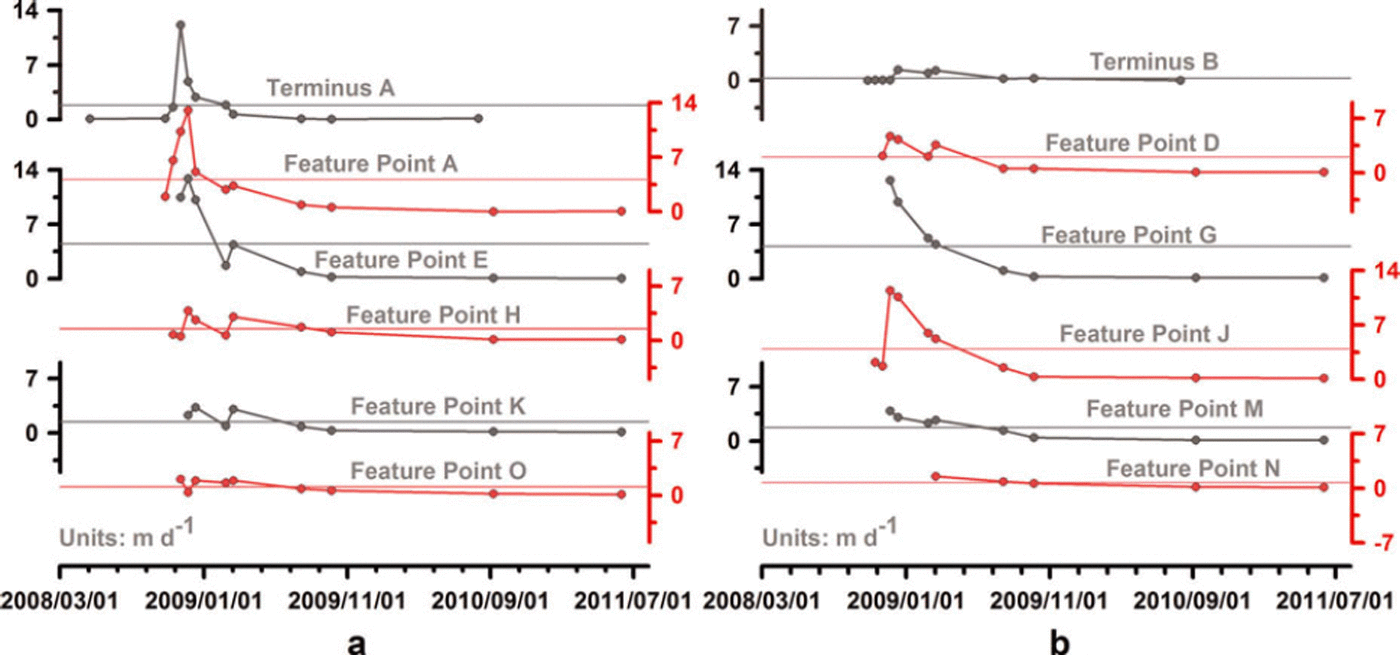
Fig. 6. Velocity profiles of tracked surface features in Figure 5 on (a) eastern half and (b) western half of CYG, calculated from motion distances in corresponding period. Dates are year/month/day. Horizontal lines indicate mean velocities of corresponding feature points.
The velocity profile of these mobile surface features does not represent velocity changes at a fixed position on the glacier. To evaluate changes of motion velocities on different parts of the glacier, we derived velocities at regular gridpoints on its surface (excluding upper accumulation areas of CYG unaffected by its surge) with 5 x 5 pixel steps, retrieving velocity fields of the surface during various surge phases. We performed visual inspection and remnant fault point deletion in the results. Then velocities along two main glacier flowlines and three transverse profiles on different parts of the glacier (Fig. 7b; we manually excluded the converging point of upper transverse line T-A at 1 km from the western edge, and the divergence point of lower transverse line T-C at 1.2 km from south) were interpolated at 200 m intervals using the inverse distance weighted (IDW) interpolation method. Nearly all velocity profiles are discontinuous, especially the profile before 11 October 2008. This was due to the lack of valid velocity points, largely induced by lower contrast of the glacier surface generated through snowfalls before the surge, significant changes of the glacier surface during surge, or by bad strips in ETM+ images. However, the velocity profiles still provide some information about the surge process of CYG (Figs 8 and 9).

Fig. 7. (a) Example of velocity fields tracked at fixed gridpoints on glacier surface with 5 x 5 pixel steps. Dates are year/month/day. (b) Points for retrieving surface velocity profiles along two flowlines (FL-E and FL-W) in Figure 8, and three traverse lines (T-A, T-B and T-C) in Figure 9. Number labels are distances from heads of glacier (black) and from its west side (red).
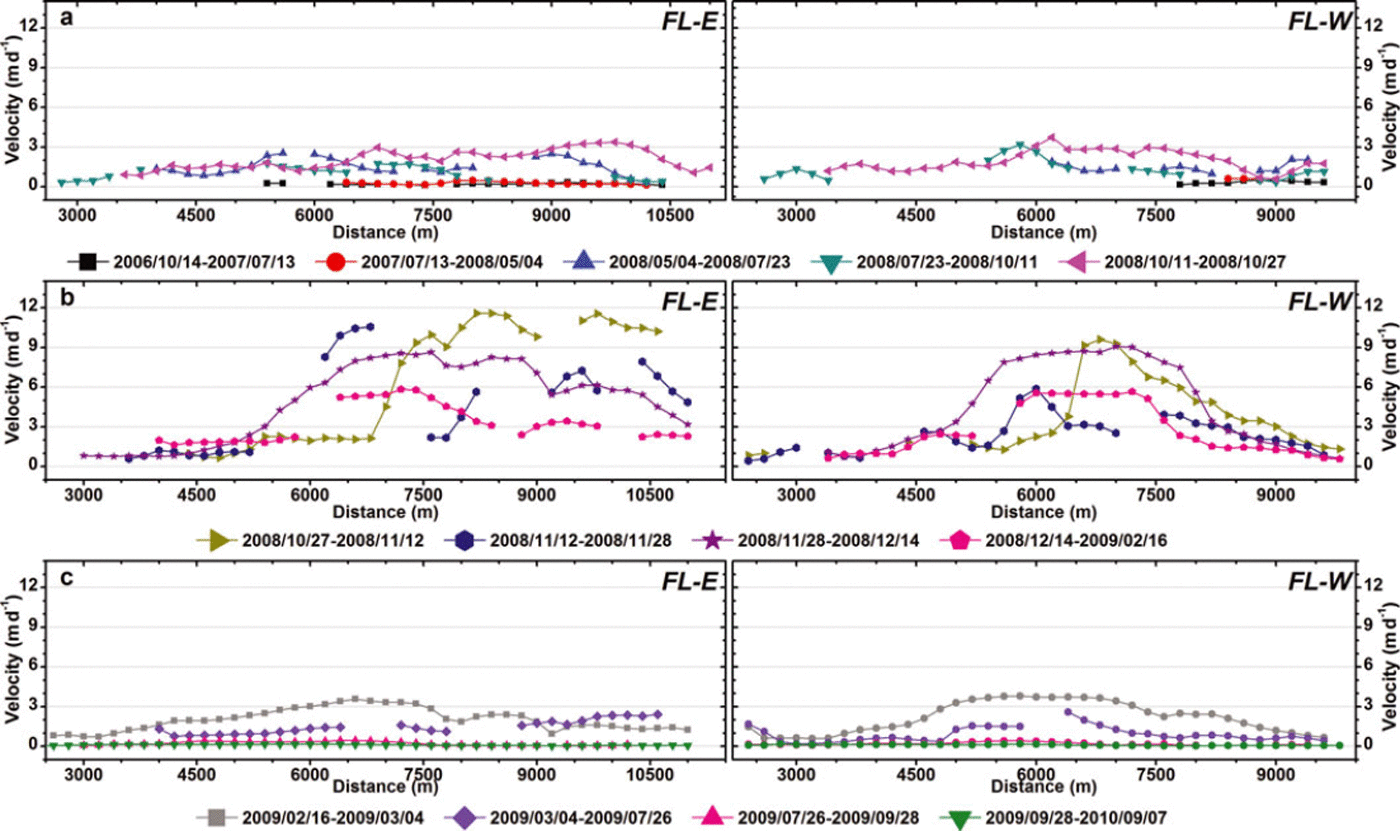
Fig. 8. Surface velocity profiles along west (FL-W) and east (FL-E) flowlines in different periods: (a) 14 October 2006 to 27 October 2008; (b) 27 October 2008 to 16 February 2009; (c) 16 February 2009 to 7 September 2010.
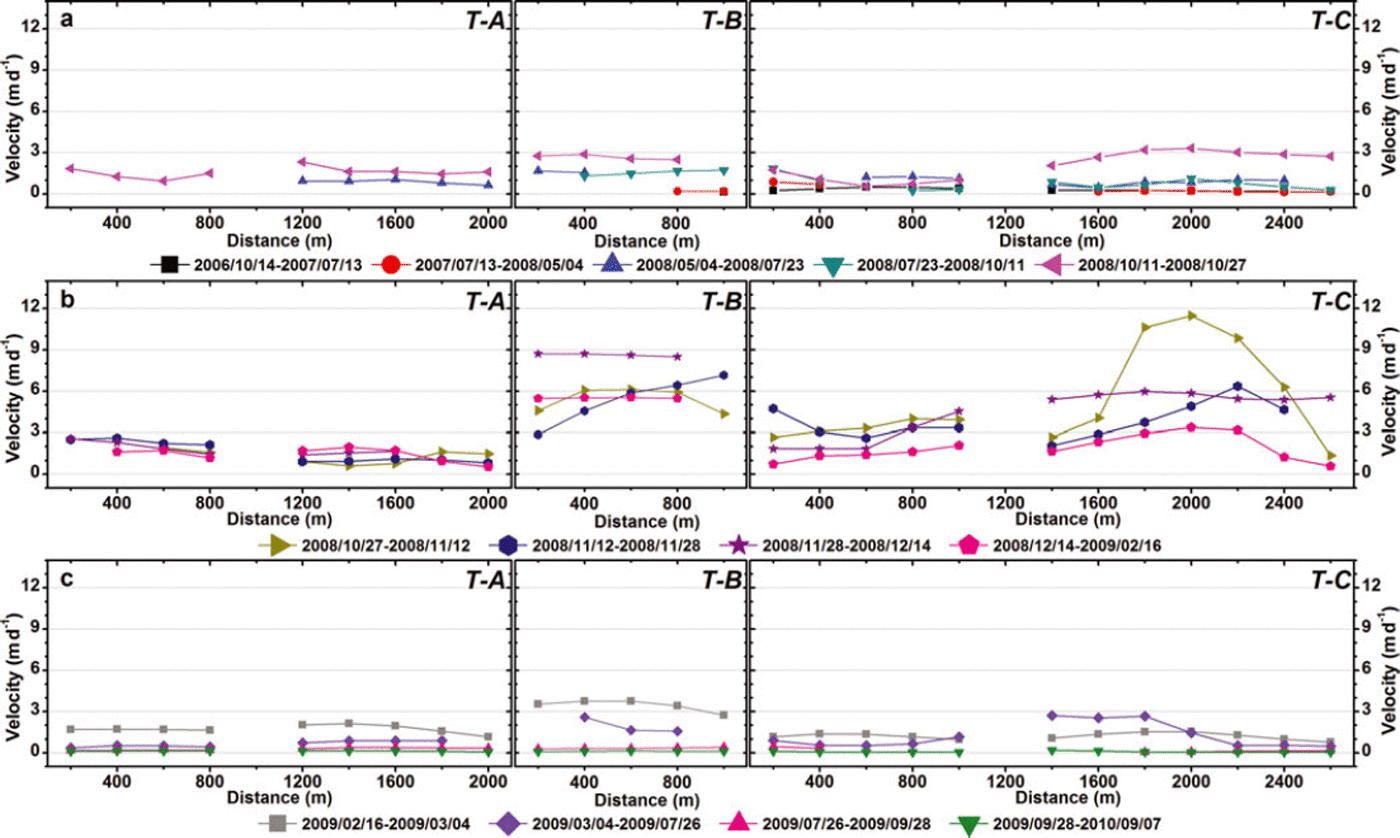
Fig. 9. Surface velocity profiles along upper (T–A), middle (T–B) and lower (T–C) transverse lines in Figure 7b for different periods: (a) 14 October 2006 to 27 October 2008; (b) 27 October 2008 to 16 February 2009; (c) 16 February 2009 to 7 September 2010.
In contrast to surface feature tracking, tracks of fixed gridpoints on the glacier surface yielded few but valuable valid velocity points on lower parts of the CYG snout before July 2008, where the surface had many surface features visible on Landsat images (Fig. 2b and c). Therefore, the longitudinal velocity profiles provide more detail about the early surge stage, demonstrating that the surge occurred between May 2008 and July 2009. The primary surge phase was between October 2008 and February 2009, when maximum profile velocities generally exceeded 5 m d – 1 (Fig. 8b). Initiation and termination phases of the CYG surge were May–October 2008 and March–July 2009, respectively, during which profile velocities were generally close to or less than 3 m d–1.
Another noteworthy feature of all longitudinal velocity profiles is staged changes of velocities along two flowlines during the primary surge phase. The first stage was 11 October to 12 November 2008 (magenta triangle profile in Fig. 8a and dark yellow triangle profile in Fig. 8b). Surface velocities rapidly increased to the maximum of all profiles (11.6± 1.6 md–1, near 8.2 km of FL-E, dark yellow triangle profile). The second stage closely followed the first, through 4 March 2009 (theother profiles in Fig. 8b and gray profile in Fig. 8c). The surface velocity of the upper glacier (near 6.8 km of FL-E, dark blue hexagon profile in Fig. 8b) rapidly increased to the secondary maximum (10.6 ± 1.5 m d–1), and then the entire glacier entered a swiftly moving period. The average velocity of two profiles during 28 November to 14 December 2008 reached 4.8 ± 1.3 m d - 1 . After February 2009, surface velocities gradually decreased, returning to near stagnation in July 2009.
The third feature distinguishable from the longitudinal profiles is the surge wave propagation. The first wave appeared at the beginning of the initiating stage, when the maximum visible velocity occurred around 5.8 km on the east profile (dark blue triangle profile of FL-E in Fig. 8a). Then the wave propagated downward, with the maximum velocity arriving at 9.8 km on the east profile during 11-27 October 2008 (magenta triangle profile of FL-E in Fig. 8a). This wave continued to develop between 27 October and 12 November 2008, leading to the first massive surge of the lower glacier (below 6.8 km of the east flowline, dark yellow triangle profile in Fig. 8b). The second wave was a rapidly developing one, and originated from the upper glacier (above 6.8 km of the east flowline, dark blue hexagon profile of FL-E in Fig. 8b) during 12-28 November 2008. It quickly developed into a larger, second massive surge involving nearly the entire glacier, from 28 November to 14 December (purple star profiles in Fig. 8b). After that, glacier movements gradually slowed, entering a new quiescent phase through July 2009, with average surface velocity of all profiles <0.2 ± 0.3 md–1.
The transverse velocity profiles furnish more detail about development of the CYG surge. The lower traverse (T-C) shows that the lower glacier snout was essentially stable before 11 October 2008. In contrast, the upper and middle traverses (T-A and T-B) had higher velocities during July through October 2008 (Fig. 9a). This pattern changed during October to early November 2008. Velocities at the middle and lower traverses exceeded those at the upper traverse (Fig. 9b). This may be explained by the surge wave propagation mentioned above. The second surge wave initiated from the eastern part of the middle glacier after early November 2008, and rapidly propagated toward terminus A. This was followed by a larger, massive movement of most parts of the glacier.
The transverse profiles illustrate a very distinctive feature of the CYG surge: the east and west diverging branches experienced different motion processes during the surge. The east branch was more active during the first stage, and the maximum velocity of all profiles appeared on its center line between 27 October and 12 November 2008. During the second stage, velocities of the two branches were more evenly distributed than in the first stage, although at the start of this stage (12–28 November 2008) the east branch remained more active than the west.
4.4. On the surge history of CYG
An important characteristic of a surging glacier is the repeatability of surge activities. Most surging glaciers will resurge every 101–102 years (Reference Meier and PostMeier and Post, 1969). Some surging glaciers have recurrence intervals of 500 years (Reference SolheimSolheim, 1991). We studied the surge history of CYG and tried to retrieve the recurrence period. However, there is no sign of another surge between 1972 and 2007. The earliest data collected, the MSS image and topographical maps of the study region, were all from winter 1972. As mentioned in Section 2, the three branches of Yunlinchuan glacier converged in 1972 (Fig. 2a). Subsequent Landsat TM/ETM+ images from 1972–2004 (not included in Table 1) show that all termini of the glacier retreated continuously. Therefore, we can conclude that the recurrence period of CYG surging is not less than 40 years.
5. Discussion
From velocity profiles along two flowlines and three traverse lines of CYG, we conclude that during the surge there were two closely connected surge waves. The first wave was from 5 May to 12 November 2008, and the second developed at the end of the first wave through July 2009. However, profiles of tracked surface features indicate different surge development sequences. No valid points were tracked for all feature points on the Landsat images before May 2008, because of the lower contrast of the glacier surface. Consequently, these profiles cannot provide useful information about the first surge wave shown by the longitudinal and transverse profiles. Furthermore, there is another small wave revealed by profiles of tracked feature points on the east half of the CYG between 16 February and 4 March 2009, which was not reflected by the eastern longitudinal and transverse profiles. We suspect more small surge waves during the surge, as observed in other surge glaciers (e.g. Reference KambKamb and others, 1985). However, there is not enough evidence to support this conclusion.
The parabolic shapes of transverse velocity profiles along the middle traverse and eastern part of the lower traverse between 27 October and 12 November 2008 demonstrate that lateral drag (Reference Cuffey and PatersonCuffey and Paterson, 2010) may affect surge motions in the earlier stage. However, that velocities were relatively evenly distributed on most other transverse profiles in Figure 9b means the glacier moved downward by plug flow (Reference Fatland, Lingle and TrufferFatland and others, 2003). In other words, the rapid movements primarily resulted from basal sliding (Reference CoplandCopland and others, 2009; Reference Quincey, Copland, Mayer, Bishop, Luckman and Belo =Quincey and others, 2009; Reference Scherler and StreckerScherler and Strecker, 2012), rather than plastic deformation of glacier ice.
The initiation and termination of CYG’s surge, i.e. May through October 2008 and March through July 2009, respectively, show some similarities with the corresponding phases of the 1992–95 surge of Sortebræ, East Greenland, which was initiated after September 1992 and before October 1993 (more likely closer to July 1993), and terminated after May and before September 1995 (Reference Murray, Strozzi, Luckman, Pritchard and JiskootMurray and others, 2002). Sortebræ is located near two known polythermal glaciers (Schuchert Gletscher (Reference KirchnerKirchner, 1963) and Roslin Gletscher (Reference Davis, Halliday and MillerDavis and others, 1973)), and was believed to be an Alaska-type surging glacier (Reference Murray, Strozzi, Luckman, Pritchard and JiskootMurray and others, 2002). The abrupt switches between quiescent and surge phases, as well as its higher level of surface velocities during the surge, provide further evidence that CYG is an Alaska-type surging glacier (Reference Jiskoot, Singh, Singh and HaritashyaJiskoot, 2011), whose surge my be triggered by reorganizations of the subglacial drainage system (Reference KambKamb, 1987). However, nothing is known about the temperature profiles and subglacial hydrologic conditions of CYG.
As already mentioned, the tracks of typical surface features revealed that most of the glacier snout surface had a much larger horizontal displacement than terminus A. The maximum displacement (1657±297m) was about three times the advance of terminus A (590±26 m) during the entire surge phase. Average detectable horizontal displacements of other feature points during the primary surge phase were also >1 km (Fig. 5). As discussed above, velocity profiles of tracked surface features on the eastern half of CYG revealed a tiny surge wave between 16 February and 4 March 2009. Nonetheless, terminus A did not show this kind of wave in its speed of advance, which continuously decreased after 12 November 2008. We checked Landsat images from November 2008 to March 2009 and found that terminus A of CYG contacted NYG on 12 November 2008 (Fig. 2e), and had completely run into NYG on 16 February 2009 (Fig. 2f). Thus, we deduce that NYG has significantly obstructed the terminus advance of CYG; otherwise CYG would have advanced far more than 600 m.
The longitudinal profiles along the east flowline revealed another obstruction to the CYG surge. Almost all the eastern profiles have a two-peaked shape, with troughs between the two peaks between 7.5 and 9.0 km, near the divergence point of CYG. Meanwhile, profiles along the west flowline all have a one-peaked shape. This phenomenon implies that rocks in front of the divergence point of CYG are also obstructing its surge, and continuously resist the rapid movement of the eastern diffluent branch that transects the primary part of the surging ice. By contrast, this has little influence on the less important west branch, generating the smoothed shape of the western velocity profiles.
6. Summary and Conclusion
Based on satellite images from Landsat TM and ETM+ sensors, we studied the 2008/09 surge of CYG. The well-established cross-correlation feature tracking was used as the principal method for deriving surface horizontal displacements. Surface velocities of the glacier in different periods were subsequently calculated. Surge processes were analyzed by velocity profiles of sequentially tracked surface features, and by profiles along two glacier flowlines and three transverse cross sections. We retrieved changes of glacier length and area, as well as surface crevasse developments, to provide additional information.
The results clearly indicate that the CYG surge initiated in May 2008, developed rapidly from October 2008 to March 2009, then gradually terminated by July 2009. The two glacier termini advanced 590 ± 26 and 182 ± 26 m, respectively, and glacier area increased ∼1.41 ± 0 . 1 1 km2. The glacier surface severely cracked, and the area within which crevasses developed reached 8 km2. There were large horizontal displacements on most parts of the glacier, with maximum motion distance reaching 1657 ± 2 9 7 m. The maximum surface motion was 13±1.5md–1 , but showed dramatic changes during different stages of the surge. From the velocity profiles along two flowlines and three cross sections, it is concluded that there were two larger surge waves during the CYG surge. The first wave appeared between 5 May and 12 November 2008, and the second developed rapidly from the end of the first through 26 July 2009. The second wave involved almost the entire glacier and produced the largest surge motions.
Because of limitations of spatial and temporal resolution of the Landsat TM/ETM+ sensors, especially the influence of bad strips in the ETM+ images, detailed processes of the CYG surge were not addressed in this study. This awaits future work. The surface elevation evolution of surging glaciers is very important for understanding surge mechanisms (Reference Meier and PostMeier and Post, 1969; Reference Sund, Eiken, Hagen and KaabSund and others, 2009), but was not performed here because of a data shortage. All shortcomings of this study are expected to be improved in future work.
Acknowledgements
This study was supported by the Global Change Research Program of China (grant No. 2010CB951401) and Knowledge Innovation Program of the Chinese Academy of Sciences (grant No. KZCX2-YW-GJ04). The USGS kindly provided all Landsat imagery. We also thank Liangfu Ding for valuable advice on glacier surge characteristics, and Junli Xu for advice on deriving glacier speed from satellite imagery.