


Introduction
According to the Centres for Disease Control and Prevention (CDC), as of 2014, suicide was the tenth most common cause of death in the USA and was a top five cause of death among all individuals between 10 and 54 years of age (National Center for Injury Prevention and Control, 2016a ). Between 2005 and 2014, the CDC reported a 31.1% rise in the number of deaths by suicide in the USA, from 32 637 deaths in 2005 to 42 773 in 2014 and a 21.5% rise in the suicide death rate, from 11.04 per 100 000 in 2005 to 13.41 per 100 000 in 2014 (National Center for Injury Prevention and Control, 2016b ). It is estimated that there are, on average, 25 suicide attempts for every suicide death (Crosby et al. Reference Crosby, Han, Ortega, Parks and Gfoerer2011), with 100–200 suicide attempts for every suicide death in the 15–24 year age group (Goldsmith et al. Reference Goldsmith, Pellmar, Kleinman and Bunney2002).
Many suicide attempts result in emergency department (ED) visits and/or hospitalisation. There are an estimated 200 000 suicide attempt-related hospitalisations in the USA each year, or approximately six suicide attempt-related hospitalisations for every death from suicide (Crosby et al. Reference Crosby, Han, Ortega, Parks and Gfoerer2011). Estimates of suicide attempt-related ED visits, however, vary widely, ranging from a 2010 estimate by the CDC's National Electronic Injury Surveillance System-All Injury Program (NEISS-AIP) of 464 711 annual visits (National Center for Injury Prevention and Control, 2016b ), up to 713 000 visits based on data from the National Center for Health Statistics (NCHS) National Hospital Ambulatory Medical Care Survey (NHAMCS) (National Center for Health Statistics, 2010). This wide variation is likely due in part to the small number of hospitals sampled: 66 hospitals in the case of the NEISS-AIP, and 357 hospitals in the case of the NHAMCS. In addition, the NHAMCS samples only a fraction of patients within each hospital during a randomly chosen 4-week window each year.
The present study examines trends in US suicide attempt-related ED visits between 2006 and 2013 using the Nationwide Emergency Department Sample (NEDS), the largest all-payer ED database in the USA, produced by the Agency for Healthcare Research and Quality as part of the Healthcare Cost and Utilization Project (HCUP). Two recent studies have also examined data from the NEDS to study annual suicide attempt-related ED visits among children in 2007 (Sulyman et al. Reference Sulyman, Kim, Rampa, Allareddy, Nalliah and Allareddy2013) and among older adults in 2006 (Carter & Reymann, Reference Carter and Reymann2014). The current study evaluates trends in US suicide attempt-related ED visits across all among individuals aged 10 years and older from 2006 through 2013.
Methods
The NEDS is an all-payer database containing approximately 28 million ED visits per year. It can be weighted to represent the entire US population using sampling weights provided by HCUP (Agency for Healthcare Research and Quality, 2013). For 2013, the NEDS included 947 hospitals in 30 states, representing a 20% stratified sample of all hospital EDs in the USA. The NEDS provides information on patient demographics (excluding race and ethnicity), diagnosis and hospital course. As an all-payer database, it includes information on patients with government insurance (including Medicare and Medicaid), private insurance and no insurance. Federal government hospitals, such as VA hospitals, military hospitals and Indian Health Service facilities are not included in the NEDS. Hospitals are sampled according to census region, trauma centre level, urban-rural location, teaching status and hospital ownership, ensuring that the sampled hospitals are representative of hospitals throughout the USA.
With Johns Hopkins Institutional Review Board (IRB) approval, NEDS data from 2006 through 2013 were queried to identify patients who presented to EDs at hospitals across the USA with suicide attempt-related or self-inflicted injuries, which for simplicity we refer to in the rest of this paper as ‘suicide-related.’ Patients were identified using the ICD-9-CM external cause of injury codes (‘E-codes’) for suicide and self-inflicted injury: E950–E959. Each NEDS record includes up to four E-codes, each of which was examined for the indicated codes. The E-codes also provide information on the mechanism of injury, which was categorised in this analysis according to the method used by the researchers at the University of Manitoba (Manitoba Centre for Health Policy, 2013). The mechanism of injury was also classified as either violent (cutting, hanging, use of a firearm, jumping, crashing a vehicle, burns and electrocution) or non-violent (poisoning, drowning and exposure to extreme cold) according to the criteria proposed in previous studies (Denning et al. Reference Denning, Conwell, King and Cox2000; Dumais et al. Reference Dumais, Lesage, Lalovic, Seguin, Tousignant, Chawky and Turecki2005). If E-codes for both a non-violent and violent mechanism were listed, the mechanism was classified as violent.
Each NEDS record also includes up to 15 ICD-9-CM diagnosis codes, which were examined to determine additional details about the type and location of injury and the presence of concurrent mental disorders. Except as noted, diagnosis codes were categorised using the Clinical Classification System (Elixhauser et al. Reference Elixhauser, Steiner and Palmer2014). ICD-9-CM diagnosis codes in CCS categories 241–243 (mostly corresponding to ICD-9-CM diagnosis codes in the 960–989 range) were examined for additional information in patients with a poisoning E-code and CCS categories 650–670 were used to identify ICD-9-CM diagnosis codes for mental disorders. If more than one code for poisoning or mental disorder was found, the first listed code was used. Type and location of injury were determined using the International Classification of Diseases Programs for Injury Categorization (ICDPIC) written for Stata (Clark et al. Reference Clark, Osler and Hahn2013). Injuries were categorised using the Barell Injury Diagnosis Matrix (Barrell et al. Reference Barrell, Aharonson-Daniel, Fingerhut, Mackenzie, Ziv and Boyko2002), which classifies ICD-9-CM diagnosis codes according to body region and nature of injury. If more than one diagnosis code was provided, the code with the highest severity was chosen, based on the Abbreviated Injury Scale (AIS) as calculated by the ICDPIC program (Clark et al. Reference Clark, Osler and Hahn2013). If there was more than one code with the highest severity for a particular patient, the first of these codes was used. The ICDPIC program was also used to calculate an Injury Severity Score (ISS) for each patient. The ISS is based on the AIS severity scores for the patients' injuries. The AIS is an anatomical-based coding system created in 1969 by the Association for the Advancement of Automotive Medicine to classify injuries according to body region, anatomic structure, type of injury and severity of injury (Committee on Medical Aspects of Automotive Safety, 1971). Severity of injury is graded on a six-point scale based on probability of death, where a score of one is a minor injury with a 0% probability of death and a score of six has a 100% probability of death. The Stata ICDPIC program converts ICD-9 diagnosis codes into AIS severity scores using historical data from the National Trauma Data Bank and has been independently validated (Greene et al. Reference Greene, Kernic, Vavilala and Rivara2015). The ISS is the sum of the squares of the AIS scores for the three most severe injuries and can range from 0 to 75.
As is standard practice in suicide evaluation, only patients aged 10 and above were included in these analyses (Manitoba Centre for Health Policy, 2013). Comparison of observed v. expected distributions by month and day of the week were performed using chi-square tests. Comparisons of mechanism and severity of injury by sex and by age were performed using chi-square tests for categorical variables and Student's t-tests for continuous variables. Wilcoxon rank-sum tests were performed as necessary for continuous variables with skewed distributions. All analyses were performed using Stata version 14, StataCorp, College Station, Texas.
Results
A total of 1 025 482 956 ED visits between January 1, 2006 and December 31, 2013 were examined, among which 3 567 084 (348 per 100 000 visits) had an E-code indicating suicide or self-inflicted injury. There were more ED visits involving attempted suicide for females than for males: 57.4% of the sample, or 187.1 per 100 000 (95% CI: 177.6–196.6) v. 42.6%, or 145.4 per 100 000 (95% CI: 137.9–152.9). The mean age at presentation for all patients was 33.2 (SD 14.9) years; the mean age for males was 34.0 (SD 14.7) and the mean age for females was 32.7 (SD 15.1). The number of visits peaked between ages 15 and 19 years, with a rate of 351 per 100 000 population and plateaus between ages 35 and 45 (Fig. 1). While the age patterns for males and females were overall very similar, the peak for females (459 per 100 000 population at age 15–19) is earlier and much higher than the peak for males (270 per 100 000 at age 20–24). There were more visits involving suicide attempts in the lower two income quartiles (29.3% and 28.6%), with the high-income quartile comprising the lowest portion of visits (17.9%).
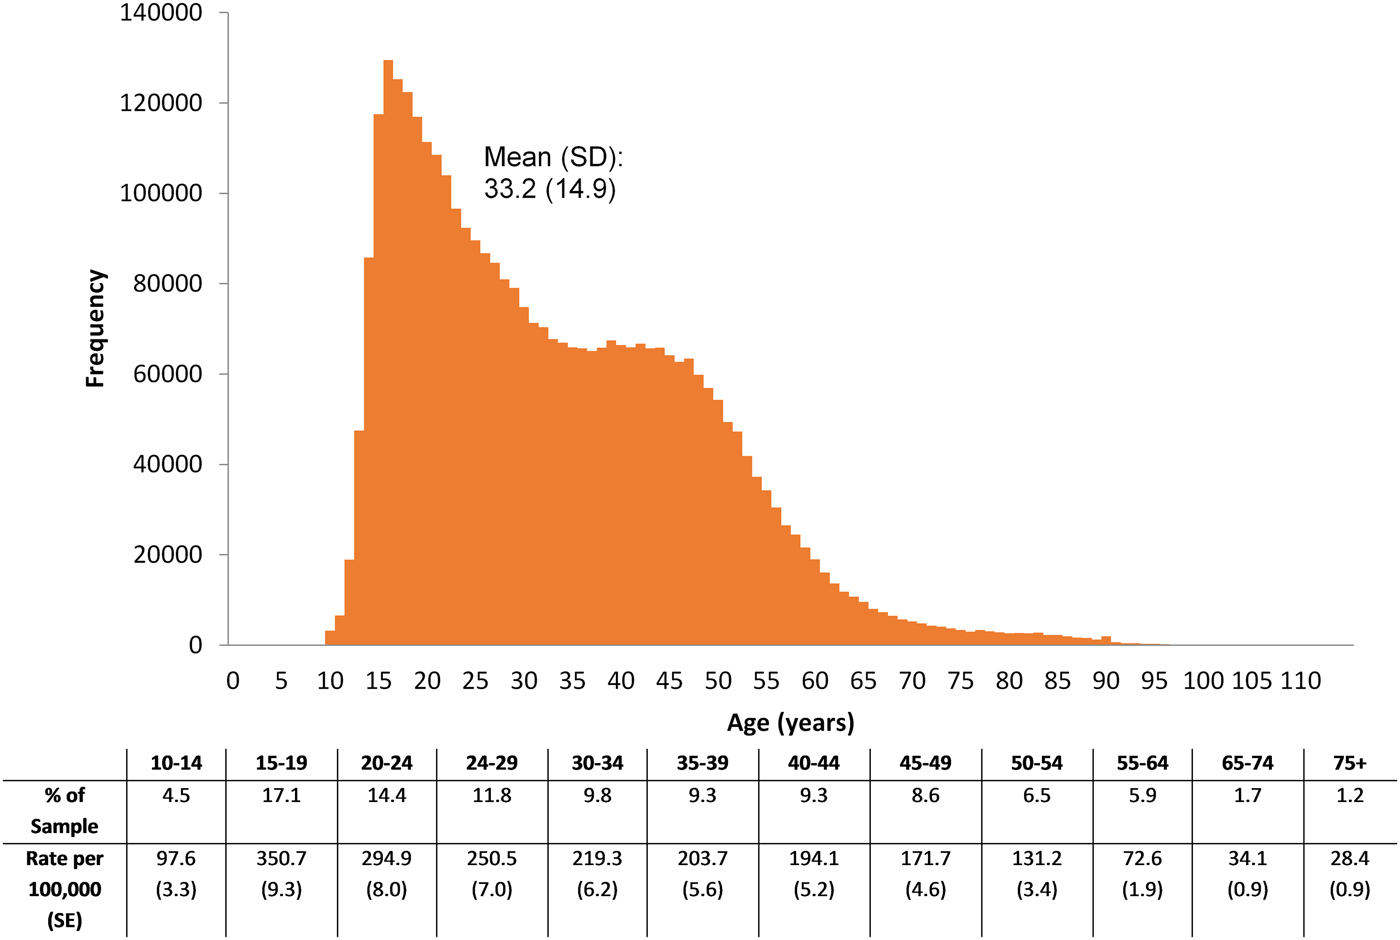
Fig. 1. Age distribution of patients presenting to the emergency department for attempted suicide in the Nationwide Emergency Department Sample (NEDS), 2006–2013 (N = 3 567 084).
The total number of suicide-related ED visits was stable between 2006 and 2013, with a population-based rate ranging from 163.1 to 173.8 per 100 000 annually. The largest fraction of visits (8.9%, N = 272 830) occurred in the month of May, with an average 1100 visits per day, or 4.60% deviation above the mean number of visits per day for the entire year. The observed seasonal variations – with visits peaking in the spring months of March (1.05% above average), April (3.35% above average), and May and peaking again in the early fall (September: 2.20% above average) before dropping dramatically in the months of November (2.53% below average) and December (7.87% below average) – were significantly different from the expected distributions (p < 0.001) (Fig. 2). These patterns were very similar between males and females, with seasonal differences being slightly more pronounced in females (both p < 0.001). There was no difference between the observed and expected frequencies of patients presenting on weekends (mean 1215 visits per day) v. weekdays (mean 1228 visits per day).
Just over one-quarter of cases (28.6%) with an identifiable mechanism of injury were classified as violent (Table 1). Poisoning, a non-violent mechanism, was by far the most common mechanism, accounting for two-thirds of suicide attempt cases. Among poisons, tranquilisers and other psychotropic agents were most commonly used, accounting for 37.4% of all poisoning cases. Specifically, the most commonly used tranquiliser was benzodiazepines (e.g. chlordiazepoxide, diazepam, flurazepam, lorazepam, medazepam, nitrazepam), reported for 48% of patients attempting suicide with tranquilisers. Based on ICD-9-CM diagnosis codes, the top five agents, accounting for over 50% of all poisoning cases were benzodiazepine-based tranquilisers (19.4%), aromatic analgesics (12.1%), antidepressants (10.9%), other antipsychotics, neuroleptics, major tranquilisers (5.6%) and unspecified drugs (4.7%). Opiates were the first poison mentioned in 0.5% of the poisoning cases, but opiates were mentioned overall in 7.1% of cases, including opium (1.6%), heroin (0.6%), methadone (0.5%) and other opiates such as codeine and morphine (4.4%).
Table 1. Mechanism of injury by E-codes relating to suicide or self-injury in the Nationwide Emergency Department Sample (NEDS), 2006–2013 (N = 3 567 084)
* Cutting, hanging, use of a firearm, jumping, crashing a vehicle, burns and electrocution were categorised as violent.
† Poisoning, drowning and exposure to extreme cold were categorised as non-violent.
‡ Other specified drugs include anti-allergics, anti-emetics and anti-convulsants.
§ Other: extremes of cold, electrocution, crashing of aircraft, other specified or unspecified means.
After poisoning, the next most common mechanism involved a cutting or piercing instrument, accounting for 22.1% of all cases. The most common injury associated with cutting or piercing instruments (31.4%, n = 233 982), was open wound of the wrist, hand and fingers [Barell Matrix category, code 26E], followed by open wound of the forearm and elbow (23.1%, n = 172 056) [Barell Matrix category, code 25E]. Of all cutting or piercing injuries with an identifiable body region of injury, 87.9% were in the extremities. Females with a cutting or piercing injury were more likely than males to have that injury in an extremity (92.3% v. 82.6%, chi-square p < 0.001).
Combining all mechanisms of injury, the mean ISS was 0.64 (SD 2.34), with 67.2% of patients having an ISS of zero, and another 31.9% having an ISS between 1 and 9. Less than 1% of patients had an ISS greater than 9. Males were more likely than females to have an ISS greater than zero (38.9% v. 28.3%; OR = 1.61; 95% CI = 1.58–1.65; p < 0.001). Among patients with an ISS greater than zero, males had a mean ISS of 2.44, compared with a mean of 1.48 for females (Student t-test p < 0.001). Males were more likely than females to use a violent mechanism (34.8% v. 24.6%; OR = 1.64; 95% CI = 1.60–1.68; p < 0.001).
The majority of patients (82.7%) had an ICD-9-CM diagnosis code indicating a concurrent mental disorder. Mood disorders were the most common diagnosis (42.1%), followed by substance-related disorders (12.1%), alcohol-related disorders (8.9%) and anxiety disorders (6.4%) (Table 2). The outcomes of patients presenting to the ED as a result of suicide attempt or self-injury were generally good. The in-hospital mortality rate for all patients was 1%, with 15 164 (0.4%) patients dying in the ED and another 20 947 (0.6%) dying after being admitted to the hospital. Most patients were admitted as an inpatient at the same hospital (39.8%, N = 1 419 533), discharged directly from the ED (32.8%, N = 1 169 589), or transferred to another institution such as a short-term hospital or an intermediate care facility (25.3%, N = 902 864).
Table 2. Mental disorder diagnoses in patients presenting to the emergency department for attempted suicide in the Nationwide Emergency Department (NEDS), 2006–2013 (N = 3 567 084)
Discussion
In this large nationally representative sample of patients from the NEDS database, we report an annual incidence of 163.1–173.8 patients presenting to the ED for attempted suicide per 100 000 population for the years 2006 through 2013. Previous papers examining the epidemiology of suicide-related visits to the ED have used the NHAMCS database (Doshi et al. Reference Doshi, Boudreaux, Wang, Pelletier and Camargo2005; Ting et al. Reference Ting, Sullivan, Boudreaux, Miller and Camargo2012). While this data source is useful for looking at long-term trends in ED visits, it relies on a relatively small sample, which makes it difficult to examine short-term trends and patterns by age, season and mechanism. For example, Doshi et al. and Ting et al. analysed 5 and 16 years, respectively, of NHAMCS data but only reported age in 5 groups: <15, 15–19, 20–29, 30–49 and ≥50 (Doshi et al. Reference Doshi, Boudreaux, Wang, Pelletier and Camargo2005; Ting et al. Reference Ting, Sullivan, Boudreaux, Miller and Camargo2012). This age categorisation could potentially obscure important details on the age distribution of suicide-related ED visits, particularly among older patients.
In our analysis, we demonstrated a seasonal pattern of ED visits for attempted suicide, with a peak in the spring, a smaller peak in the early fall and a trough in the late fall/early winter. Previous studies have shown a similar seasonal variation in suicide deaths (Lester, Reference Lester1979; Meares et al. Reference Meares, Mendelsohn and Milgrom-Friedman1981; MacMahon, Reference MacMahon1983). The NHAMCS uses a random 4-week sample window at each hospital, which could bias results depending on when in the seasonal pattern the sampling occurred. One researcher found that the bi-modal seasonal pattern was only present in females, whereas males did not have the fall peak (Meares et al. Reference Meares, Mendelsohn and Milgrom-Friedman1981). We found, however, that both females and males had the larger spring peak and the smaller fall peak. Of note, the fall peak for males was higher than that for females in our analysis and started in August rather than September. The same researchers also found that suicide is more common on Monday than on other days of the week (Lester, Reference Lester1979; MacMahon, Reference MacMahon1983). The NEDS data only distinguish between weekends and weekdays, but we did not find any differences in frequency of ED visits between weekends and weekdays.
According to the CDC, the number of deaths due to suicide in those aged 10 or above has increased in the USA from 33 289 (12.86 per 100 000) in 2006 to 41 134 (14.90 per 100 000) in 2013 (National Center for Injury Prevention and Control, 2016b ). During the same time period, however, we found no statistically significant increase in the number of ED visits for suicide-related injuries in the NEDS, an observation confirmed by the CDC/NEISS-AIP data. Changes in the number of deaths after reaching the ED among those visiting the ED with suicide-related injuries are insufficient to explain the different trends in death rates and injury rates; accordingly, this difference may be due to increasing case-fatality rates among those who attempt suicide and who never make it to the ED.
By sex, the US non-fatal suicide-related injury rate between the years 2006 and 2013 was 185.91 per 100 000 for females and 136.94 per 100 000 for males, a female:male ratio of 1.36:1 (National Center for Injury Prevention and Control, 2016c ). We found a similar pattern in the NEDS, with 187.07 suicide-related ED visits per 100 000 females and 145.40 per 100 000 males, a ratio of 1.29:1.
While there is an excess of suicide attempts among females, males are actually much more likely to die from suicide. Specifically, the US mortality rate due to suicide from 2006 to 2013 was 22.51 per 100 000 males and 5.87 per 100 000 females, corresponding to a case-fatality rate of 14.1% for males and 3.1% for females (National Center for Injury Prevention and Control, 2016b ). This substantial difference in case-fatality rate can in part be attributed to differences in the methods males and females use to attempt suicide (National Center for Injury Prevention and Control, 2016b ). Consistent with previous studies, we found that males use more violent methods to attempt suicide than females (Denning et al. Reference Denning, Conwell, King and Cox2000; Dumais et al. Reference Dumais, Lesage, Lalovic, Seguin, Tousignant, Chawky and Turecki2005). When mechanism of injury was classified as violent v. non-violent, males were 64% more likely to use a violent method than were females. Regardless of mechanism, males were also 61% more likely to have a non-zero ISS than females. This finding is particularly striking given that our analysis only included patients who presented to the ED after a suicide attempt and cannot account for suicide attempts resulting in death before presentation to the ED.
The rate of suicide-related ED visits peaks at age 15–19 and falls steadily thereafter, with a slower rate of decrease between the ages of 30 and 49 than at other ages. In fact, there is an eight-fold higher rate of suicide-related ED visits at ages 10–24 than at ages 65 and above, with the rate for ages 25–64 falling in between. This pattern is similar to that reported by the CDC, where the rate of non-fatal suicide-related injuries from 2006 to 2012 was 243.45 per 100 000 for ages 10–24, 164.09 per 100 000 for ages 25–64 and 23.76 per 100 000 for ages 65 and over (National Center for Injury Prevention and Control, 2016c ).
The decline in non-fatal suicide injuries by age is deceptive, however, as the case fatality rate reported by the CDC follows the opposite pattern, with the mortality rate due to suicide being highest among those ages 65 and over (15.02 per 100 000; case-fatality rate 38.7%), followed by those ages 25–64 (16.40 per 100 000; 9.1%), and finally those ages 10–24 (7.44 per 100 000; 3.0%) (National Center for Injury Prevention and Control, 2016b ). The age patterns are similar for males and females, but with considerably higher case-fatality rates for males, reaching a peak of 55.2% for males aged 65 and over. Conwell et al. provide a number of possible explanations for the increased case-fatality rates among older adults, including diminished physical resilience, isolation resulting in less likelihood of rescue, more advance planning, fewer advance warnings and the use of more violent and deadly methods (Conwell et al. Reference Conwell, Duberstein and Caine2002). This last explanation of more violent methods is not borne out in the NEDS data, as younger patients (particularly those under age 25) were more likely than older patients to use violent methods. It is, however, possible that many of the older men who committed suicide by violent means may never have been transported to an ED and thus were not accounted for in our analysis.
Limitations
The primary limitation of this study is that it relies on administrative data, in particular ICD-9-CM codes that are used primarily for billing purposes. A further, related limitation is that we used E-codes to identify injuries due to attempted suicide, which are not typically required in billing for trauma. In addition, the collection and reporting of E-codes varies greatly across states, as some states require collection of E-codes and others do not (Agency for Healthcare Research and Quality, 2013). Accordingly, the total number of ED visits for injuries due to attempted suicide may be underestimated. In contrast, NEISS-AIP hospitals, while lacking information on specific mechanism details such as type of poison used and seasonality, are actively monitoring their ED cases for all non-fatal injuries and recording the types and external causes of these injuries. Interestingly, however, the NEISS-AIP frequencies are slightly lower than the NEDS frequencies for the years 2006–2009, virtually identical for 2010 and slightly higher in 2011–2013, although the 95% confidence intervals overlap for all years. It is not at all apparent why the NHAMCS frequencies are so much higher than both the NEDS and the NEISS-AIP, particularly in 2010 (713 000 visits in the NHAMCS v. about 460 000 in the NEDS and NEISS-AIP). The previously noted small sample size and the random 4-week window both may contribute to considerable year-to-year variation in frequency of suicide-related ED visits in the NHAMCS.
An additional limitation of our study relates to the assessment as to whether an injury was due to homicide, suicide, or accident. There are a large number of cases in the NEDS (about 200 000 per year) for which ED personnel were not able to classify an injury as one of these three mechanisms (ICD-9-CM codes E980–E989). Accordingly, we are no doubt undercounting the number of injuries related to suicide or self-harm. This problem is likely increasing in frequency as the number of opioid overdose cases increase. However, we are not aware of any comprehensive and reliable method for reassigning a portion of those cases to the group of cases with injuries specifically identified as being related to suicide or self-harm. Moreover, we have very little information indicating whether or not a patient received a psychiatric evaluation, which might have allowed us to quantify the extent to which classification problems might be a function of the lack of such evaluations.
A related limitation of our study is that ICD-9-CM codes (E950–E959) cannot distinguish between non-suicidal self-harm and suicidal self-harm. The former has historically not been recognised as a separate mental disorder, but is now considered a distinct diagnosis in the 5th edition of the Diagnostic and Statistical Manual of Mental Disorders (Gilman, Reference Gilman2013; Wilkinson, Reference Wilkinson2013). Although the CDC has in the past reported non-fatal self-inflicted injury figures that only include suicide (Centers for Disease Control and Prevention, 2002), the publicly-available figures do not distinguish between injuries inflicted with the intent to take one's own life and those with the intent to harm oneself (National Center for Injury Prevention and Control, 2016c ).
Finally, since this analysis is limited to patients who presented to the ED, it cannot account for those who attempted suicide and did not come to the ED or who were admitted directly to inpatient care, nor can it account for those who died before being transported to an ED. Conversely, this analysis cannot account for individuals who overdosed on opioids (intentionally, or otherwise), were treated with naloxone outside of the hospital and were never transported to an ED. As such, the primary value of this analysis is to document the burden of attempted suicide and self-inflicted injury on the ED, rather than to document the incidence of attempted suicide at the population level.
Conclusion
In summary, we compared the NEDS database annual incidence of ED visits for attempted suicide and self-inflicted injury (163.1–173.8 per 100 000 for the years 2006–2013) to those previously reported from other national databases, while highlighting the value of the NEDS in allowing us to look in depth at age, sex, seasonal and mechanism patterns. We demonstrated the large and stable burden of self-inflicted injuries on US EDs as well as the high prevalence of comorbid mental disorders (82.7%) among these patients, highlighting the important role of ED staff as well as adequate funding for mental health facilities. Furthermore, we re-illustrated, using this large national database, a higher incidence of suicide attempts among women and individuals aged 15–19 years, a large seasonal peak in suicide attempts in the spring, a predominance of poisoning as the mechanism of injury for suicide attempts and a greater use of violent mechanisms in men, suggesting possible avenues for further research into strategies for prevention.
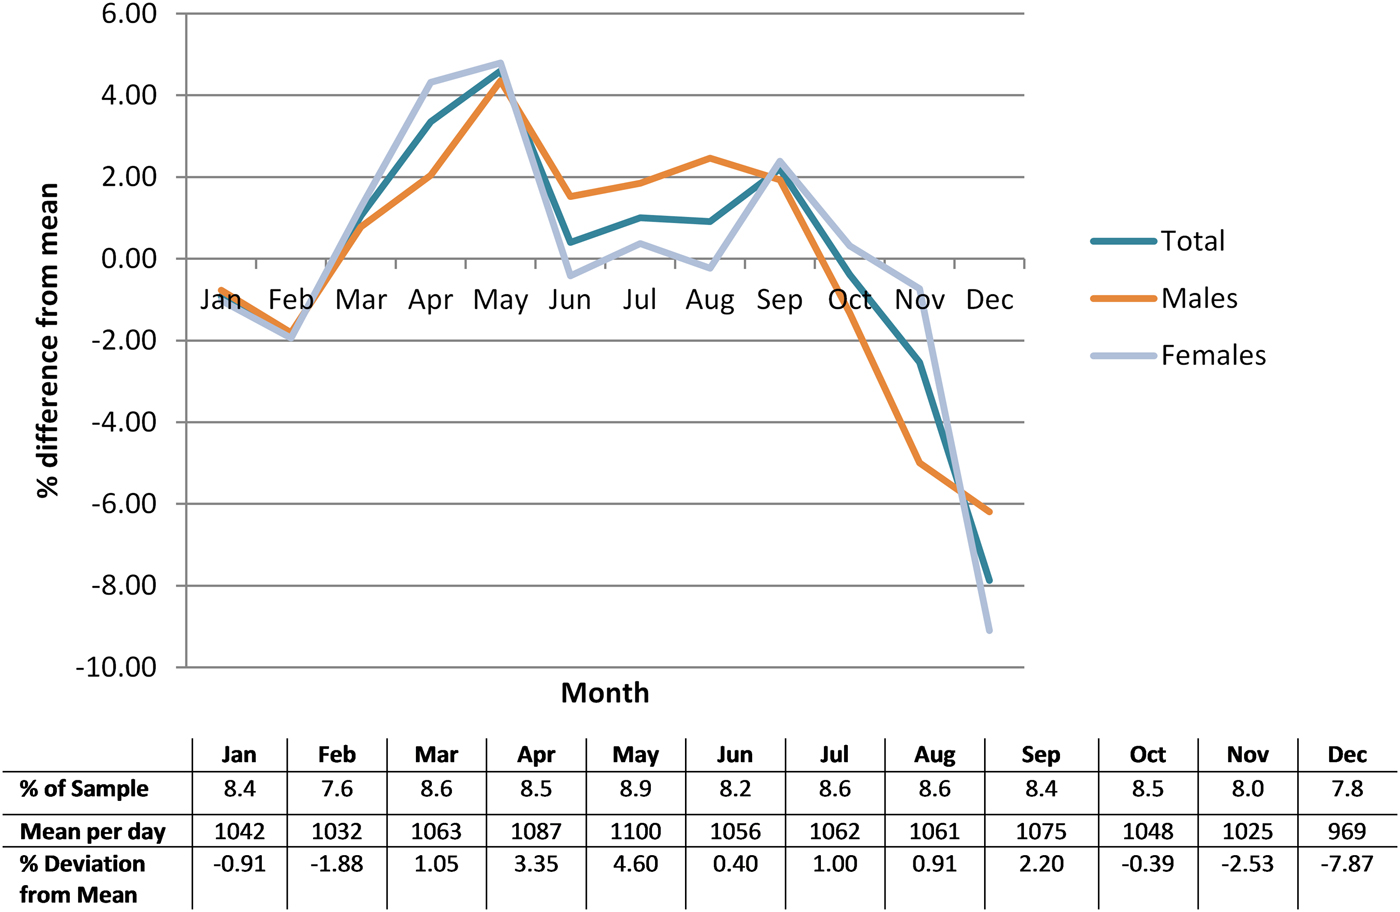
Fig. 2. Monthly distribution by sex of patients presenting to the emergency department for attempted suicide in the Nationwide Emergency Department Sample (NEDS), 2006–2013 (N = 3 567 084).
Financial Support
This research received no specific grant from any funding agency, commercial or not-for-profit sectors.
Conflict of Interest
None.
Ethical Standard
The authors assert that all procedures contributing to this work comply with the ethical standards of the relevant national and institutional committees guides on the care and use of laboratory animals.
Availability of Data and Materials
The data supporting the findings of this study were obtained from the US Agency for Healthcare Research & Quality Healthcare Cost and Utilization Project under the terms of a data use agreement which prohibits redistribution of the data. The original data sets can be obtained by any qualified researcher from https://www.distributor.hcup-us.ahrq.gov/.


